Changes in proximate composition and oil characteristics during flaxseed development
W. Herchia,*, S. Bahashwanb, H. Trabelsia, S. Boukhchinaa, H. Kallela, S. Rochutc and C. Pepec
aLaboratoire de Biochimie des Lipides, Département de Biologie, Faculté des Sciences de Tunis, 2092 ELmanar-Tunisia
bCollege of Pharmacy, Taibah University, El-Madinah El-Munawarah 116, Saudi Arabia
cUPMC University Paris 06, UMR 7075, LADIR, 75005 Paris, France
*Corresponding author: wahid1bio@yahoo.fr
| |
SUMMARY
Atmospheric Pressure Photoionization-Mass Spectrometry (APPI-MS) and High Performance Liquid Chromatography (HPLC) are the
two analytical methods that were used to characterize Triacylglycerols (TAGs) during flaxseed development. The HPLC method
of the oils showed the presence of 15 TAG species. In contrast to the HPLC chromatograms, the APPI-MS showed 17 peaks of TAG.
APPI-MS is more rapid than the HPLC method (11 min). The iodine value of the oils showed a gradual increase, while the oil
stability continuously decreased. Proximate composition during flaxseed development revealed that flaxseed is potentially
a good source of dietary energy and protein. At full maturity, flaxseed contained 37% oil and 24% protein on a dry-weight
basis; albumin was the major storage protein (53% of total storage proteins) followed by globulin (33%) and glutelin fractions
(11%). Prolamins had the lowest percentage with 3%. α-amylase activity was higher in the mature seeds than the young ones.
|
| |
RESUMEN
Cambios en la composición proximal y en las características de los aceites durante el desarrollo de semillas de linaza. Fotoionización a presión atmosférica-Espectrometría de masas (APPI-MS) y cromatografía líquida de alta resolución (HPLC)
son dos métodos de análisis que se utilizaron para caracterizar triglicéridos (TAGs) durante el desarrollo de semillas de
linaza. El método HPLC mostró la presencia de 15 especies de TAG, en contraste, los cromatogramas de APPI-MS mostraron 17
picos de TAG siendo el método APPI-MS más rápido que el de HPLC (11 min). El índice de yodo de los aceites mostró un aumento
gradual, mientras que la estabilidad disminuyó continuamente. El estudio de la composición proximal de la linaza durante su
desarrollo, mostró que esta semilla es una fuente potencialmente buena de energía y de proteína para la dieta. Al final de
la maduración, la linaza contenía 37% de aceite y 24% de proteína sobre peso seco; albúmina fue la principal proteína de almacenamiento
(53% sobre el total de las proteínas de almacenamiento) seguido de la globulina (33%) y glutelina (11%). Las prolaminas presentaron
el porcentaje más bajo con 3%. La actividad α-amilasa fue mayor en las semillas maduras que en las más jóvenes.
|
1. INTRODUCTIONTOP
Flaxseed (Linum usitatissimum L.), a member of the family Linaceae, is an economically important oilseed crop containing usually about 40% oil in the seeds.
Flaxseed, besides its traditional oleochemical uses, is now gaining recognition as a functional food ingredient for human
nutrition (Lei et al., 2003). It constitutes one of the key sources of omega-3 fatty acids, lignans and mucilage. The protein content in flaxseed has
been reported to range from 20 to 35% (Oomah, 2001). Productions of purified vegetable proteins are gaining increasing commercial importance due to consumers’ preferences for
vegetable sources as a food and cosmetic ingredient (Kaur et al., 2007). During the last decade, there has been an increasing interest in human consumption of flaxseed in the diet in order to
improve nutritional and health status. The health benefits of flaxseed are mainly attributed to its biologically active components
such as α-linolenic acid, lignans, proteins, phenolic acids and flavonoids (Hosseinian et al., 2006).
In the life cycle of higher plants, seed development is a key process connected to distinct generations (Olsen et al., 2001). The developing embryo accumulates lipids in the form of triacylglycerols (TAG), esters of glycerol and fatty acids once
early morphogenesis is achieved. The pathway of fatty acid biosynthesis in developing seeds involves different subcellular
compartments and is well established (Miquel and Browse, 1997). During the maturation stage, the most abundant mRNAs in embryos are those encoding seed storage proteins, which are thought
to serve as a source of nitrogen for the young seedlings (Pang et al., 1988). The understanding of seed metabolism and especially the accumulation of storage products is of major economic importance
and could be a key factor for sustainable agriculture. In view of functional foods and the nutraceutical attributes of flaxseed,
there is gaining focus on studying the phytochemicals of these crop components.
Although the changes in seed constituents has been studied during flaxseed development (Herchi et al., 2009; Herchi et al., 2011; Herchi et al., 2012), no comparative study is available on triacylglycerol composition during flaxseed maturity using different methods, no data
on proximate composition, protein fraction or alpha amylase activity during flaxseed development. The aim of this study was
to compare the analysis of triglycerides using HPLC and APPI-MS and to determine the change in proximate analysis, oil characteristics,
protein fraction and α-amylase activity at different stages of flaxseed maturity.
2. MATERIALS AND METHODSTOP
2.1. Chemicals and ReagentsTOP
HPLC-grade chloroform, acetone, acetonitrile, toluene and isopropanol were purchased from the Fisher Scientific Company (Ottawa,
Ontario, Canada-Ottawa Admin. Center 112 Colonnade Road Nepean, Ontario K2E 7L6 Canada). Methanol and Ethanol were purchased
from Panreac Quimica SA (Barcelona, Spain). Petroleum ether, ethyl ether and acetic acid were from Fisher Scientific SA (Barcelona,
Spain). TLC silica plates (silica gel 60 G F254, 20×20 cm, 0.2 mm thickness) were obtained from Merck (Darmstadt, Germany).
All standards were acquired from Sigma Aldrich (Madrid, Spain). Other employed chemicals and solvents used in the experiments
were purchased from Aldrich (Milwaukee, WI, USA).
2.2. Plant MaterialsTOP
The variety of flaxseed “O116” was obtained from “Institut National Recherche Agronomie Tunis” (INRAT), Tunisia. This variety
of flaxseed (Linum usitatissimum L.) was grown in restricted zones (15 m×3 m) on the Agronomy farm of the INRAT from the middle of November 2006 until the end
of June 2007. Each sample was collected at intervals after a number of days after flowering (DAF) ranging from 7 DAF to 56
DAF. Moisture and seed weight were determined by weighing 100 seeds before and after drying to constant weight in a vacuum
oven at 80 °C for 72 h. Seeds lengths were measured using a micrometer.
2.3. Lipid ExtractionTOP
The total lipids were extracted by the method of Folch et al. (1957) modified by Bligh et al. (1959). Flaxseeds (2.5 g) were washed with boiling water for 5 min to denature the phospholipases (Douce, 1964) and then crushed in a mortar with a mixture of CHCl3-MeOH (2:1, v/v). Fixing water was added and the homogenate was centrifuged at 3000 rpm for 15 min. The lower chloroformic
phase containing the total lipids was dried in a rotary evaporator at 40 °C.
2.4. Lipid AnalysesTOP
Lipid class separation was performed by TLC according to the method of Mangold (1964) using petroleum ether/ethyl ether/acetic acid (70:30:0.4, v/v/v) as developing solvent. The oil samples were placed on thin-layer
chromatographic plates (G60; Merck, Darmstadt, Germany) (20 cm×20 cm×0.2 mm) covered with silica gel using a microsyringe.
Spots were revealed by brief exposure to iodine vapor. Iodine was then removed under nitrogen flux and by heating the plates
at 60 °C. The TAG spots were then collected.
2.5. APPI-MSTOP
A 50 mg sample of the extracted lipid was fully dissolved in 5 mL of dichloromethane. LC/MS experiments were performed using
an Agilent LC system (Agilent Technologies; Palo Alto, CA-2660 Matheson Boulevard East, Mississauga ON, L4W 5M2) coupled to
an Applied Biosystem /MDS Sciex QSTAR Elite Q-TOF MS with a photoionization ion source. The TAG extracts were separated using
an Ascentis TM C18 LC column (15 cm×2.1 mm, 3 μm) with C18 guard cartridge (Supelco). The mobile phase consisted of A, acetonitrile
and B, isopropanol. A solvent gradient program was run from 30 to 90% B for 25 min. Subsequently, the LC system was programmed
to return its initial solvent composition over 0.1 min, followed by a 5 min re-equilibration prior to the following injection.
The injection volume was 5 μL and the flow rate was 200 μL·min−1. The entire effluent from the column was directly transferred to the MS through the photoionization interface. MS analysis
of the analytes was performed using APPI in the positive ion mode. Toluene was used as dopant delivered at a flow rate of
20 μL·min−1 by an isocratic pump (Agilent Technologies; Palo Alto, CA-2660 Matheson Boulevard East, Mississauga ON, L4W 5M2). Analyst
QS 2.0 software was used for data acquisition and analysis. Nitrogen was used as curtain gas, nebulizing gas, drying and lamp
gas (4 L·min−1). The mass range recorded was from 50 to 1300 amu. The other optimal instrumental conditions were as follows: photoionization
voltage 1300V; curtain gas setting 25; gas 1 setting 20 and gas 2 setting 70; de-clustering potential (DP), 35V; focusing
potential (FP), 150; second de-clustering potential (DP2), 15V; and ion source temperature: 400 °C. Estimations of TAG concentrations
were achieved using the relative peak areas of each TAG. Although this method is only semi-quantitative, likely overestimating
highly unsaturated components relative to saturates, it does allow for the evaluation of the estimation of relative TAG concentrations
and the evolution of individual TAG species over the course of seed ripening. As examples of the results, the total ion current
(TIC) chromatogram of flaxseed oil is given in Figure 1. The fatty acid composition of triacylglycerols was calculated with the following equation:
% FA=[(%TAG)×n. FA] /3
% FA: Fatty acid type percentage in individual TAG
% TAG: individual TAG percentage
n: Number of FA type esterified in individual TAG
|
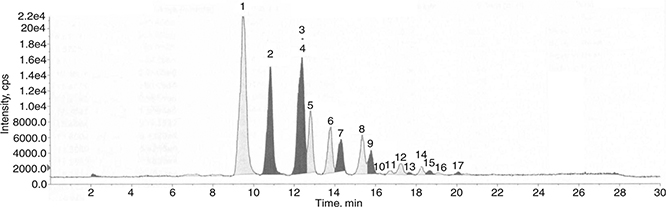 Figure 1. Total ion chromatogram (TIC) of a flaxseed oil LC/APPI-MS experiment (O116 variety-56 DAF). 1: LnLnLn, 2: LnLLn, 3: LLLn,
4: LnOLn, 5: LnLnP, 6: OLLn, 7: LnLP, 8: OOLn, 9: LnOP, 10: PLnP, 11: OLO, 12: SOLn, 13: OLP, 14: OOO, 15: OOP, 16: SLnS,
17: SOO. Figure 1. Total ion chromatogram (TIC) of a flaxseed oil LC/APPI-MS experiment (O116 variety-56 DAF). 1: LnLnLn, 2: LnLLn, 3: LLLn,
4: LnOLn, 5: LnLnP, 6: OLLn, 7: LnLP, 8: OOLn, 9: LnOP, 10: PLnP, 11: OLO, 12: SOLn, 13: OLP, 14: OOO, 15: OOP, 16: SLnS,
17: SOO.
|
|
2.6. Analysis of triacylglycerols by HPLCTOP
TAGs were analyzed by HPLC on a SCHIMADZU apparatus equipped with an RP-18 stainless steel column (250 mm length×4.6 mm internal
diameter), a guard column and a refractive index detector (differential refractometer). The mobile phase was acetonitrile/acetone
1:1 v/v. The flow rate was isocratically controlled at 1.5 mL·min−1. Ten microliters of sample were injected at each run. The identification of TAG peaks was made by comparison of their retention
times with authentic standards. The concept of the equivalent carbon number (ECN) was used to rationalize the retention time
of TAG. The ECN is defined as the total number of carbon atoms (CN) in the FA acyl chains minus twice the number of double
bonds (N) per molecule: ECN=CN-2N. Quantification of the contents of the TAG species (expressed in % of total TAG) was done
using the following formula: content (%)=PAi/TPA, where PAi is the peak area of an individual TAG and TPA is the peak area
of the total TAG. A typical HPLC chromatogram of flaxseed oil is shown in Figure 2.
|
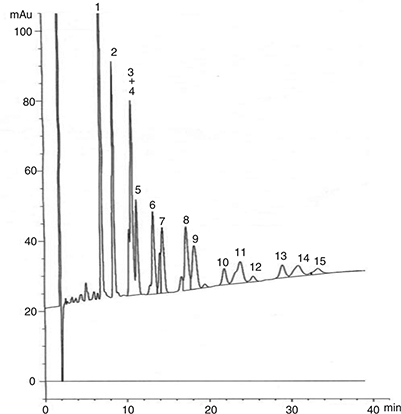 Figure 2. TAG profiles of flaxseed oil (O116 variety-56 DAF) analyzed by HPLC. 1: LnLnLn, 2: LnLLn, 3: LLLn, 4: LnOLn, 5: LnLnP, 6:
OLLn, 7: LnLP, 8: OOLn, 9: LnOP, 10: OLO, 11: SOLn, 12: OLP, 13: OOO, 14: OOP, 15: SLnS. Figure 2. TAG profiles of flaxseed oil (O116 variety-56 DAF) analyzed by HPLC. 1: LnLnLn, 2: LnLLn, 3: LLLn, 4: LnOLn, 5: LnLnP, 6:
OLLn, 7: LnLP, 8: OOLn, 9: LnOP, 10: OLO, 11: SOLn, 12: OLP, 13: OOO, 14: OOP, 15: SLnS.
|
|
2.7. Iodine Value (IV) AnalysisTOP
The AOCS Official Method was employed for the determinations of iodine value (IV) in the oil samples (AOAC, 1993).
2.8. Oil StabilityTOP
Oxidative stability was evaluated by the Rancimat method (Gutiérrez, 1989). Stability was expressed as the oxidation induction time (hours), measured with the Rancimat 743 apparatus (Metrohm Co.,
Basel, Switzerland), using an oil sample of 2 g warmed to 100 °C and an air flow of 10 L·h−1.
2.9. Proximate AnalysisTOP
2.9.1. Oil ContentTOP
Oil was extracted from 20 g of seed powder in a Soxhlet extractor for 5 h using petroleum ether (40–60 °C) as a solvent. The
result was expressed as the percentage of lipids (on a wet weight basis) (AOAC, 2005).
2.9.2. Protein ContentTOP
Protein contents were determined according to the AOAC official method (1984) using a micro-Kjeldhal apparatus. Protein was calculated according to the following formula:
% protein=%N×6.25
Data were expressed as percentages on a dry weight basis.
2.9.3. Ash ContentTOP
About 0.5 g of powdered seed samples were ignited and incinerated in a muffle furnace (Amalgam, Sheffield, England) at 550
°C for about 12 h. The total ash was expressed as a percentage on a dry weight basis.
2.9.4. Carbohydrate ContentTOP
The carbohydrate content was estimated by the difference of the mean values, i.e. [100-(protein+lipids+ash+moisture)].
2.10. EnergyTOP
The calorific value was estimated (in Kcal·100 g−1) by multiplying the percentage of crude protein, crude lipid and carbohydrate by the recommended factor (4, 9 and 4.125 respectively)
used in vegetable analysis (Hunt et al., 1987).
2.11. Digestible Crude ProteinTOP
Digestible crude protein was estimated as follows: Digestible crude protein (g)=(protein (g)×0.96–4.21) (Barrett and Larkin, 1977).
2.12. Protein FractionationTOP
Protein fractions were isolated by sequentially extracting flaxseed with different solvents (the seed to solvent ratio was
1:10, w/v, in each case) according to the modified Osborne scheme (Osborne, 1924), as described by Chavan et al. (2001): Samples (1 g) were dispersed in 10 ml of distilled water by stirring with a magnetic stirrer and extracted over 45 min
periods at room temperature (25 °C). The suspension was then centrifuged at 5,000×g for 15 min, and the resultant supernatant
was filtered. The residues were re-extracted twice more with the same solvent and the recovered filtrates were combined and
designated the ‘‘water-soluble fraction”. The residue was then extracted successively with a 0.5 M NaCl solution (pH 7.0)
of 70% (v/v) ethanol at 65 °C in a shaking water bath, and 0.1 M sodium hydroxide in order to separate the total seed proteins
into albumin, globulin, prolamin and glutelin fractions, respectively. The filtrates containing the desired protein fractions
were dialyzed against distilled water for 48 h at 4 °C and separately lyophilized. The protein content of each fraction was
determined by the micro-Kjeldahl procedure (AOAC, 1984).
2.13. Assay of α-amylase activityTOP
Weighed flaxseed (500 mg seeds for each assay) were homogenized with four volumes of extraction buffer containing 50 mmol·L−1 Tris-HCl (pH 7.0), 3 mmol·L−1 CaCl2, and 4 mmol·L−1 NaCl and centrifuged at 8000 g for 20 min. The supernatant was centrifuged at 20 000 g for 20 min. A 200-mL aliquot of the
final supernatant was mixed with 50 mL of β-limited dextrin made from potato starch with β-amylase (Kohno and Nanmori, 1991). After incubation at 37 °C for 5 min, 0.5 mL of a 0.1% iodine–0.3% potassium iodide solution (I2-KI), and 2 mL distilled water were added to the reaction mixture. The change in color was recorded at 620 nm with the extraction
buffer as the blank control. A unit of activity was defined as the amount of enzyme that caused a decrease in absorbance of
0.1 at 620 nm under the assay conditions (Chen et al., 1998).
2.14. StatisticsTOP
Statistical analysis was performed using the Proc ANOVA in SAS (software version 8). Results are presented as the means ±
SD from three triplicates of each sample.
3. RESULTS AND DISCUSSIONTOP
3.1. Seed size change during flaxseed developmentTOP
The stages and seeds lengths are given in Table 1. Flaxseed development can be divided into 8 stages. This study used seed size and color to determine time of maturity. The
plant growth and especially the flowering were followed daily to provide a precise determination of the maturation stage which
proved to be a very important parameter (Attoumbré et al., 2011). Seed size increased to a peak value at S7–S8 stages (Table 1). The average length of mature flaxseeds was 6.0–6.5 mm. At stage S8, seeds were considered as mature according to the characteristic
brown color of mature seeds.
Table 1. Changes in seed length during flaxseed development
| Stages |
DAF |
Seed length (mm) |
| S1 |
7 |
1–1.5 |
| S2 |
14 |
2–2.5 |
| S3 |
21 |
3–3.5 |
| S4 |
28 |
4–4.5 |
| S5 |
35 |
5–5.5 |
| S6 |
42 |
5.5–6 |
| S7 |
49 |
6–6.5 |
| S8 |
56 |
6–6.5 |
3.2. Changes in lipid composition and characteristics during flaxseed developmentTOP
3.2.1. Changes in triacylglycerols composition during flaxseed developmentTOP
The HPLC technique with an RP-18 column separates TAG according to both length and unsaturation degree of their carbon chains.
Oil samples were dissolved in acetone and directly injected into an HPLC column without any preliminary chemical derivatization
or purification. The identification of TAG peaks was made by comparison of their retention times with authentic standards.
The TAG peaks appear between 7 and 34 min retention time (27 min) and this is due to the various TAG species in flaxseed oils.
The TAG composition during flaxseed development, expressed as a percentage of total TAG peak area, is presented in Table 2. The results show the presence of 15 TAG which differ in their contents during flaxseed development. The major forms observed
were LnLnLn, LnLLn and LnOLn. Contrary to the HPLC method, the APPI-MS presented 17 TAG peaks with more information about
the mass value of TAG. The TAG peaks provided by LC-APPI-MS appear between 10 and 21 min retention times (11 min). The method
(APPI-MS) described is more rapid than the HPLC method. One of the main characteristics of APPI-MS, in addition to high mass
resolution, is its outstanding sensitivity. These advantages result in extremely low detection limits, leading to a new dimension
in speciation analysis. It has been reported that TAG content changes during seed development (Herchi et al., 2012). The average of Triunsaturated triacylglycerols was found between 75% and 85% during flaxseed development. The highest percentage
of diunsaturated triacylglycerosls (25%) was found at 35 DAF. Using the TLC method, and compared to given results by LC/MS
(Herchi et al., 2012), the same pattern of total TAG accumulation in flaxseed during seed development was revealed. At 7 DAF, the TAG represented
a small fraction of the total lipid population (8%) but their proportion increased gradually to reach 94% at complete maturity
(56 DAF).
Table 2. Comparative analysis of triacylglycerols during flaxseed development using HPLC and APPI-MS
| TAG |
ECN |
Rt (min) |
7 |
14 |
21 |
28 |
35 |
42 |
49 |
56 |
| APPI-MS |
|
|
|
|
|
|
|
|
|
|
| LnLnLn |
36 |
9.51 |
28.50±1.0 |
25.11±0.5 |
23.67±0.9 |
22.58±0.6 |
24.69±0.8 |
23.18±1.1 |
21.74±0.6 |
29.80±0.9 |
| LnLLn |
38 |
10.86 |
17.32±0.4 |
14.24±0.1 |
15.51±0.2 |
15.73±0.6 |
12.78±0.5 |
12.76±0.4 |
12.20±0.2 |
16.60±0.3 |
| LLLn |
40 |
12.13 |
7.36±0.1 |
8.23±0.2 |
8.50±0.3 |
7.22±0.2 |
6.00±0.1 |
6.22±0.1 |
6.16±0.3 |
7.30±0.3 |
| LnOLn |
40 |
12.41 |
17.45±0.4 |
17.52±0.7 |
20.38±1.1 |
18.16±0.9 |
22.82±0.9 |
21.08±0.8 |
22.86±1.3 |
14.60±1.2 |
| LnLnP |
40 |
12.81 |
8.43±0.9 |
8.02±0.5 |
6.27±0.5 |
7.60±0.6 |
5.91±0.7 |
6.28±0.6 |
5.84±0.7 |
7.40±1.0 |
| OLLn |
42 |
13.81 |
4.32±0.5 |
7.44±0.4 |
6.80±0.8 |
11.48±0.5 |
5.88±0.7 |
7.14±0.6 |
8.44±0.9 |
5.90±0.1 |
| LnLP |
42 |
14.30 |
5.87±0.5 |
5.73±0.5 |
6.18±0.6 |
4.20±0.3 |
4.50±0.3 |
3.66±0.1 |
3.62±0.2 |
4.70±0.3 |
| OOLn |
44 |
15.36 |
3.52±0.1 |
6.23±0.1 |
5.72±0.2 |
5.40±0.1 |
8.37±0.4 |
10.62±0.6 |
9.45±0.6 |
5.60±0.3 |
| LnOP |
44 |
15.79 |
2.64±0.1 |
2.73±0.1 |
2.68±0.1 |
3.26±0.2 |
3.34±0.2 |
3.50±0.1 |
3.51±0.5 |
3.00±0.4 |
| PLnP |
44 |
16.19 |
0.02±0.0 |
0.02±0.0 |
0.02±0.0 |
0.01±0.0 |
0.01±0.0 |
0.01±0.0 |
0.01±0.0 |
0.01±0.0 |
| OLO |
46 |
16.72 |
0.51±0.1 |
0.53±0.1 |
0.49±0.1 |
0.52±0.1 |
0.67±0.1 |
0.62±0.1 |
0.71±0.2 |
0.60±0.1 |
| SOLn |
46 |
17.26 |
2.17±0.1 |
2.34±0.2 |
1.84±0.1 |
1.78±0.1 |
2.39±0.1 |
2.40±0.2 |
2.24±0.2 |
2.20±0.1 |
| OLP |
46 |
17.64 |
0.18±0.01 |
0.14±0.01 |
0.19±0.02 |
0.22±0.02 |
0.35±0.01 |
0.21±0.02 |
0.24±0.03 |
0.25±0.05 |
| OOO |
48 |
18.24 |
0.66±0.02 |
0.62±0.02 |
0.74±0.01 |
0.81±0.01 |
0.95±0.01 |
0.83±0.02 |
1.70±0.1 |
0.87±0.05 |
| OOP |
48 |
18.63 |
0.47±0.01 |
0.43±0.01 |
0.54±0.01 |
0.53±0.01 |
0.74±0.01 |
0.79±0.02 |
0.64±0.01 |
0.60±0.01 |
| SLnS |
48 |
19.08 |
0.32±0.01 |
0.38±0.01 |
0.21±0.01 |
0.14±0.01 |
0.18±0.01 |
0.21±0.01 |
0.28±0.01 |
0.20±0.01 |
| SOO |
50 |
20.05 |
0.26±0.01 |
0.29±0.01 |
0.26±0.01 |
0.36±0.01 |
0.42±0.01 |
0.49±0.01 |
0.36±0.01 |
0.39±0.02 |
| HPLC |
|
|
|
|
|
|
|
|
|
|
| LnLnLn |
36 |
7.11 |
21.45±0.7 |
23.28±0.8 |
22.44±0.6 |
22.15±0.5 |
21.25±0.4 |
23.12±0.5 |
22.41±0.6 |
23.62±0.7 |
| LnLLn |
38 |
8.60 |
19.32±0.3 |
19.43±0.4 |
19.40±0.3 |
19.25±0.4 |
18.86±0.5 |
19.11±0.4 |
19.47±0.4 |
19.68±0.5 |
| LLLn |
40 |
10.04 |
7.13±0.2 |
6.56±0.2 |
6.33±0.4 |
6.38±0.3 |
6.52±0.2 |
7.18±0.3 |
6.47±0.2 |
6.32±0.3 |
| LnOLn |
40 |
10.24 |
10.30±0.2 |
10.52±0.3 |
11.28±0.2 |
10.56±0.1 |
11.18±0.3 |
11.10±0.2 |
11.20±0.2 |
10.60±0.3 |
| LnLnP |
40 |
11.18 |
8.20±0.2 |
8.69±0.3 |
9.14±0.3 |
7.76±0.1 |
8.60±0.3 |
8.55±0.2 |
8.14±0.2 |
8.26±0.2 |
| OLLn |
42 |
13.24 |
8.16±0.3 |
6.81±0.2 |
7.02±0.3 |
8.11±0.4 |
7.10±0.2 |
7.21±0.3 |
7.06±0.2 |
7.08±0.2 |
| LnLP |
42 |
14.84 |
5.07±0.1 |
5.24±0.1 |
5.33±0.1 |
5.62±0.1 |
5.93±0.3 |
5.61±0.1 |
5.42±0.2 |
5.51±0.1 |
| OOLn |
44 |
17.40 |
6.10±0.1 |
6.19±0.1 |
5.74±0.1 |
6.35±0.1 |
6.38±0.2 |
5.41±0.1 |
5.75±0.1 |
5.64±0.1 |
| LnOP |
44 |
18.08 |
4.73±0.1 |
4.90±0.1 |
4.18±0.1 |
5.28±0.2 |
4.13±0.1 |
4.23±0.1 |
4.37±0.1 |
4.13±0.1 |
| OLO |
46 |
22.00 |
1.55±0.1 |
1.71±0.1 |
1.48±0.1 |
1.22±0.1 |
1.64±0.1 |
1.52±0.1 |
1.55±0.1 |
1.57±0.1 |
| SOLn |
46 |
23.80 |
3.00±0.3 |
2.83±0.1 |
2.77±0.1 |
2.90±0.2 |
2.68±0.1 |
2.72±0.1 |
3.08±0.1 |
2.95±0.2 |
| OLP |
46 |
25.94 |
0.70±0.02 |
0.44±0.01 |
0.69±0.02 |
0.55±0.01 |
0.47±0.01 |
0.77±0.02 |
0.80±0.02 |
0.78±0.04 |
| OOO |
48 |
29.37 |
2.13±0.2 |
1.50±0.1 |
1.79±0.1 |
1.90±0.1 |
1.81±0.1 |
1.62±0.1 |
1.94±0.1 |
1.96±0.1 |
| OOP |
48 |
30.46 |
1.28±0.1 |
1.14±0.1 |
1.68±0.1 |
1.15±0.1 |
1.75±0.1 |
1.17±0.1 |
1.80±0.2 |
1.37±0.1 |
| SLnS |
48 |
33.22 |
0.88±0.02 |
0.76±0.01 |
0.73±0.02 |
0.82±0.02 |
0.70±0.01 |
0.68±0.01 |
0.54±0.01 |
0.98±0.1 |
| Each value is the mean ± SD of three determinations. |
| P: palmitic; S: stearic; O: oleic; L: linoleic; Ln: linolenic acid. |
3.2.2. Changes in the fatty acid composition of triacylglycerolsTOP
The comparative fatty acid composition of TAGs was analyzed during flaxseed development for the first time, using HPLC and
LC-APPI-MS (Table 3). The different FA and their percentages provided by LC-APPI-MS are in agreement with those listed by HPLC. Saturated fatty
acids (SFA) did not exceed 9% while Monounsaturated fatty acids (MUFA) ranged from 13 to 22%. The monounsaturated fatty acids
such as oleic acid have great importance because of their nutritional implication and effect on the oxidative stability of
oils (Aguilera et al., 2000). Polyunsaturated fatty acids (PUFA) are the major fatty acids, ranging from 73 to 80%. The unsaturated / saturated ratio
(ratio of the sum of unsaturated FA to the sum of saturated FA) was generally high and this high value gives this oil a good
prevention of oxidation.
Table 3. Comparative analysis of fatty acids of triacylglycerols during flaxseed development as estimated from HPLC and LC/MS
data
| DAF |
C16:0 |
C18:0 |
C18:1 |
C18:2 |
C18:3 |
ΣSFA
|
ΣMUFA
|
ΣPUFA
|
TU |
TU/TS |
| APPI-MS
|
| 7 |
5.88±0.1 |
1.02±0.01 |
12.75±0.2 |
12.25±0.1 |
68.10±0.3 |
6.90±0.11 |
12.75±0.2 |
80.35±0.4 |
93.10±0.6 |
13.49±0.5 |
| 14 |
5.70±0.1 |
1.03±0.01 |
15.66±0.2 |
14.84±0.1 |
62.77±0.2 |
6.73±0.11 |
15.66±0.2 |
77.61±0.3 |
93.27±0.5 |
13.86±0.4 |
| 21 |
5.30±0.1 |
0.84±0.03 |
16.06±0.1 |
15.39±0.2 |
62.41±0.2 |
6.14±0.13 |
16.06±0.1 |
77.80±0.4 |
93.86±0.5 |
15.29±0.3 |
| 28 |
5.28±0.1 |
0.81±0.01 |
17.00±0.2 |
15.53±0.2 |
61.38±0.2 |
6.09±0.11 |
17.00±0.2 |
76.91±0.4 |
93.91±0.5 |
15.42±0.4 |
| 35 |
5.00±0.1 |
1.06±0.01 |
19.34±0.1 |
12.06±0.1 |
62.54±0.3 |
6.06±0.11 |
19.34±0.1 |
74.60±0.4 |
93.94±0.5 |
15.50±0.4 |
| 42 |
4.82±0.1 |
1.10±0.02 |
20.62±0.2 |
12.28±0.1 |
61.18±0.1 |
5.92±0.12 |
20.62±0.2 |
73.46±0.2 |
94.08±0.5 |
15.89±0.4 |
| 49 |
4.62±0.1 |
1.05±0.01 |
21.57±0.2 |
12.51±0.1 |
60.25±0.3 |
5.67±0.11 |
21.57±0.2 |
72.76±0.4 |
94.33±0.5 |
16.64±0.4 |
| 56 |
5.30±0.1 |
1.00±0.01 |
14.30±0.1 |
14.00±0.2 |
65.4±0.2 |
6.30±0.11 |
14.30±0.1 |
79.4±0.4 |
93.7±0.5 |
14.87±0.4 |
| HPLC |
| 7 |
6.66±0.1 |
1.60±0.02 |
17.04±0.1 |
16.35±0.1 |
58.35±0.3 |
8.26±0.12 |
17.04±0.1 |
74.70±0.4 |
91.74±0.5 |
11.11±0.4 |
| 14 |
6.80±0.1 |
1.45±0.01 |
16.03±0.2 |
15.58±0.2 |
60.14±0.3 |
8.25±0.11 |
16.03±0.2 |
75.72±0.5 |
91.75±0.7 |
11.12±0.6 |
| 21 |
7.00±0.1 |
1.41±0.01 |
16.37±0.1 |
15.53±0.2 |
59.69±0.3 |
8.41±0.11 |
16.37±0.1 |
75.22±0.5 |
91.59±0.6 |
10.89±0.5 |
| 28 |
6.78±0.1 |
1.51±0.02 |
16.85±0.2 |
15.84±0.1 |
59.02±0.3 |
8.29±0.12 |
16.85±0.2 |
74.86±0.4 |
91.71±0.6 |
11.06±0.5 |
| 35 |
7.00±0.1 |
1.36±0.02 |
16.84±0.1 |
15.68±0.1 |
59.12±0.3 |
8.36±0.12 |
16.84±0.1 |
74.80±0.4 |
91.64±0.5 |
10.96±0.4 |
| 42 |
6.77±0.1 |
1.36±0.01 |
15.70±0.1 |
16.19±0.2 |
60.00±0.3 |
8.13±0.11 |
15.70±0.1 |
76.19±0.5 |
91.89±0.6 |
11.30±0.5 |
| 49 |
6.84±0.1 |
1.39±0.03 |
16.84±0.2 |
15.75±0.2 |
59.18±0.3 |
8.23±0.13 |
16.84±0.2 |
74.93±0.5 |
91.77±0.7 |
11.15±0.5 |
| 56 |
6.68±0.1 |
1.64±0.01 |
16.19±0.1 |
15.75±0.2 |
59.74±0.3 |
8.32±0.11 |
16.19±0.1 |
75.49±0.5 |
91.68±0.6 |
11.02±0.5 |
| Each value is the mean ± SD of three determinations. |
| SFA: saturated fatty acids, MUFA: monounsaturated fatty acids, PUFA: polyunsaturated fatty acids, TU: total unsaturated fatty
acids, TU/TS: total unsaturated/total saturated fatty acids.
|
3.2.3. Changes in oil characteristics during flaxseed developmentTOP
Table 4 illustrates the changes in iodine value (I.V) during flaxseed development. The relatively high iodine value (156 g I2·100 g−1 oil) and (176 g I2 100·g−1 oil) during flaxseed development may be indicative of the presence of many unsaturated bonds and can thus be grouped as drying
oils. The continuous increase in the iodine value during flaxseed development means that the oil is becoming more and more
unsaturated in character. Oxidative stability is an important parameter to evaluate the quality of oils, as it gives a good
estimation of their susceptibility to oxidative degeneration which is the main cause of their alteration. Oil stability decreased
during flaxseed development (Table 4). This decrease in stability is due to the loss of natural antioxidants. These results are in accordance with those of Baccouri
et al. (2007). The resistance to oxidative deterioration is usually attributed to two main factors: (I) the fatty acid composition, which
in the case of flaxseed oil is characterized by a large amount of polyunsaturated fatty acids and (II) the pool of minor compounds
of powerful antioxidant activity which is constituted mainly by tocopherols and polyphenols but also by chlorophylls and carotenoids.
Table 4. Changes in Iodine value, Oil stability and triacylglycerol content during flaxseed development
| DAF |
I.V
(g I2·100 g−1 oil)
|
Oil stability
(h) |
Triuns TAG (%) |
Diuns TAG (%) |
Monouns TAG (%) |
TAG |
| APPI-MS |
HPLC |
APPI-MS |
HPLC |
APPI-MS |
HPLC |
content (%)a |
content (%)b |
| 7 |
155.30±0.82 |
2.4±0.2 |
79.64±2.62 |
76.14±2.10 |
20.02±1.63 |
22.98±0.82 |
0.34±0.01 |
0.88±0.02 |
10.96±1.0 |
8.46±1.4 |
| 14 |
159.22±0.25 |
2.2±0.1 |
79.92±2.12 |
76.00±1.58 |
19.68±1.33 |
23.24±0.71 |
0.40±0.01 |
0.76±0.01 |
14.99±1.3 |
16.32±0.6 |
| 21 |
163.55±0.63 |
2.0±0.2 |
81.81±3.61 |
75.48±2.10 |
17.96±1.34 |
23.79±0.72 |
0.23±0.01 |
0.73±0.02 |
22.41±0.9 |
38.55±2.2 |
| 28 |
165.78±0.70 |
2.0±0.1 |
81.90±3.02 |
75.92±2.00 |
17.95±1.23 |
23.26±0.71 |
0.15±0.01 |
0.82±0.02 |
26.21±0.8 |
56.12±2.6 |
| 35 |
172.64±0.21 |
1.8±0.1 |
82.16±3.51 |
74.74±2.00 |
17.65±1.33 |
24.56±0.91 |
0.19±0.01 |
0.70±0.01 |
34.51±1.2 |
70.46±1.7 |
| 42 |
174.32±0.44 |
1.6±0.2 |
82.45±3.72 |
76.27±2.00 |
17.33±1.05 |
23.05±0.62 |
0.22±0.01 |
0.68±0.01 |
80.77±1.1 |
84.60±0.8 |
| 49 |
175.46±0.76 |
1.5±0.1 |
83.26±4.20 |
75.85±2.27 |
16.45±1.65 |
23.61±0.82 |
0.29±0.01 |
0.54±0.01 |
85.79±1.2 |
90.82±2.7 |
| 56 |
176.24±0.70 |
1.4±0.1 |
81.27±3.24 |
76.47±2.3 |
18.52±1.88 |
22.55±0.74 |
0.21±0.02 |
0.98±0.1 |
87.47±1.8 |
94.24±3.1 |
| aby LC-APPI-MS (Herchi et al., 2012).
|
| bby TLC method.
|
| Each value is the mean ± SD of three determinations. |
| TriunsTAG: Triunsaturated TAG, DiunsTAG: Diunsaturated TAG, MonounsTAG: Monounsaturated TAG. |
3.3. Changes in proximate composition during flaxseed developmentTOP
The changes in proximate composition during flaxseed development are shown in Table 5. The moisture content (74% at 7 DAF) decreased continuously in weight as maturity progressed to obtain a maximum of 5% at
ripe seed (56 DAF). The gradual decline in relative water content is likely due to the accumulation of dry matter as it is
in agricultural species (Lee et al., 2008). The protein levels increased gradually from 8% at 7 DAF to 24% at complete maturity, which was attributed to the rapid
synthesis of oil and carbohydrates in early seed development (Saldivar et al., 2011). The results indicate that flaxseed is a good source of protein and lipids for human consumption. The ash content showed
a continuous increase during flaxseed development in that the highest level of ash (3.20%) was observed at complete maturity.
This observation finds great support in the literature (Mueller et al., 2010). The level of total carbohydrates (by difference) fluctuated and no definite trend was obvious, although the highest amount
(31%) was detected at complete maturity. The total energy values for the seeds analyzed indicated that the mature seeds (49
DAF) which contained significantly the highest oil content had more total energy (2400 Kj·100 g−1) than the other stages. Flaxseed could therefore be a good supplement as a source of energy in feed formulation. The estimated
digestible crude protein ranged from 3% (7 DAF) to 19% (49 DAF). From the foregoing discussion, it may be concluded that flaxseed
is potentially a good source of dietary energy and protein.
Table 5. Proximate analysis and digestible protein during flaxseed development
| DAF |
7 |
14 |
21 |
28 |
35 |
42 |
49 |
56 |
| Moisture (%) |
74.30±0.60 |
60.70±0.91 |
43.60±0.84 |
36.50±0.76 |
24.70±0.42 |
13.20±0.34 |
8.80±0.18 |
5.40±0.20 |
| Protein (%) |
7.59±0.24 |
10.09±0.40 |
14.25±0.52 |
20.56±0.71 |
21.67±0.36 |
22.16±0.64 |
24.43±0.78 |
23.84±0.62 |
| Oils (%) |
8.04±0.21 |
16.63±0.20 |
21.87±0.57 |
31.42±0.39 |
34.42±0.67 |
38.75±0.61 |
43.70±0.94 |
36.61±0.58 |
| Ash (%) |
1.64±0.05 |
1.68±0.03 |
1.92±0.05 |
2.10±0.04 |
2.34±0.04 |
2.76±0.08 |
2.90±0.06 |
3.20±0.10 |
| Total carbohydrate (%) |
8.43±0.29 |
10.09±0.80 |
18.36±0.17 |
9.42±0.23 |
16.87±0.95 |
23.13±0.60 |
20.17±0.38 |
30.95±0.72 |
| Energy (Kcal·100 g−1)
|
137.49±1.88 |
231.65±1.95 |
329.56±1.08 |
403.88±1.55 |
466.06±1.80 |
532.8±0.90 |
574.25±1.20 |
552.52±1.53 |
| Energy (Kj·100 g−1)
|
575.27±2.23 |
969.25±2.37 |
1378.91±3.18 |
1689.87±2.66 |
1950.04±1.74 |
2229.30±2.84 |
2402.72±1.90 |
2311.80±3.28 |
| Digestible protein (%) |
3.07±0.22 |
5.47±0.30 |
9.47±0.72 |
15.52±0.46 |
17.00±0.54 |
17.06±0.81 |
19.24±0.24 |
18.67±0.50 |
| Each value is the mean ± SD of three determinations. |
3.4. Changes in Protein fractions during flaxseed developmentTOP
Osborne (1924) classified seed protein into four groups on the basis of their different solubilities: albumins (water soluble), globulins
(soluble in dilute salt solutions), prolamins (soluble in aqueous alcohols) and glutelins (dilute acid). Flaxseed accumulates
albumin as a major protein (Table 6). The highest percentage in albumin (65%) was observed at 28 DAF. The level of globulins increased at the beginning of seed
development and decreased before the end of seed maturation. Both albumins and globulins represented the most abundant soluble
protein (from 62 to 87% of total soluble proteins) during flaxseed development. Since albumins are mostly enzyme proteins
(Bewley and Black, 1978), the synthesis of enzymes during ripening might be responsible for the apparent increase in the content of the water-soluble
fraction. Prolamins declined rapidly during the initial 2 to 4 weeks of flaxseed development and then remained in a relatively
constant content. Glutelins followed a similar pattern but then increased throughout the final ripening stages. Our results
show that at full maturity, protein was a mixture of albumins (53%), globulin (33%), prolamin (3%) and glutelin (11%). These
findings are in agreement with the results of Wanasundara et al. (1999) who reported that the major classes of flaxseed proteins were albumins and globulins.
Table 6. Protein fractionation yield (%) during flaxseed development
| Osborne protein fraction/DAF |
7 |
14 |
21 |
28 |
35 |
42 |
49 |
56 |
| Albumin |
52.25±0.50 |
50.32±0.30 |
48.75±0.77 |
65.10±1.34 |
55.00±1.10 |
56.06±0.90 |
63.04±1.15 |
52.63±0.90 |
| Globulin |
12.50±0.18 |
14.65±0.44 |
14.54±0.20 |
20.86±0.78 |
30.82±0.30 |
31.11±0.90 |
24.63±0.70 |
32.54±0.82 |
| Prolamin |
18.23±0.25 |
17.51±0.32 |
16.34±0.10 |
4.31±0.46 |
4.61±0.17 |
3.97±0.10 |
3.17±0.11 |
3.34±0.14 |
| Glutelin |
17.01±0.60 |
17.51±0.33 |
20.36±0.56 |
9.72±0.18 |
9.56±0.20 |
8.85±0.38 |
9.15±0.22 |
11.48±0.34 |
| Each value is the mean ± SD of three determinations. |
3.5. Changes in α-amylase ActivityTOP
A low α-amylase activity was observed at the beginning of seed maturation (Figure 3). However, from 28 DAF, the α-amylase activity in flaxseed increased to be more than 0.3 units/10mg. α-amylase was involved
in starch breakdown at later development stages (Monma et al., 1991). The highest α-amylase activity was recorded at 49 DAF. After that, the activity of α-amylase decreased again. This decrease
may be explained by the decrease in the break-down of starch at late developmental stages and with concomitant lower soluble
sugar. Flaxseed has low starch content at complete maturity (1–2%) (Epaminondas et al., 2011). Relatively high α-amylase activity was concomitant with the lower starch content in flaxseed. It has an active role in
the hydrolysis of the starch during seed development. It may also be responsible for the maintenance of requisite water potential,
by providing solute sugars during seed development (Murtaza and Asghar, 2012).
|
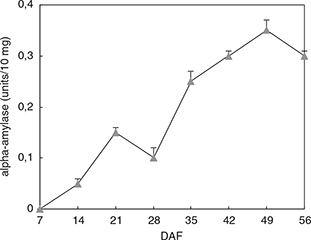 Figure 3. α-amylase activity during flaxseed development (vertical bars indicate standard deviation of the means). Figure 3. α-amylase activity during flaxseed development (vertical bars indicate standard deviation of the means).
|
|
4. CONCLUSIONSTOP
APPI-MS analyses give more information about the separation and molecular distribution of TAG molecules compared to HPLC.
Oil characteristics change during flaxseed development. The proximate components are accumulated at different rates. It may
be concluded that flaxseed is potentially a good source of dietary energy and protein. These results improve our knowledge
about the effect of maturation on flaxseed quality and composition. The major classes of protein were albumins and globulins.
The highest α-amylase activity was recorded at 49 DAF.
ACKNOWLEDGMENTSTOP
The authors gratefully acknowledge Dr. Hamadi Ben Saleh at INRAT for technical assistance in conducting the culture of flaxseed.
REFERENCESTOP
| ○ |
Aguilera MC, Ramirez-Tortosa MC, Mesa MD, Gil A. 2000. Do MUFA and PUFA have beneficial effects on development of cardiovascular
disease? In: Pandai SG (Eds) Recent research developments in lipids. Adv. Lipid Res. 1, 369–390.
|
| ○ |
American Oil Chemists Society (AOCS). 1993. Official Methods and Recommended Practices of the American Oil Chemists’ Society,
4th edn., edited by D. Firestone, AOCS Press, Champaign, IL.
|
| ○ |
Association of Official Analytical Chemists (AOAC). 1984. Official Methods of the Association of Official Analytical Chemists,
fourteenth ed. AOAC, Arlington, Method 28.110.
|
| ○ |
Association of Official Analytical Chemists (AOAC). 1990. Official methods of analysis, 15th edn. Association of Official
Analytical Chemists, Washington, DC.
|
| ○ |
Association of Official Analytical Chemists (AOAC). 2005. In: Firestone D (Ed) Official methods of analysis of the Association
of the Official Analytical Chemists. Assoc Off Anal Chem Inc, VA.
|
| ○ |
Attoumbré J, Boubé A, Laoualy M, Bienaimé C, Dubois F, Baltora-Rosset S. 2011. Investigation of lignan accumulation in developing
Linum usitatissimum seeds by immunolocalization and HPLC. Phytochem. Lett. 4, 194–198. http://dx.doi.org/10.1016/j.phytol.2011.03.004.
|
| ○ |
Baccouri B, Zarrouk W, Krichene D, Nouairi I, Ben Youssef N, Daoud D, Zarrouk M. 2007. Influence of Fruit Ripening and Crop
Yield on Chemical Properties of Virgin Olive Oils from Seven Selected Oleasters (Olea europea L.). J. Agron. 6, 388–396. http://dx.doi.org/10.3923/ja.2007.388.396.
|
| ○ |
Barrett MA, Larkin PJ. 1977. Milk and beef production in the tropics. London: ELBS and Oxford University Press. |
| ○ |
Bewley JD, Black N. 1978. In Physiology and biochemistry of seeds in relation to germination. New York: Springer Verlag. 1, 306–307.
|
| ○ |
Bligh EG. Dyer WJ. 1959. A rapid method of total lipid extraction and purification. Can J Biochem. Physiol. 37, 911–917. http://dx.doi.org/10.1139/o59-099.
|
| ○ |
Chavan UD, Mckenzie DB, Shahidi F. 2001. Protein classification of beach pea (Lathyrus maritimus L.). Food Chem. 75, 145–153. http://dx.doi.org/10.1016/S0308-8146(01)00122-4.
|
| ○ |
Chen Z, Ilarslan H, Palmer RG, Shoemaker RC.1998. Development of protein bodies and accumulation of carbohydrates in a soybean
(Leguminosae) shrivelled seed mutant. Am. J. Bot. 85, 492–499. http://dx.doi.org/10.2307/2446432.
|
| ○ |
Douce R. 1964. Identification et dosage de quelques glycérophosphosphatides dans des souches normales et tumorales de scosonères
cultivés in vitro. CR Acad. Sci. 259, 3066–3068.
|
| ○ |
Epaminondas PS, Araujo KLGV, Lima de Souza A, Silva MCD, Queiroz N, Souza AL, Soledade LEB, Santos IMG, Souza AG. 2011. Influence
of toasting on the nutritious and thermal properties of flaxseed. J. Therm. Anal. Calorim. 106, 551–555. DOI: 10.1007/s10973-011-1638-y.
|
| ○ |
Folch J, Lees M, Sloane Stanley GMA. 1957. Simple method for the isolation and purification of total lipids from animal tissues.
J. Biol. Chem. 226, 497–509.
|
| ○ |
Gutiérrez F. 1989. Determination of virgin olive oils stability: Comparization between activated oxygen (AOM) and Rancimat
Methods. Grasas Aceites. 40, 1–5.
|
| ○ |
Herchi W, Harrabi S, Sebei K, Rochut S, Boukhchina S, Pepe C, Kallel H. 2009. Phytosterols accumulation in the seeds of Linum usitatissimum L. Plant Physiol. Biochem. 47, 880–885. http://dx.doi.org/10.1016/j.plaphy.2009.07.001.
|
| ○ |
Herchi W, Sakouhi F, Arraez-Roman D, Segura-Carretero A, Boukhchina S, Kallel H, Fernández-Gutiérrez A. 2011. Changes in the
Content of Phenolic Compounds in Flaxseed Oil during Development. J. Am. Oil Chem. Soc. 88, 1135–1142. http://dx.doi.org/10.1007/s11746-010-1750-3.
|
| ○ |
Herchi W, Trabelsi H, Ben Salah H, Yuan Zhao Y, Boukhchina S, Kallel H, Curtis JM. 2012. Changes in the triacylglycerol content
of flaxseeds during development using liquid chromatography-atmospheric pressure photoionization-mass spectrometry (LC-APPI-MS).
Afr. J. Biotechnol. 11, 904–911.
|
| ○ |
Hosseinian FS, Muir AD, Westcott ND, Krol ES. 2006. Antioxidant capacity of flaxseed lignans in two model systems. J. Am. Oil Chem. Soc. 83, 835–840. http://dx.doi.org/10.1007/s11746-006-5034-x.
|
| ○ |
Hunt C, Burn P, Adamczuk ZC. 1987. Proximate composition and fat type of three popular take-away meals. Int. J. Food Sci. Technol. 22, 669–675. http://dx.doi.org/10.1111/j.1365-2621.1987.tb00535.x.
|
| ○ |
Kaur M, Singh N. 2007. Characterization of protein isolates from different Indian chickpea (Cicer arietinum L.) cultivars. Food Chem. 102, 366–374. http://dx.doi.org/10.1016/j.foodchem.2006.05.029.
|
| ○ |
Kohno A, Nanmori T. 1991. Changes in α-and β-amylase activities during germination of seeds of alfalfa. Plant Cell Physiol. 32, 459–466.
|
| ○ |
Lee YI, Yeung EC, Lee N, Chung MC. 2008. Embryology of Phalaenopsis amabilis var. Formosa: embryo development. Bot Stud. 49, 139–146.
|
| ○ |
Lei B, Li Chen. Oomah BD, Mazza G. 2003. Distribution of cadmium-binding components in flax (Linum usitatissimum L.) seed. J Agric Food Chem. 51, 814–821. http://dx.doi.org/10.1021/jf0209084.
|
| ○ |
Mangold HK. 1964. Thin layer chromatography of lipids. J. Am. Oil Chem. Soc. 47, 762–773. http://dx.doi.org/10.1007/BF02676266.
|
| ○ |
Miquel M, Browse J. 1997. Lipid biosynthesis in developing seeds, in: J. Kigel, G. Galili (Eds.), Seed Development and Germination.
Dekker, USA, 169–193.
|
| ○ |
Monma M, Sugimoto T, Monma M, Kawanura Y, Saio K. 1991. Starch breakdown in developing soybean seeds. Agr. Biol. Chem. 55, 67–71. http://dx.doi.org/10.1271/bbb1961.55.67.
|
| ○ |
Mueller K, Eisner P, Yoshie-Stark Y, Nakada R, Kirchhoff E. 2010. Functional properties and chemical composition of fractionated
brown and yellow linseed meal (Linum usitatissimum). J. Food Eng. 98, 453–460. http://dx.doi.org/10.1016/j.jfoodeng.2010.01.028.
|
| ○ |
Murtaza G, Asghar R. 2012. α-amylase activities during seed development and germination in pea (pisum sativum L) treated with
salicylic acid. Pak J. Bot. 44, 1823−1829.
|
| ○ |
Olsen OA. 2001. Endosperm development: cellularization and cell fate specification. Annu Rev Plant Physiol. Plant Mol. Biol. 52, 233–267. http://dx.doi.org/10.1146/annurev.arplant.52.1.233.
|
| ○ |
Oomah B. 2001. Flaxseed as a functional food source. J. Sci. Food Agr. 81, 889–894. http://dx.doi.org/10.1002/jsfa.898.
|
| ○ |
Osborne TB. 1924. The vegetable proteins. Longmans, Green and Co., London, 51–56. |
| ○ |
Pang PP, Pruitt RE, Meyerowitz EM. 1988. Molecular cloning, genomic organization, expression and evolution of 12S seed storage
protein genes of Arabidopsis thaliana. Plant Mol. Biol. 11, 805–820. http://dx.doi.org/10.1007/BF00019521.
|
| ○ |
Saldivar X, Wanga YJ, Chen P, Hou A. 2011. Changes in chemical composition during soybean seed development. Food Chem. 124, 1369–1375. http://dx.doi.org/10.1016/j.foodchem.2010.07.091.
|
| ○ |
Wanasundara PKJPD, Shahidi F, Brosnan ME. 1999. Changes in flax (Linum usitatissimum) seed nitrogenous compounds during germination. Food Chem. 65, 289–295. http://dx.doi.org/10.1016/S0308-8146(98)00176-9.
|