Vegetable oils rich in alpha linolenic acid allow a higher accretion of n-3 LCPUFA in the plasma, liver and adipose tissue
of the rat
R. Valenzuelaa,*,
C. Barreraa,
J.M. Ayalaa,
J. Sanhuezab and A. Valenzuelab,c
aNutrition and Dietetics School, Faculty of Medicine, University of Chile, Santiago, Chile
bLipid Center, Nutrition and Food Technology Institute, University of Chile, Santiago, Chile
cFaculty of Medicine, Universidad de Los Andes, Santiago, Chile
*Corresponding author: rvalenzuelab@med.uchile.cl
| |
SUMMARY
ALA is the precursor of EPA and DHA and its dietary availability is limited. Vegetable oils rich in ALA (48–64%) are alternatives
for increasing its consumption. The conversion of ALA into EPA and DHA and the ratio (EPA+DHA/ALA) was evaluated in different
tissues from male Wistar rats fed ALA –rich oils. Four groups (n=12/group) were fed for 21 days with oils from: a) corn (CO,
3% ALA); b) soybean (SO, 6% ALA); c) sacha inchi (SIO, 48% ALA) and; d) chia (ChO, 64% ALA). SO, SIO and ChO significantly
increased ALA levels (p<0.05) in the tissues. Only SIO and ChO increased tissue EPA and DHA while reducing n-6/n-3 ratio (p<0.05).
SIO and ChO are suggested as good sources of ALA to increase tissue EPA and DHA.
|
| |
RESUMEN
Aceites vegetales ricos en ácido alfa linolénico permiten un mayor almacenamiento de AGPICL n-3 en el plasma, hígado y tejido
adiposo de la rata. ALA es precursor de EPA y DHA y sus fuentes dietarias son limitadas. Aceites ricos en ALA (48–64%) son una alternativa para
incrementar su consumo. En este trabajo se evaluó la conversión de ALA a EPA y DHA, y la relación (EPA+DHA/ALA) en tejidos
de ratas macho Wistar alimentadas con aceites con alto contenido en ALA. Cuatro grupos (n=12/grupo) recibieron durante 21
días aceite de: a) maíz (CO, 3% ALA); b) soja (SO, 6% ALA); c) sacha inchi (SIO, 48% ALA) y; d) chía (ChO, 64% ALA). SO, SIO
y ChO incrementaron ALA (p<0,05) en los tejidos. Solo SIO y ChO incrementaron el EPA y DHA, disminuyendo la relación n-6/n-3
(p<0,05). Se propone SIO y ChO como fuentes de ALA para incrementar EPA y DHA en los tejidos.
|
1. INTRODUCTIONTOP
Polyunsaturated fatty acids (PUFA), are very important for humans especially during pregnancy, breastfeeding and early life
(Burlingame et al., 2009). Linoleic (C18:2 n-6, LA) and alpha linolenic (C18:3 n-3, ALA) fatty acids are essentials to humans and other species which
do not have the enzymes to synthesize these fatty acids so that both fatty acids must be supplied from the diet. However,
humans can elongate and de-saturate both fatty acids synthesizing long chain polyunsaturated fatty acids (LCPUFA) of C20 and
C22, which have important and essential functions in the body (Holman and Johnson, 1982). The most important LCPUFA obtained from ALA are eicosapentaenoic acid (C20:5 n-3, EPA) and docosahexaenoic acid (C22:6
n-3, DHA). Different reports have established the cardioprotective effects of EPA and DHA when provided from fish, fish oil,
or other dietary supplements (De Caterina, 2011). The importance of DHA in the brain and visual development has also been demonstrated (Valenzuela et al., 2006) and the neuroprotective role of this fatty acid during aging and the development of neurodegenerative diseases (Valenzuela et al., 2012a). Arachidonic acid (C20:4 n-6, ARA), a LCPUFA derived from LA also has a significant function in developing nervous tissue,
especially in the brain, immune system, and vascular endothelial homeostasis (Hoffman et al., 2009). Dietary recommendations establish the importance of an adequate intake of n-3 and n-6 fatty acids (Simopoulos, 2008). However, the technological development experienced during the twentieth century has modified food production and consumption
around the world, but especially in western countries (Hunter, 1989), where the food sources of n-3 PUFA (ALA) and n-3 LCPUFA (EPA and DHA) are very limited, with abundant sources of LA (the
majority of consumed oils are good sources of LA). On the contrary, few sources of ALA are massively available for consumption,
with the exception of soybean (6% ALA) and canola oils (10% ALA). The availability of EPA and DHA is even more restrictive
due to a low consumption of fish in western countries (Simopoulos, 2008; Mozaffarian and Wu, 2011). Fatty fish, such as tuna, mackerel, salmon, sardine and anchovy, are the best dietary sources of EPA and DHA (Mozaffarian
and Wu, 2011). This situation has produced changes in the consumption of essential fatty acids with modifications in n-6/n-3 PUFA ratios,
which are, at present, among the most significant nutritional changes in the western diet, leading to a dietary imbalance
in the n-6/n-3 LCPUFA ratio which ranges from 15 to 20: 1 while 5:1 is the recommended ratio (Simopoulos, 1999). n-6/n-3 LCPUFA imbalance represents a significant change when compared with the historical relationship of n-6/n-3 LCPUFA
consumed by humans for thousands of years (van Vliet and Katan, 1990). A direct metabolic effect of this nutritional situation is the increase in the n-6/n-3 PUFA ratio of membrane phospholipids
with a predominant formation of ARA derivatives which have pro-inflammatory and coagulant activity, and increase the prevalence
of inflammatory illness and cardiovascular and cerebrovascular mortality (Simopoulos, 2009).
Recent industrialization and commercial availability in Latin America of ancestral oils, such as sacha inchi and chia oil,
which have high a content of ALA, open the possibility of providing the population with abundant and inexpensive sources of
n-3 PUFA. Sacha inchi oil (42 to 48% ALA) is obtained from the fruit Plukenetia volubilis, known as Inca Peanut (native from Peru) (Maurer et al., 2012). Chia oil (60 to 65% ALA) is obtained from the seed Salvia hispanica or chia seed (native from Mexico and Guatemala) (Espada et al., 2007). These oils could be considered new and innovative food sources of ALA, which may improve the drastic imbalance in the n-6/n-3
LCPUFA ratio of the western population (Simopoulos, 1999; Simopoulos, 2008). However, it remains to be demonstrated that the ingestion of greater amounts of ALA, i.e. provided by sacha inchi or chia
oil, is reflected in the effective tissue accretion of n-3 LCPUFAs EPA and DHA. The objective of this study was the evaluation
of the modification in the levels of n-3 LCPUFAs EPA and DHA in the plasma, hepatic and adipose tissue and to establish the
product (EPA+DHA)/precursor (ALA) ratio in Wistar rats after feeding with oils rich in ALA (sacha inchi and chia oil).
2. MATERIALS AND METHODSTOP
2.1. Animals and DietsTOP
Male Wistar rats (21 day-old) were obtained from the Bioterium of the Nutrition Department of the Faculty of Medicine, University
of Chile. Animals were randomly assigned to one of four groups with free access to the different experimental diets (n=12
animals/experimental group). Each group was fed with an isocaloric diet, with a macronutrient distribution: 20% protein, 10%
fat and 70% carbohydrates, supplemented with micronutrients according to the nutritional requirements of Wistar rats. The
total fat in each group was exclusively provided by a vegetable oil according to the following description: corn oil (CO,
3% ALA); soybean oil (SO, 6% ALA); sacha inchi oil (SIO, 48% ALA); chia oil (ChO, 64% ALA). Dietary composition was previously
published (González-Mañán et al., 2012). The fatty acid composition of each diet is shown in Table 1. The dietary intervention was applied for 21 days, with the animals having free access to food and water. At the end of the
experimental period, the animals were made to fast overnight and at 8:00 AM anaesthetized by an intraperitoneal injection
(1mL·kg−1, a mixture of 25 mg·mL−1 zolazepam chlorhydrate and 25 mg·mL−1 tiletamine chlorhydrate, Zoletil 50, Virbac S A, Carros, France). Blood samples were obtained by cardiac puncture and plasma
and erythrocytes were separated by centrifugation of whole blood at 1500 g for 5 min. Liver and adipose tissue (visceral fat)
were extracted from each rat, placed immediately into chilled sample vials and frozen at −80 °C for further fatty acid analysis.
All procedures were performed according to the institutional guidelines for research with animals established by the Bioethics
Committee of the Faculty of Medicine, University of Chile (Protocol number CBA# 0654 FMUCH).
Table 1. Fatty acid composition of each diet: corn oil (CO), soybean oil (SO), sacha inchi oil (SIO) and chia oil (ChO). Values show the mean of five analyses and are expressed as g FAME per 100 g of diet
| Fat content |
CO |
SO |
SIO |
ChO |
| SFA |
1.5 |
1.4 |
0.6 |
0.9 |
| MUFA |
2.7 |
2.5 |
1.0 |
0.6 |
| Oleic acid |
2.3 |
2.3 |
0.8 |
0.5 |
| PUFA |
6.2 |
6.0 |
8.5 |
8.5 |
| Total n-6 PUFA |
5.8 |
5.3 |
3.5 |
2.1 |
| Linoleic acid |
5.7 |
5.1 |
3.6 |
2.0 |
| Total n-3 PUFA |
0.4 |
0.7 |
4.9 |
6.4 |
| Alpha linolenic acid |
0.3 |
0.6 |
4.8 |
6.3 |
| EPA |
n/d |
n/d |
n/d |
n/d |
| DHA |
n/d |
n/d |
n/d |
n/d |
| n6/n-3 PUFA ratio |
14.5 |
0.0 |
0.7 |
0.3 |
2.2. Tissue lipid extraction and separationTOP
Quantitative extraction of total lipids from plasma, hepatic and adipose tissue was carried out according to Bligh and Dyer
(Bligh and Dyer, 1959) in the presence of BHT (butylated hydroxytoluene) as antioxidant. Plasma and tissue samples were suspended in ice-cold chloroform/methanol
(2:1 v/v) containing 0.01% BHT and magnesium chloride (0.5 N) and homogenized in an Ultraturrax homogenizer (Janke & Kunkel,
Stufen, Germany). The organic phase containing total lipids was separated for further analysis.
2.3. Preparation of fatty acid methyl ester (FAME)TOP
FAME from plasma, hepatic and adipose tissue total lipids were prepared with methanolic boron trifluoride (12% methanolic
solution) according to Morrison and Smith (Morrison and Smith, 1964). FAME samples were cooled and extracted with 0.5 mL of hexane.
2.4. FAME gas-liquid chromatographyTOP
FAME were separated and quantified by gas-liquid chromatography using Hewlett-Packard equipment (model 7890A, CA, USA) equipped
with a capillary column (Agilent HP-88, 100 m×0.250 mm; I.D. 0.25 µm) and a flame ionization detector (FID). The injector
temperature was set at 250 °C and the FID temperature at 300 °C. The oven temperature at injection was initially set at 140
°C and was programmed to increase to 220 °C at a rate of 5 °C·min−1. Hydrogen was used as carrier gas. FAME identification and quantification was achieved using a commercial lipid standard
(Nu-Chek Prep Inc. MN, USA.) and C23:0 as internal standard (Nu-Chek Prep Inc. MN, USA.) using the Hewlett-Packard Chemstation
Data System.
2.5. Statistical analysisTOP
Statistical analysis was performed with the GraphPad Prism 5.1 software (GraphPad Prism Software, Inc. San Diego, USA). The
values shown represent the mean±SEM for the number of separate experiments indicated. The evaluation of normality data distribution
was performed using the Shapiro Wilk test. Assessment of the statistical significance of differences between mean values was
performed by one-way ANOVA and the Newman-Keuls test. A p<0.05 was considered significant.
3. RESULTSTOP
3.1. Weight increase and food intakeTOP
No significant differences, either in the initial or in the final weight or dietary intake of the animals from each group
during the 21 days of intervention was observed (not shown). Also, no significant differences in liver weight or in subcutaneous
adipose tissue aspect were observed. No mortality was produced during the experimental period.
3.2. Plasma fatty acid compositionTOP
The composition of the most relevant fatty acids of total plasma lipids are shown in Table 2. It can be observed that total saturated fatty acids (SFA) and total monounsaturated fatty acids (MUFA) were not modified
by the oils. Total PUFA and total LCPUFA were increased only in ChO when compared to CO. Total n-6 LCPUFA were significantly
increased in CO, compared to SO, SIO and ChO, with this group showing a drastic reduction in this value compared to the other
groups. Total n-3 LCPUFA were significantly higher in SO, SIO and ChO when compared to CO. However, the value for ChO was
significantly higher than SO and SIO. When individual n-6 and n-3 fatty acids were compared, significant differences were
observed in all groups. LA was significantly higher in CO and SO compared to SIO and ChO. No differences were observed when
CO and SO, and SIO and ChO were compared, respectively. ALA was significantly higher in SIO and ChO when compared to the other
groups. However, the ALA for ChO showed the highest value among the experimental groups. AA showed the highest value in CO
compared to SO, SIO and ChO. In contrast, ChO showed the lowest value for AA. EPA was increased in SO, SIO and ChO, when compared
to CO. However, ChO showed a remarkable increment for EPA with respect to the other groups. DHA increased in SO, SIO and ChO
when compared to CO. However, SIO and ChO showed the same level of DHA, which is different from the behavior observed for
EPA for the same experimental groups. The highest n-6/n-3 ratio was obtained for CO, and in contrast, the lowest ratio was
obtained for ChO.
Table 2. Most relevant fatty acids obtained from plasma samples of the different experimental groups
| Fatty acid |
Groups |
| CO (a) |
SO (b) |
SIO (c) |
ChO (d) |
| Total SFA |
55.6±5.1 |
52.1±4.7 |
50.4±3.7 |
47.8±5.2 |
| Total MUFA |
16.9±2.4 |
16.5±2.5 |
15.2±1.8 |
14.4±1.8 |
| Total PUFA |
27.5±3.6d |
31.4±4.3 |
34.4±2.8 |
37.8±4.8a |
| Total LCPUFA |
7.84±0.9d |
7.11±0.8 |
11.1±1.4 |
11.6±1.5a |
| Total n-6 LCPUFA |
7.31±0.8b,c,d |
3.42±0.5a,d |
4.00±0.6a,d |
1.50±0.08a,b,c |
| Total n-3 LCPUFA |
0.30±0.04b,c,d |
3.71±0.6a,c,d |
7.10±1.2a,b,d |
10.1±1.1a,b,c |
| 18:2, n-6 (LA) |
20.4±3.2c,d |
19.2±2.6c,d |
6.83±0.4a,b |
3.61±0.7a,b |
| 18:3, n-3 (ALA) |
0.18±0.02b,c,d |
5.31±0.7a,c,d |
16.8±2.6a,b,d |
22.2±3.4a,b,c |
| 20:4, n-6 (AA) |
7.12±1.9b,c,d |
2.90±0.4a,d |
3.70±0.3a,d |
1.10±0.2a,b,c |
| 20:5, n-3 (EPA) |
0.16±0.02b,c,d |
2.62±0.3a,c,d |
4.20±0.8a,b,d |
6.12±1.2a,b,c |
| 22:6, n-3 (DHA) |
0.13±0.03a,c,d |
0.83±0.05a,c,d |
2.21±0.2a,b |
2.71±0.6a,b |
| n-6/ n-LCPUFA3 ratio |
24.3±1.4b,c,d |
0.91±0.04a,c,d |
0.60±0.03a,b,d |
0.20±0.02a,b,c |
| Values are expressed as g fatty acid per 100 g FAME and represent the mean±SEM for n=12 rats/experimental group. Values sharing
the same letter in each row are not statistically different (p<0.05). Saturated fatty acids (SFA) correspond to 14:0, 16:0
and 18:0. Monounsaturated fatty acids (MUFA) correspond to 14:1, n-7, 16:1, n-7 and 18:1, n-9. Polyunsaturated fatty acids
(PUFA) correspond to 18:2, n-6, 18:3, n-3, 20:4, n-6, 20:5, n-3, 22:5, n-3, and 22:6, n-3; n-6 Long chain polyunsaturated
fatty acids (LCPUFA) are 20:4, n-6; n-3 LCPUFA are 20:5, n-3, 22:5, n-3, and 22:6, n-3; n-6/n-3 ratio: 20:4, n-6/ (20:5, n-3+22:5,
n-3+22:6, n-3).
|
3.3. Liver fatty acid compositionTOP
The composition of the most relevant fatty acids of total liver lipids is shown in Table 3. It can be observed that total SFA and total PUFA were not modified when the different experimental groups were compared.
Total MUFA were significantly increased and total LCPUFA were significantly reduced in SO as compared to ChO. Although total
PUFA was not modified, significant differences were observed when fatty acids were individually compared. LA showed the highest
value in CO and the lowest value in ChO. In contrast, the values for ALA were highest in ChO and very low in CO, the other
oils showed intermediate values. AA increases with the amount of LA provided by the diets, having a high value in CO and the
lowest value in ChO. EPA and DHA showed the same behavior as the one observed in plasma, with the lowest values in CO and
the highest values in ChO. Again, no differences were observed for DHA when SIO and ChO were compared. The n-6/n-3 LCPUFA
ratio was drastically modified in SO, SIO and ChO as compared to CO. The highest n-6/n-3 ratio for LCPUFA was obtained for
CO, in contrast, ChO showed the smallest ratio, with SO and SIO having intermediate values for this ratio.
Table 3. Most relevant fatty acids obtained from liver samples of the different experimental groups
| Fatty acid |
Groups |
| CO (a) |
SO (b) |
SIO (c) |
ChO (d) |
| Total SFA |
33.1±2.2 |
33.6±2.1 |
34.2±3.8 |
34.4±2.5 |
| Total MUFA |
18.4±1.8 |
19.6±1.4d |
17.7±2.5 |
15.8±1.2b |
| Total PUFA |
48.5±4.2 |
46.8±3.5 |
48.1±4.3 |
49.1±3.4 |
| Total LCPUFA |
21.4±2.2 |
17.1±2.4d |
21.8±3.2 |
22.4±2.1b |
| Total n-6 LCPUFA |
19.6±1.6b,c,d |
9.65±1.1a,d |
6.70±1.4a,b |
2.41±0.4a,b,c |
| Total n-3 LCPUFA |
1.80±0.2b,c,d |
7.45±0.5a,c,d |
15.0±1.6a,b,d |
20.0±1.4a,b,c |
| 18:2, n-6 (LA) |
24.2±4.2c,d |
20.6±2.5c,d |
12.36±1.3a,b,d |
5.04±0.3a,b,c |
| 18:3, n-3 (ALA) |
0.31±0.05b,c,d |
5.10±0.6a,c,d |
12.4±1.3a,b,d |
17.6±1.6a,b,c |
| 20:4, n-6 (AA) |
15.8±1.7b,c,d |
7.11±0.4a,c,d |
5.50±2.6a,d |
1.81±0.3a,b,c |
| 20:5, n-3 (EPA) |
0.26±0.1b,c,d |
3.22±0.5a,c,d |
5.62±0.7a,b,d |
9.02±0.5a,b,c |
| 22:6, n-3 (DHA) |
1.15±0.2b,c,d |
3.15±0.3a,c,d |
5.91±0.6a,b |
6.22±0.8a,b |
| n-6/n-3 LCPUFA ratio |
10.9±1.1b,c,d |
1.30±0.2a,c,d |
0.45±0.1a,b,d |
0.12±0.02a,b,c |
| Values are expressed as g fatty acid per 100 g FAME and represent the mean±SEM for n=12 rats/experimental group. Values sharing
the same letter in each row are not statistically different (p<0.05). Saturated fatty acids (SFA) correspond to 14:0, 16:0
and 18:0. Monounsaturated fatty acids (MUFA) correspond to 14:1, n-7, 16:1, n-7 and 18:1, n-9. Polyunsaturated fatty acids
(PUFA) correspond to 18:2, n-6, 18:3, n-3, 20:4, n-6, 20:5, n-3, 22:5, n-3, and 22:6, n-3; n-6 Long chain polyunsaturated
fatty acids (LCPUFA) are 20:4, n-6; n-3 LCPUFA are 20:5, n-3, 22:5, n-3, and 22:6, n-3; n-6/n-3 ratio: 20:4, n-6/ (20:5, n-3+22:5,
n-3+22:6, n-3).
|
3.4. Adipose tissue fatty acid compositionTOP
The composition of the most relevant fatty acids of total lipids extracted from adipose tissue is shown in Table 4. Although the absolute values for total SFA, MUFA, PUFA and LCPUFA were different from those observed in the liver, all these
parameters showed the same tendency in each group as was observed for both adipose tissue and liver. The same observation
is valid for the individual fatty acids of major relevance. Again, no significant differences were observed for DHA in SIO
or ChO, whereas the values for EPA in ChO were notably different, such as was observed in the liver. The ratio n-6/n-3 LCPUFA
also showed the same behavior as in the liver, but values were not extremely different as was observed for this last tissue.
Table 4. Most relevant fatty acids obtained from adipose tissue samples of the different experimental groups
| Fatty acid |
Groups |
| CO (a) |
SO (b) |
SIO (c) |
ChO (d) |
| Total SFA |
58.1±4.1 |
60.1±3.8 |
57.8±3.4 |
57.1±4.2 |
| Total MUFA |
21.3±3.6 |
20.0±2.1 |
19.9±1.8 |
20.0±3.6 |
| Total PUFA |
20.6±3.4 |
19.9±1.8 |
22.3±2.4 |
22.9±2.8 |
| Total LCPUFA |
6.60±1.4 |
5.80±1.1d |
7.68±1.8 |
9.80±1.5b |
| Total n-6 LCPUFA |
5.93±1.1c,d |
4.41±0.5c,d |
2.47±0.3a,b |
1.87±0.5a,b, |
| Total n-3 LCPUFA |
0.67±0.02b,c,d |
1.39±0.05a,c,d |
5.21±0.6a,b,d |
7.93±1.1a,b,c |
| 18:2, n-6 (LA) |
13.6±2.4c,d |
11.4±2.6c,d |
4.71±0.5a,b,d |
1.84±0.4a,b,c |
| 18:3, n-3 (ALA) |
0.24±0.03b,c,d |
2.73±0.5a,c,d |
8.61±1.1a,b |
10.6±1.6a,b |
| 20:4, n-6 (AA) |
5.91±1.3 |
4.32±0.7 |
2.46±0.3a,b |
1.81±0.5a,b |
| 20:5, n-3 (EPA) |
0.01±0.001b,c,d |
0.46±0.1a,c,d |
0.92±0.2a,b,d |
2.88±0.3a,b,c |
| 22:6, n-3 (DHA) |
0.41±0.03b,c,d |
0.94±0.1a,c,d |
4.22±0.5a,b |
4.74±0.4a,b |
| n-6/n-3 LCPUFA ratio |
8.85±1.6b,c,d |
3.17±0.4a,c,d |
0.47±0.1a,b,d |
0.24±0.05a,b,c |
| Values are expressed as g fatty acid per 100 g FAME and represent the mean±SEM for n=12 rats/experimental group. Values sharing
the same letter in each row are not statistically different (p<0.05). Saturated fatty acids (SFA) correspond to 14:0, 16:0
and 18:0. Monounsaturated fatty acids (MUFA) correspond to 14:1, n-7, 16:1, n-7 and 18:1, n-9. Polyunsaturated fatty acids
(PUFA) correspond to 18:2, n-6, 18:3, n-3, 20:4, n-6, 20:5, n-3, 22:5, n-3, and 22:6, n-3; n-6 Long chain polyunsaturated
fatty acids (LCPUFA) are 20:4, n-6; n-3 LCPUFA are 20:5, n-3, 22:5, n-3, and 22:6, n-3; n-6/n-3 ratio: 20:4, n-6/ (20:5, n-3+22:5,
n-3+22:6, n-3).
|
3.5. Product/precursor ratio (n-3 LCPUFA/n-3 PUFA) in plasma, liver and adipose tissueTOP
The plasma, liver and adipose n-3 LCPUFA (EPA+DHA)/n-3 PUFA (ALA) ratio is shown in Figure 1. It can be observed that for all tissues (A: plasma; B: liver; C: adipose tissue) the lowest ALA supply (CO) results in the
highest (EPA+DHA/ALA) ratio. On the contrary, the highest supply of ALA results in the lowest (EPA+DHA/ALA) ratios, as is
observed for SO, SIO and ChO.
|
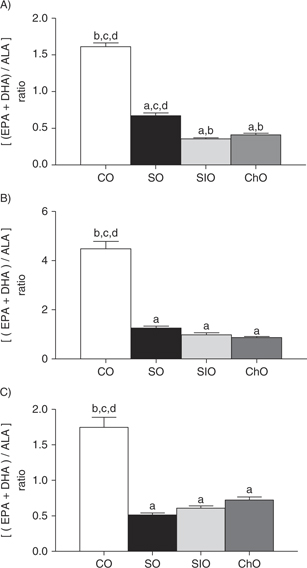 Figure 1. Product/precursor ratio [(EPA+DHA)/ALA] for plasma (A), liver (B) and adipose tissue (C) obtained after CO, SO, SIO and ChO
supplementation. Figure 1. Product/precursor ratio [(EPA+DHA)/ALA] for plasma (A), liver (B) and adipose tissue (C) obtained after CO, SO, SIO and ChO
supplementation.
Values sharing the same letter in each row are not statistically different (p<0.05).
|
|
4. DISCUSSIONTOP
The data presented show that the intake of ALA, when provided in higher amounts by the different vegetable oils, may increase
ALA content and n-3 LCPUFA (EPA + DHA) content in the plasma, liver and adipose tissue of animals fed SO, SIO and ChO. The
tissue levels of each of the n-3 LCPUFA studied increased with the amount of ALA provided by each of the dietary oils, with
sacha inchi oil and chia oil showing higher ALA, EPA and DHA tissue contents when compared to corn oil and soybean oil (Tables 2, 3, 4). As the dietary oils do not contain EPA or DHA, the increase in these fatty acids in the tissues must result from
the animals’ capacity to transform ALA into its metabolic derivatives. Desaturation and elongation of ALA occurs mainly in
the liver, therefore this fatty acid, once absorbed, must be transported to the liver to be elongated and desaturated, first
to EPA and after to DHA (Wang et al., 2005). Although these fatty acids accumulate in the liver, they are also transported to other tissues, such as blood (erythrocytes
and white cells) and adipose tissue. EPA normally competes with ARA to be incorporated into membrane phospholipids (Sun et al., 2008), an effect that is notorious when higher amounts of ALA are provided, such as in the case of ChO. Less competence is observed
for SO and SIO, but irrelevant for CO. DHA is almost exclusively accumulated in the brain, retina and gonads (Innis and Dyer,
2002; Barceló-Coblijn et al., 2005). The presence of this n-3 LCPUFA in the liver reflects the active conversion of ALA into DHA, and its presence in plasma
shows its active transport to the target tissues. Normally, adipose tissues do not show relevant amounts of n-3 LCPUFA when
dietary ALA is provided in low amounts (Barceló-Coblijn and Murphy, 2009), as was observed for CO in our protocols. However, as the amount of dietary ALA is increased, adipose tissue responds by
increasing its content of ALA and also its content of EPA and DHA, probably acting as a metabolic reservoir for these fatty
acids. Although we have not evaluated the activity of hepatic elongase and desaturase enzymes, we suggest that the presence
of higher amounts of ALA stimulates its conversion to EPA and DHA, at the same time that it competes for tissue deposition
of AL and its transformation into ARA by the same enzymes (Wang et al., 2006). However, when comparing the product/precursor ratio (EPA+DHA/ALA) (Figure 1) it is observed that the supply of the precursor (ALA) was lower, and the ratio with the product was greater (EPA+DHA). It
is interesting that SO, which provided a low amount of ALA (0.6g ALA·100g−1 diet), shows an (EPA+DHA/ALA) ratio similar to the ratio obtained for the diets which provided high amounts of ALA (SIO 4.8g
ALA·100g−1 diet; ChO 6.3g ALA·100g−1 diet). This situation may indicate that the enzymes involved in this transformation (hepatic elongases and desaturases) may
be saturated even at low ALA concentrations, an effect that has been previously described for these enzymes (Nakamura and Nara, 2004). Therefore, further studies are needed to evaluate the possible modification in both the expression and the activity of
the enzymes involved in the metabolic transformation of ALA to n-3 LCPUFA, such as Δ-5 and Δ-6 desaturase enzymes, when the
fatty acid is provided in high amounts, as occurs with SIO and ChO in our experimental protocols. Therefore, our results may
suggest that the metabolic route for the conversion of ALA to n-3 LCPUFA is saturated when ALA is provided in relatively higher
amounts.
The reduction in the n-6 (AA)/n-3 LCPUFA (EPA+DHA) ratio observed for SIO and ChO (Tables 2, 3, 4) may have health benefits, particularly in the western diet because a higher n-6/n-3 ratio is associated with pro-inflammatory
status (Simopoulos, 2009) and major incidence of chronic diseases, such as cardiovascular diseases (Simopoulos, 2009; De Caterina, 2011) and non-alcoholic fatty liver disease (Valenzuela and Videla, 2011).
The product/precursor ratio shown in Figure 1 demonstrates that although a higher supply of ALA results in a greater accretion of EPA and DHA in the tissues studied, only
a limited amount of ALA is transformed to n-3 LCPUFA, as may be concluded from the product/precursor ratios obtained for SO,
SiO and ChO. This effect may reflect a regulatory mechanism that operates in this conversion, mainly in the control of the
activity of Δ-5 and Δ-6 desaturase enzymes, the main limiting pathway of this metabolic route. It has being proposed that
less than 5% of ALA is transformed to DHA (Swanson et al., 2012), and that EPA, which is an intermediary into the transformation of ALA to DHA, is tissue-accumulated only when the fatty
acid is supplied as such (i.e from marine organisms) (Arterburn et al., 2006).
Sacha inchi and chia oils have been demonstrated to be very good sources of ALA to be further transformed into EPA and DHA
by the liver, transported through the plasma and accumulated in the adipose tissue. Although this accumulative effect remains
to be demonstrated in humans, it is interesting to speculate that these vegetable oils, which are now industrially produced
in many Latin American countries, should be a good and inexpensive way to supply the population with ALA to be transformed
into EPA and DHA. Consumption of sacha inchi and/or chia oils may compensate the very low ingestion of ALA, and also the low
ingestion of n-3 LCPUFA (EPA+DHA) from marine origin, as occurs in some countries such as Chile, Colombia, Argentine, the
highlands of Peru, the rain forest of Brazil and other regions of South America (Valenzuela et al., 2012b). We are currently studying the effect of chia oil supplementation in the milk content of DHA in nursing women.
5. CONCLUSIONSTOP
Feeding rats with diets containing higher amounts of ALA, allows for its accretion into different tissues and its conversion
to n-3 LCPUFA (EPA and DHA), which are also accreted in the plasma, liver and adipose tissue of the animals. Oils with a high
content of ALA, such as sacha inchi and chia oils may be a good alternative for providing n-3 PUFA to be metabolically transformed
into n-3 LCPUFA, an efficient and inexpensive way to nutritionally obtain these essential and low available fatty acids.
ACKNOWLEDGMENTSTOP
The authors are grateful to FONDECYT and INNOVA-CORFO for the support of this research. We are also grateful to the Nutrition
and Dietetics School, and the Nutrition Department, Faculty of Medicine, University of Chile, to Benexia S.A. which provided
chia oil and to Amazonicas Agro-Industry S. A. which provided sacha inchi oil.
REFERENCESTOP
| ○ |
Arterburn LM, Hall EB, Oken H. 2006. Distribution, interconversion, and dose response of n-3 fatty acids in humans. Am. J. Clin. Nutr. 83, 1467S−1476S.
|
| ○ |
Barceló-Coblijn G, Collison LW, Jolly CA, Murphy EJ. 2005. Dietary alpha-linolenic acid increases brain but not heart and
liver docosahexaenoic acid levels. Lipids. 40, 787–98. http://dx.doi.org/10.1007/s11745-005-1440-y.
|
| ○ |
Barceló-Coblijn G and Murphy EJ. 2009. Alpha-linolenic acid and its conversion to longer chain n-3 fatty acids: benefits for
human health and a role in maintaining tissue n-3 fatty acid levels. Prog. Lipid. Res. 48, 355–74. http://dx.doi.org/10.1016/j.plipres.2009.07.002.
|
| ○ |
Bligh EG and Dyer WJ. 1959. A rapid method of total lipid extraction and purification. Can. J. Biochem. Physiol. 37, 911–917. http://dx.doi.org/10.1139/o59-099.
|
| ○ |
Burlingame B, Nishida C, Uauy R, Weisell R. 2009. Fats and fatty acids in human nutrition: introduction. Ann. Nut. Met. 55, 5–7. http://dx.doi.org/10.1159/000228993.
|
| ○ |
Cortés E, Rizo-Baeza MM, Aguilar MJ, Gil V. 2013. High ratio of omega6/omega3 ratio children with neuropaties; cause or effects.
Nutr Hosp. 28, 1165–70.
|
| ○ |
De Caterina R. 2011. n-3 fatty acids in cardiovascular disease. N. Engl. J. Med. 364, 2439–50. http://dx.doi.org/10.1056/NEJMra1008153.
|
| ○ |
Espada CE, Berra MA, Martinez MJ, Eynard AR, Pasqualini ME. 2007. Effect of Chia oil (Salvia Hispanica) rich in omega-3 fatty
acids on the eicosanoid release, apoptosis and T-lymphocyte tumor infiltration in a murine mammary gland adenocarcinoma. Prostaglandins Leukotr. Ess. Fatty Acids. 77, 21–8 http://dx.doi.org/10.1016/j.plefa.2007.05.005.
|
| ○ |
González-Mañán D, Tapia G, Gormaz JG, D’Espessailles A, Espinosa A, Masson L, Varela P, Valenzuela A, Valenzuela R. 2012.
Bioconversion of α-linolenic acid to n-3 LCPUFA and expression of PPAR-alpha, acyl Coenzyme A oxidase 1 and carnitine acyl
transferase I are incremented after feeding rats with α-linolenic acid-rich oils. Food Funct. 3, 765–72. http://dx.doi.org/10.1039/c2fo30012e.
|
| ○ |
Holman R and Johnson S. 1982. A case of human linolenic acid deficiency involving neurological abnormalities. Am. J. Clin. Nutr. 35, 617–23.
|
| ○ |
Hoffman D, Boettcher J, Diersen-Schade D. 2009. Toward optimizing vision and cognition in term infants by dietary docosahexaenoic
and arachidonic acid supplementation: A review of randomized controlled trials. Prostaglandins Leukotr. Ess. Fatty Acids. 81, 151–58. http://dx.doi.org/10.1016/j.plefa.2009.05.003.
|
| ○ |
Hunter JE, in Biological effects and nutritional essentiality, ed. C. Galli and A. P. Simopoulos, Series A: Life Sciences,
Plenum Press: New York, 1989, vol. 171, pp. 43–55.
|
| ○ |
Innis SM and Dyer RA. 2002. Brain astrocyte synthesis of docosahexaenoic acid from n-3 fatty acids is limited at the elongation
of docosapentaenoic acid. J. Lipid. Res. 43, 1529–36. http://dx.doi.org/10.1194/jlr.M200120-JLR200.
|
| ○ |
Maurer NE, Hatta-Sakoda B, Pascual-Chagman G, Rodriguez-Saona LE. 2012. Characterization and authentication of a novel vegetable
source of omega-3 fatty acids, sacha inchi (Plukenetia volubilis L.) oil. Food Chem. 134, 1173–80.http://dx.doi.org/10.1016/j.foodchem.2012.02.143.
|
| ○ |
Morrison WR and Smith LM. 1964. Preparation of fatty acid methyl esters and dimethylacetals from lipids with boron fluoride-methanol.
J. Lipid. Res. 5, 600–8.
|
| ○ |
Mozaffarian D, Wu JH. 2011. Omega-3 fatty acids and cardiovascular disease: effects on risk factors, molecular pathways, and
clinical events. J. Am. Coll. Cardiol. 58, 2047–67. http://dx.doi.org/10.1016/j.jacc.2011.06.063.
|
| ○ |
Nakamura MT and Nara TY. 2004. Structure, function, and dietary regulation of delta6, delta5, and delta9 desaturases. Annu. Rev. Nutr. 24, 345–76. http://dx.doi.org/10.1146/annurev.nutr.24.121803.063211.
|
| ○ |
Simopoulos AP. 1999. New products from the agri-food industry: The return of n-3 fatty acids into the food supply. Lipids. 34, S297–S301. http://dx.doi.org/10.1007/BF02562324.
|
| ○ |
Simopoulos AP. 2008. The importance of the omega-6/omega-3 fatty acid ratio in cardiovascular disease and other chronic diseases.
Exp. Biol. Med. 233, 674–88. http://dx.doi.org/10.3181/0711-MR-311.
|
| ○ |
Simopoulos AP. 2009. Evolutionary aspects of the dietary omega-6: omega-3 fatty acid ratio: medical implications. World Rev. Nutr. Diet 100, 1–21. http://dx.doi.org/10.1159/000235706.
|
| ○ |
Sun Q, Ma J, Campos H, Rexrode KM, Albert CM, Mozaffarian D, Hu FB. 2008. Blood concentrations of individual long-chain n-3
fatty acids and risk of nonfatal myocardial infarction. Am. J. Clin. Nutr. 88, 216–23.
|
| ○ |
Swanson D, Block R, Mousa S. 2012. Omega-3 fatty acids EPA and DHA: Health benefits throughout life. Adv. Nutr. 3, 1–7. http://dx.doi.org/10.3945/an.111.000893.
|
| ○ |
Valenzuela R and Videla LA. 2011. The importance of the long-chain polyunsaturated fatty acid n-6/n-3 ratio in development
of non-alcoholic fatty liver associated with obesity. Food Funct. 2, 644–8. http://dx.doi.org/10.1039/c1fo10133a.
|
| ○ |
Valenzuela A, Sanhueza J, Nieto S. 2006. Docosahexaenoic acid (DHA), essentiality and requirements: why and how to provide
supplementation. Grasas Aceites 57, 229–37. http://dx.doi.org/10.3989/gya.2006.v57.i2.43.
|
| ○ |
Valenzuela R, Sanhueza, Valenzuela A. 2012a. Docosahexaenoic acid (DHA), an important fatty acid in aging and the protection
of neurodegenerative diseases. J. Nut. Ther. 1, 63–72.
|
| ○ |
Valenzuela A, Sanhueza J, de la Barra F. 2012b. Fish oil. Yesterday an industrial waste, actually a product of high nutritional
value. Rev. Chil. Nutr. 39, 201–209.
|
| ○ |
Van Vliet T and Katan MB. 1990. Lower ratio of n-3 to n-6 fatty acids in cultured than in wild fish. Am. J. Clin. Nutr. 51, 1–2.
|
| ○ |
Wang Y, Botolin D, Christian B, Busik J, Xu J, Jump DB. 2005. Tissue-specific, nutritional, and developmental regulation of
rat fatty acid elongases. J. Lipid Res. 46, 706−15. http://dx.doi.org/10.1194/jlr.M400335-JLR200.
|
| ○ |
Wang Y, Botolin D, Xu J, Christian B, Mitchell E, Jayaprakasam B, Nair MG, Peters JM, Busik JV, Olson LK, Jump DB. 2006. Regulation
of hepatic fatty acid elongase and desaturase expression in diabetes and obesity. J. Lipid Res. 47, 2028–41. http://dx.doi.org/10.1194/jlr.M600177-JLR200.
|