Use of polar and nonpolar fractions as additional information sources for studying thermoxidized virgin olive oils by FTIR
N. Tena, R. Aparicio-Ruiz and D.L. García-González*
Instituto de la Grasa (CSIC), Padre García Tejero 4, E-41012 Sevilla, Spain
*Corresponding author: dluisg@cica.es
| |
SUMMARY
Fourier transform infrared (FTIR) spectroscopy has been proposed to study the degradation of virgin olive oils (VOO) in samples
undergoing thermoxidation. The polar and nonpolar fractions of oxidized oils have been analyzed by FTIR to provide further
information on the minor spectral changes taking place during thermoxidation. This information assists in the interpretation
of the spectra of the samples. For this purpose polar and nonpolar fractions of 47 VOO samples thermoxidized (190 °C) in a
fryer were analyzed by FTIR. The time-course change of the band area assigned to single cis double bonds was explained by their correlation with the decrease in oleic acid (adjusted-R2=0.93). The bands assigned to the hydroxyl groups and the first overtone of ester groups was better studied in the spectra
collected for the polar and nonpolar fractions, respectively. The bands assigned to peroxide, epoxy, tertiary alcohols and
fatty acids were clearly observed in the spectra of the polar fraction while they are not noticeable in the spectra of the
oils.
|
| |
RESUMEN
Uso de las fracciones polares y no polares como fuente de información adicional al estudio de aceites de oliva vírgenes por
FTIR. La espectroscopía de infrarrojos por transformada de Fourier (FTIR) se ha propuesto para estudiar la degradación de los
aceites de oliva vírgenes (AOV) sujetas a termoxidación. Las fracciones polares y no polares de aceites oxidados se analizaron
mediante FTIR para obtener más información sobre los cambios espectrales menores que tienen lugar durante la termoxidación.
Esa información ayuda en la interpretación de los espectros de las muestras puras. Con este objetivo, fracciones polares y
no polares de 47 AOV termoxidados (190 °C) en una freidora se analizaron mediante FTIR. La banda asignada a dobles enlaces
cis se explica por su correlación con la disminución de ácido oleico (R2-ajustado=0,93). Las bandas asignadas a los grupos hidroxilos
y del primer sobretono de los grupos éster se estudió mejor en los espectros recogidos para la fracción polar y no polar,
respectivamente. Grupos asignados a peróxidos, epoxi, alcoholes terciarios y los ácidos grasos se observan claramente en los
espectros de la fracción polar.
|
1. INTRODUCTIONTOP
The consumption of frying products and fast food has dramatically increased over the last decades. The high concern for the
toxic hazard of fried products (Friedman and Levin, 2008; Billek, 2000) and the economical implications of the oil stability during frying (Piper, 2001) have led to a major focus on virgin olive oil (VOO) as a frying oil. In fact, deep- and pan-frying is the second most important
application of olive oil, which is a millenarian culinary practice of the Mediterranean countries (García-González et al., 2009). The high stability of olive oil is mainly due to its low content in polyunsaturated fatty acids and its high content in
antioxidants (e.g. phenols).
Although the official method of percentage of total polar compounds (TPC) is well correlated with the thermal degradation
of the oil and oxidized fatty acids formed at frying temperatures (Sanibal and Mancini-Filho, 2004), this methodology is lengthy, expensive and laborious. Some alternative methods (determination of free fatty acids, percentage
of polymers, peroxide value, Lovibond color, etc) have the general drawback of providing only partial information that is
not necessarily correlated to the quality and safety decay of the frying oil (Stier, 2001). For that reason, several rapid spectroscopic methods are being proposed because they provide information on the representative
markers of the chemical processes that occur during frying (hydrolysis and oxidation reactions). Fourier transform infrared
spectroscopy (FTIR) has already been proven to be an appropriate technique in the quantitative determination of some parameters
of edible oils during frying, such as free fatty acids (Li et al., 2008), quantification of trans fatty acids (van de Voort et al., 2008), peroxide values (Yu et al., 2007) and iodine value (Sedman et al., 1998; van de Voort et al., 2008a). In one of our publications (Tena et al., 2009) we described a method based on attenuated total reflectance (ATR)-FTIR to predict the deterioration degree of virgin olive
oil during frying. The optimum infrared region to predict the TPC of thermoxidized oil was assigned to trans isomers (978–960 cm−1) and it is highly correlated with the percentage of elaidic acid (trans isomer of oleic acid). This compound rises as the frying process progresses at the same pace as TPC and the FTIR band assigned
to single trans double bonds. However, during the thermoxidation process other kinds of degradation reactions occur, most of them being related
to hydrolysis, oxidation and other reactions favored by high temperatures. The compounds formed or degraded in these reactions
may not follow the same trend as TPC and trans double bonds, and consequently their control needs a further study beyond a simple correlation with single spectral regions.
The ability of FTIR to study chemical groups associated with these reactions also makes this technique optimal for studying
these chemical processes.
Although ATR-FTIR provides information about the entire medium IR spectral region with an easy and rapid output, this technique
has less sensitivity for small spectral changes. On the basis of Beer's law, this limitation means that the use of ATR for
sample handling may cause difficulties in tracking low concentrations of chemical species. Alternatively, the use of transmission
cells permits studying bands of low intensity that require higher path lengths (~100 μm vs. few μm for ATR). A higher path
length allows for maximizing the signal intensity of bands, hence they are recorded at a higher signal-to-noise ratio compared
to the spectra collected with ATR. Thus, using transmission cells for sample handling in FTIR analysis provides better results
(higher sensitivity and precision) for low intensity bands, although it has the problem of saturation of the detector signal
for the most intense bands. Thus, transmission cells of several path lengths (100–350 μm) and window materials (KBr, CaF2, etc.) have been used to study hydroperoxides, the unsaturation degree and fatty acids, among other chemical species, in
oxidized edible oils (van de Voort et al., 2008; Moya Moreno et al., 1999).
An approach to increasing the intensity of certain spectral bands is to extract the polar and nonpolar fractions of the oil.
Separating the oil into two fractions additionally entails simplifying the spectra, avoiding, to some extent, the overlapping
bands. Thus, the individual study of fractions obtained from complex matrices with solvents or solid-extraction cartridges
has been addressed for a further interpretation of spectroscopic properties (Christophoridou and Dais, 2009; Scano et al., 2008). Most of the fractionation methods are based on polarity or solubility, and extraction of the unsaponifiable matter. Thus,
the examination of unsaponifiable matter of olive oil with FTIR and Raman spectroscopies allowed for the development of authentication
methods with a better performance compared to the same methods applied to the oils (Baeten et al., 2005).
To our knowledge fractionation into polar and nonpolar fractions has not yet been employed in the FTIR studies of edible oils,
although it has been successfully applied to other kinds of spectroscopies. Thus, Valavanidis et al., (2004) studied the antioxidant activity of methanol soluble and non soluble phases by ultraviolet-visible (UV-Vis) and by electron
paramagnetic resonance (EPR) spectroscopies. Zamora et al., (2002a, 2002b) also studied the polar fractions of several edible oils with 13C-NMR spectroscopy to characterize the oxidative and hydrolytic states of the samples, as well as to assure their genuineness
with an improved degree of certainty.
The selective removal of the triacylglycerol base of thermoxidized oils by chromatography leads to the separation of polar
and nonpolar fractions. The individual study of these fractions permits a better characterization of the chemical changes
catalyzed by high temperatures. The nonpolar fraction contains the unaltered triacylglycerols and consequently it has a composition
similar to the original unaltered oils. Most of the newly formed compounds during thermoxidation are expected to be included
in the polar fraction so the study of this fraction reveals the most relevant chemical changes taking place. Further chromatographic
analysis of the polar fraction has classified the polar compounds into 4 major groups: polymerized triacylglycerols, oxidized
triacylglycerols, diacylglycerols and free fatty acids (Dobarganes et al., 2000). The quantitative determination of these polar compounds by high-performance high-exclusion chromatography (HPSEC) (Marmesat
et al., 2007) allows for studying in detail the degradation of thermoxidized oils and the progress of oxidative, hydrolytic and thermal
reactions. This information can be a useful tool for a proper interpretation of FTIR spectra.
The aim of the present study is to examine the major and minor spectral changes occurring in virgin olive oil during thermoxidation
by means of FTIR spectroscopic analysis of the samples, and their polar and nonpolar fractions of the samples. Special attention
is given to the FTIR spectra of polar fractions and the spectral bands that are not observed in the spectra of the oils, or
they are barely noticed. The polar fractions were analyzed by HPSEC and the results served to explain the time-course change
in the different bands and the chemical reactions associated with them. Special attention is given to the FTIR spectra of
polar fractions and the spectral bands that are not observed in the spectra of the oils, or they are barely noticed.
2. MATERIALS AND METHODSTOP
2.1. Sample PreparationTOP
Forty-seven samples of thermoxidized virgin olive oil were obtained from a discontinuous domestic thermoxidation process.
Commercial Spanish virgin olive oil, purchased at a local supermarket for frying purposes, was used as a model system. Although
the oxidative protection of virgin olive oils greatly depends on their cultivar due to differences in composition (e.g. fatty
acids, phenols, etc.), this oil was considered to be representative enough for tracking and assessing oxidation through a
qualitative observation of the spectral changes. The thermoxidation process was carried out in a 4 L domestic fryer with an
automatic temperature controller (Heidolph EKT 3001, Schwabach, Germany). Three liters of virgin olive oil were heated at
190 °C for 94 hours in cycles of 8 hours per day. A sample of 40 mL was collected every 2 hours until the end of the heating
process. Samples were kept in brown glass vials at 4 °C until further chemical and spectroscopic analyses. This experiment
was repeated with another commercial virgin olive oil to validate the results obtained with the first sequence of samples.
In this second experiment a sample was collected every 10 hours until obtaining 10 samples of 40 mL. These samples were used
to validate the regression analysis in those bands that allowed for a linear mathematical modeling and to check the consistency
of the trends observed for each spectral change.
2.2. Analysis of Total Polar CompoundsTOP
The percentage of total polar compounds (TPC) was determined gravimetrically according to the IUPAC Standard Method N° 2.507
(IUPAC, 1992). Nonpolar and polar fractions were separated from 1 g of oil by silica gel column chromatography (20 g silica adjusted to
a water content of 5%, w/w) hexane/diethyl ether (90:10, v/v) and 150 mL diethyl ether as elution systems, respectively. The
nonpolar fraction was eluted with 150 mL of n-hexane/diethyl ether (90:10, v/v), while the polar fraction was eluted with
150 mL of diethyl ether. Efficiency of the separation was confirmed by TLC using n-hexane/diethyl ether/acetic acid (80:20:1,
v/v/v) and visualized with iodine vapor. The percentage of polar fraction was calculated by weighing both fractions after
the evaporation of the solvents.
2.3. Distribution of Polar Compounds by High-Performance Size-Exclusion Chromatography (HPSEC)TOP
This method determines the contents of polymerized triacylglycerols, oxidized triacylglycerols, and diacylglycerols in oils.
It was applied to the polar fraction of heated virgin olive oil.
A solution of sample polar fraction in hexane (15 mg/mL) was analyzed by high performance liquid chromatography (Agilent Technologies
1200) on two columns Hewlett Packard PL gel, 30 cm×0,75 cm i.d., packed with high-performance spherical gel made of styrene-divinylbenzene
co-polymer, particle size 5 μm, pore size 100 Å and 500 Å, respectively (Agilent Technol., Madrid, España), connected in a
series in the order 500 Å and 100 Å, eluting with tetrahydrofuran at a flow rate of 1 mL/min. The injection volume was 10
μL. A refractive index detector (Agilent Technologies 1200) was used. The quantification was done according to Dobarganes
et al., 2000. The calculation is achieved assuming that all compounds of the sample are eluted. The contents of the different groups of
compounds were expressed as percentages in the oil.
2.4. Fatty Acid AnalysisTOP
Total fatty acids were transmethylated according to ISO 5509. About 0.2 g of commercial virgin olive oil were dissolved in
4 mL of hexane and 0.4 mL of a solution of 2 N de KOH in methanol. The mixture was vigorously shaken for 10–15 seconds. The
sample (0.2 μl) was injected into a gas chromatograph (Varian 3900) equipped with a split-splitless injector and a flame ionization
detector. An SP-2380, 60×0.25 mm ID and 0.25 μm column (Supelco) was used. The injector and detector temperatures were set
at 225 °C and 250 °C respectively. The oven temperature was held at 170 °C for 10 min, then programmed from 170 °C to 210
°C at 1.5 °C·min−1 and finally held at the last temperature for 8 min. Hydrogen was used as carrier gas at a flow rate of 1.0 mL·min−1. Each sample was analyzed in duplicate.
The results were expressed as g fatty acid·100 g−1 total fatty acids (%). The results were normalized according to Dobarganes and Pérez-Camino (1988).
2.5. Analysis of PhenolsTOP
A standard solution (0.5 mL) made of p-hydroxyphenylacetic (0.12 mg·mL−1) and o-coumaric acids (0.01 mg·mL−1) in methanol was added to a sample of filtered virgin olive oil (2.5 g). A rotary evaporator at 40 °C under vacuum was used
to evaporate the solvent and the oily residue was dissolved in 6 mL of hexane.
The diol-bonded phase cartridge was conditioned according to Mateos et al., (2001). After the sample loading, the final residue was extracted with 500 μL of methanol-water (1:1 v/v) at 40 °C and a filtrated
aliquot (20 μL) of the final colorless solution was injected into the HPLC system (LaChrom Elite Tokio, Japan), equipped with
a diode array detector. The column was a Lichrospher 100RP-18 column (4.0 mm i.d.×250 mm; 5 μm, particle size) (Darmstadt,
Germany) maintained at 30 °C. The gradient elution, at a flow rate of 1.0 mL·min−1, was created using the following mobile phases: A mixture of water/phosphoric acid (95.5:0.5 v/v) (solvent A) and methanol-acetonitrile
(50:50 v/v) (solvent B). The change in solvent gradient was programmed as follows: from 95% (A)−5% (B) to 70% (A)−30% (B)
in 25 min; 62% (A)−38% (B) in 10 min; 62% (A)−38% (B) in 5 min; 55% (A)−45% (B) in 5 min; 47,5% (A)−52,5% (B) in 5 min and
100% (B) in 5 min, followed by 5 min of maintenance. The chromatographic signals were obtained at 235, 280, and 335 nm. The
response factors and recoveries were based on the procedure developed by Mateos et al., (2001).
2.6. FTIR SpectroscopyTOP
Spectral data were collected using a Bruker 55 Equinox S FTIR spectrometer equipped with a DGTS detector (Bruker Optics, Ettlingen,
Germany). The sampling station was equipped with a support of transmission cell. The cell used to collect the spectra was
a removable cell model 20510 (Specac, Orpington, UK), with windows of KBr and an optical path length of 150 μm. Each spectrum
was recorded at room temperature in the region of 4000–400 cm−1 from an average of 22 scans at a resolution of 4 cm−1. Each sample (20 μL) was injected into the interior of the cell using a micropipette and analyzed in duplicate. Between samples,
the cell was thoroughly cleaned by using a membrane vacuum pump (Vacuubrand MD 4C NT, Wertheim, Germany). The sample was removed
from the cell by aspiration and by passing hexane through the cell. The cell was later dried with nitrogen gas and a spectrum
was scanned to test the cleanliness of the windows and the total absence of sample.
The spectra were manipulated with OPUS version 4.0 (Bruker Optics, Ettlingen, Germany). Peak areas were computed on the raw
spectra and the results were exported as ASCII data for further statistical analysis.
The spectra of oleic, linoleic and linolenic acids and trioleine were acquired from pure standards (Sigma-Aldrich, St. Louis,
MO).
2.7. Statistical AnalysisTOP
Univariate and multivariate algorithms have been applied by means of Statistica version 6.0 (Statsoft, Tulsa OK). Stepwise
multiple linear regression analysis (SMLRA) was the statistical procedure for the selection of IR bands that better correlate
with the polar compound percentage and the percentage of the different groups of compounds identified in the polar fraction.
The objective of this statistical procedure was to select the wavenumbers that could predict which kind of degradation reaction
is happening in the frying oil during the process, using the TPC and the percentage of the different groups of compounds in
the polar fraction as reference for the alteration degrees of the samples. The F-to-enter and F-to-remove values specified
a priori determined the wavenumbers included or excluded from the model (Tabachnick and Fidell, 1983). In order to assure the significance of the results and avoid a good result by chance the F-to-Enter/Remove values were
selected under the strictest conditions (Fisher-distribution table at p=0.05). The concentration of some compounds did not
show a linear trend during the thermoxidation process, and for this reason no linear regression model was used in those cases.
3. RESULTS AND DISCUSSIONTOP
3.1. FTIR spectra of neat thermoxidized virgin olive oilsTOP
The FTIR spectra of the virgin olive oils (VOOs) thermoxidized from 0 to 94 hours show remarkable changes in the bands assigned
to (i) hydroxyl groups (-OH) indicative of the oxidation reactions (3584–3508 cm−1), (ii) first overtone of the stretching vibration of the ester group of triacylglycerols (C=O) (3472 cm−1), (iii) single cis double bonds (3005 cm−1), (iv) changes in the band assigned to single trans double bonds, the band at 967 cm−1 (976–963 cm−1). All these spectral regions provide information about the chemical structures that are involved in the complex degradation
reactions occurring in the oil during the frying process. The band that better correlated with the percentage of total polar
compounds (TPC) was the band assigned to single trans double bonds, the band centered at 967 cm−1 (976–963 cm−1), which was already observed in a previous work carried out with ATR (Tena et al., 2009). The equation resulting from regressing TPC against the area of the single trans double bonds has a regression coefficient adjusted-R2 of 0.99 and a standard deviation in the prediction of RSD=1.44%:
TPC (%)=−3.78+124.06×[FTIR trans band area]
The regression line points out a linear relationship when TPC is lower than 30% (Figure 1A), and the goodness of the regression model allowed for a successful validation with the other 10 thermoxidized olive oil
samples collected every 10 hours from a domestic fryer for 90 hours. However, the prediction value is overestimated from 30%
onwards (Figure 1B). This overestimation is due to the heterocedastic behavior of the regression, where the lower values of band areas have
more error than the higher values, probably due to a problem of lack of sensitivity.
|
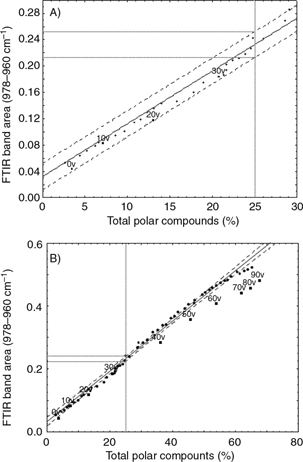 Figure 1. Linear regression between the area of the single trans double bonds band (976–963 cm−1) and the percentage of total polar compounds for percentages lower than 30% (A), and for the entire experiment (B). Validation
samples are labelled with the letter “v” and a number corresponding to the hours of thermoxidation. Figure 1. Linear regression between the area of the single trans double bonds band (976–963 cm−1) and the percentage of total polar compounds for percentages lower than 30% (A), and for the entire experiment (B). Validation
samples are labelled with the letter “v” and a number corresponding to the hours of thermoxidation.
|
|
As a consequence of the formation of trans double bonds during thermoxidation (Tena et al., 2009), the band assigned to cis double bonds (3013–2991 cm−1) decreases as the thermal degradation progresses. The area of this band in the initial non thermoxidized sample is higher
than any value of band area of the single trans double bonds quantified in the rest of the samples, and it decreases up to 50% of the initial value at the end of the experiment. This band area is correlated with TPC by linear regression (adjusted-R2=0.98; RSD=2.48%). However, the behavior of the band area assigned to the single cis double bonds is not completely linear, unlike the band area assigned to trans double bonds. The lack of linearity explains that the former band was not selected as a control parameter of the thermoxidation
process in a previous study carried out with ATR-FTIR (Tena et al., 2009). Thus, the band area of cis double bonds (3013–2991 cm−1) explains TPC with an adjusted-R2 of 0.99 (RSD=0.96%) by means of the following non linear regression model:
TPC (%)=56.22 + 42.78×[FTIR cis band area] - 25.45×[FTIR cis band area]2
The content of cis double bonds follows two approximately linear behaviors with intersection at around 45% of the total polar compounds (60
h of thermoxidation). The two lines intersect forming a five degree angle between them.
The composition of fatty acids in the samples was determined by gas chromatography to provide a chemical explanation for the
observed changes in the band assigned to single cis double bonds. Oleic acid accounts for 75.93% of the total fatty acids present in the unaltered oil (non thermoxidized sample),
while linoleic and linolenic acids account for 4.55% and 0.67%, respectively (Table 1). The relatively high percentage of oleic acid suggests that a significant amount of single cis double bonds, quantified by the FTIR band area (3013–2991 cm−1), is due to oleic acid. This hypothesis was verified by regressing the percentage of oleic acid using the band area assigned
to single cis double bonds (3013–3991 cm−1). The linear model that explains the percentage of oleic acid has an adjusted-R2 of 0.93 (RSD=1.84%):
Oleic acid (%)=19.95+22.32×[FTIR cis band area]
Table 1. Percentages of total polar compounds, polar polymers, oxidized triacylglycerols, diacylglycerols, oleic, linoleic
and linolenic acids, and the content of o-diphenols (mg/kg) in the virgin olive oil samples during the thermoxidation experiment. Note: TAG, Triacylglycerols; DAG,
Diacylglycerols; tr, trace levels.
| Thermoxidation time (hours) |
Total polar compounds |
Polar polymers |
Oxidized TAG |
DAG |
C18:1 |
C18:2 |
C18:3 |
o-diphenols
|
| 0 |
3.5 |
0.2 |
1.4 |
1.3 |
75.9 |
4.6 |
0.7 |
134.1 |
| 6 |
5.1 |
1.5 |
1.7 |
1.4 |
72.9 |
4.0 |
0.6 |
70.0 |
| 10 |
7.1 |
2.7 |
2.5 |
1.5 |
72.4 |
3.9 |
0.5 |
29.8 |
| 16 |
9.4 |
3.9 |
3.5 |
1.6 |
72.2 |
3.4 |
0.5 |
11.6 |
| 20 |
13.0 |
5.9 |
4.9 |
1.8 |
71.4 |
3.4 |
0.5 |
8.7 |
| 26 |
18.6 |
8.9 |
7.2 |
2.0 |
70.8 |
3.1 |
0.5 |
7.4 |
| 30 |
20.8 |
10.9 |
7.9 |
1.6 |
69.5 |
3.0 |
0.5 |
7.2 |
| 36 |
31.0 |
16.3 |
12.7 |
2.2 |
69.3 |
2.7 |
0.4 |
tr |
| 40 |
36.1 |
18.9 |
15.9 |
2.0 |
67.3 |
2.3 |
0.2 |
tr |
| 46 |
37.9 |
21.6 |
14.5 |
2.6 |
65.2 |
2.0 |
0.2 |
tr |
| 50 |
45.7 |
25.9 |
18.3 |
2.6 |
64.0 |
1.8 |
0.2 |
– |
| 56 |
50.6 |
30.5 |
18.8 |
3.0 |
63.0 |
1.6 |
0.2 |
– |
| 60 |
53.9 |
32.8 |
18.8 |
4.0 |
62.2 |
1.6 |
0.2 |
– |
| 66 |
60.5 |
37.2 |
21.7 |
4.0 |
60.8 |
1.4 |
0.2 |
– |
| 70 |
61.9 |
39.7 |
21.6 |
3.8 |
58.4 |
1.2 |
0.2 |
– |
| 76 |
63.8 |
40.3 |
21.9 |
4.9 |
58.0 |
1.2 |
0.1 |
tr |
| 80 |
64.8 |
42.1 |
22.1 |
4.6 |
55.8 |
1.0 |
0.1 |
– |
| 86 |
66.0 |
42.8 |
22.3 |
5.1 |
53.8 |
0.8 |
0.1 |
– |
| 90 |
67.7 |
44.7 |
22.2 |
6.0 |
51.3 |
0.7 |
tr |
– |
| 94 |
68.1 |
45.6 |
21.9 |
5.5 |
50.5 |
0.7 |
tr |
– |
In addition to cis/trans transformation during thermoxidation, the use of FTIR spectroscopy is also particularly useful for monitoring hydroperoxides
and hydroxyl derivatives that are produced during oxidation (van de Voort et al., 2001). Thus, the spectral region of 3600–3410 cm−1 was examined to extract information about the oxidation process involved in a thermal degradation (Figure 2). This region includes the band assigned to hydroperoxide moieties due to the –OO-H stretching vibration (~3425 cm−1) and the band associated to alcohol groups (~3544 cm−1) (van de Voort et al., 2001; Russin et al., 2003; van de Voort et al., 1994). The locations of these bands strongly depend on sample polarity and they gradually shift as the oxidation progresses (Russin
et al., 2003). The first overtone of stretching vibration of ester group C=O of triacylglycerols, whose fundamental band absorbs at ~1746
cm−1, is also located in this region (~3472 cm−1) (van de Voort et al., 2001; Russin et al., 2003; van de Voort et al., 1994).
|
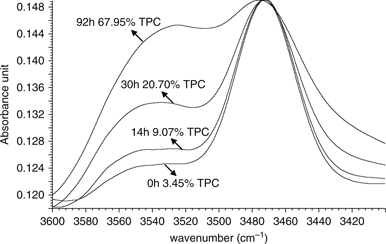 Figure 2. Time-course change in the bands assigned to hydroxyl groups (3544 cm−1), hydroperoxides (3425 cm−1) and the first overtone of esters groups (3472 cm−1) during the thermoxidation process in virgin olive oil. Figure 2. Time-course change in the bands assigned to hydroxyl groups (3544 cm−1), hydroperoxides (3425 cm−1) and the first overtone of esters groups (3472 cm−1) during the thermoxidation process in virgin olive oil.
|
|
Although the concentration of hydroperoxides in oils undergoing thermoxidation is expected to be low due to the breakdown
of these compounds at high temperatures (Velasco and Dobarganes, 2002), it is important to note that hydroperoxides may be formed shortly after taking each sample and they are cooled at room
temperature before being frozen. Furthermore, the thermoxidation process was carried out emulating a common discontinued frying
process, where the oil is kept at room temperature between frying cycles and hydroperoxides are accumulated before the next
frying session. Although the FTIR absorption of hydroperoxides is observable in this region, the band assigned to the first
overtone of the ester groups C=O (~3472 cm−1) clearly interferes in the surrounding regions and makes any study of this area difficult to carry out (Figure 2). Thus, this overlapping negatively affects the quantification of the hydroperoxide band (~3425 cm−1) and the overtone of the ester group, which provides information on the hydrolysis of triacylglycerols during thermoxidation.
Furthermore, the small concentrations of hydroperoxydes –~12 meq of O2·kg−1 of oil (Moya Moreno et al., 1999) – prevent them from being quantified accurately (van de Voort et al., 1994). The extraction of the polar and nonpolar fractions of the samples and their subsequent study by FTIR can resolve the overlapping
problem of the hydroxyl region by simplifying the whole spectrum and would provide the added advantage of supplying more details
about the chemical changes that take place.
3.2. FTIR spectra of polar and non polar fractions of thermo-oxidized virgin olive oilsTOP
Figure 3 shows the variance spectra computed from the whole set of spectra collected for the neat oil, polar and nonpolar fractions.
These spectra highlight the most significant changes during the whole thermoxidation process.
|
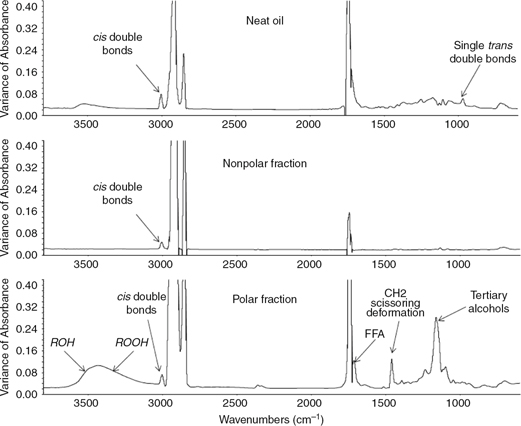 Figure 3. Variance spectra computed from the whole set of spectra of 47 thermoxidation samples, polar and nonpolar fractions. Figure 3. Variance spectra computed from the whole set of spectra of 47 thermoxidation samples, polar and nonpolar fractions.
|
|
Comparing the variance spectra of polar and nonpolar fractions, it is noticeable that most of the spectral changes are observed
in the former (Figure 3). The near absence of relevant spectral changes in the nonpolar fraction spectrum is explained by the fact that most of the
new products generated in thermal processes are polar (Marmesat et al., 2007). Thus, the compounds containing hydroxyl groups are exclusively present in the polar fraction, and the high intensity of
the band assigned to hydroperoxides allows for their quantification. Furthermore, this band is free of the interference of
the overtone band associated to the ester linkage (Figure 2). Figure 4 shows the spectral region between 3600–3200 cm−1 collected from the polar fraction and nonpolar fraction of a thermoxidized virgin olive oil sample. The spectrum of the nonpolar
fraction only shows a single band centered within 3510–3430 cm−1, which is due to the first overtone of the stretching vibration of the ester group in triacylglycerols (van de Voort et al., 2001). By contrast, in the polar fraction, the spectrum has a higher absorption, which can be divided into three bands: (i) a
weak band located within 3510–3430 cm−1, assigned to the first overtone of the ester group of triacylglycerols; (ii) a shoulder at higher wavenumbers assigned to
hydroxyl groups of alcohols (~3544 cm−1) (van de Voort et al., 2001; Russin et al., 2003; van de Voort et al., 1994); and (iii) a shoulder at lower wavenumbers assigned to the hydroxyl groups of hydroperoxides (3425 cm−1) (van de Voort et al., 2001). The hydroperoxides, already present in the non thermoxidized sample, are decomposed into secondary oxidation products during
the whole thermoxidation process, reducing their concentration until 20h of thermoxidation (14% of TPC). At this moment, the
intensity of this band varies slightly with time and tends to reach a plateau.
|
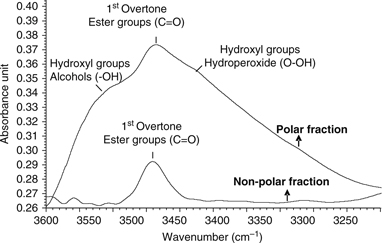 Figure 4. Polar and nonpolar fraction spectra in the region (3600–3200 cm−1) of a thermoxidized virgin olive oil (VOO) samples. Figure 4. Polar and nonpolar fraction spectra in the region (3600–3200 cm−1) of a thermoxidized virgin olive oil (VOO) samples.
|
|
One of the most relevant bands in the variance spectrum of the polar fraction is located around ~1167 cm−1 (Figure 3). This band is assigned to tertiary alcohols (C-O stretching) (Coates, 2000), which they can be formed as secondary oxidation products. This band rises during thermoxidation following a trend opposite
to that of the hydroperoxide band (Figure 5). Thus, this band reaches a maximum intensity at 20 hours of thermoxidation (14% of TPC), probably due to the end of the
hydroperoxide breakdown. This band may also be assigned to phenols (~1200 cm−1, C-O stretching) (Coates, 2000), although their contribution to this band may be irrelevant since its intensity rises during the process while the concentration
of phenols decreases (Table 1).
|
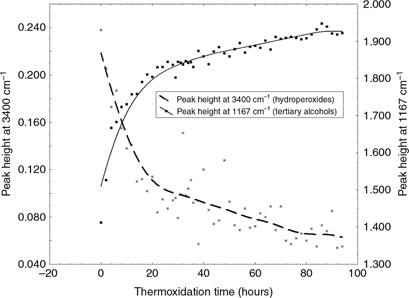 Figure 5. Time-course trend in the the band assigned to hydroperoxides (~3400 cm−1) and tertiary alcohols (~1167 cm−1) in the spectra of polar fractions during the thermoxidation process. Figure 5. Time-course trend in the the band assigned to hydroperoxides (~3400 cm−1) and tertiary alcohols (~1167 cm−1) in the spectra of polar fractions during the thermoxidation process.
|
|
The moment in which the hydroperoxide and the tertiary alcohols reach a plateau matches with a trend change observed for the
different polar chemical groups analyzed by HPSEC. Table 1 shows the percentages of TPC, polymerized triacylglycerols, oxidized triacylglycerols, and diacylglycerols throughout the
experiment. Polar polymers and oxidized triacylglycerols are the main compounds produced by oxidation at high temperatures
(Dobarganes and Marquez-Ruiz, 1998; Caldwell et al., 2011), and they accounted for 45.61% and 21.91% in most of the thermoxidized oil. The concentration of these compounds rises more
rapidly after 20 h of the process. This inflection at 20 hours is not observed for other polar compounds resulting from hydrolysis
(diacylglycerols and free fatty acids), whose formation is not directly related to hydroperoxide breakdown. The observed inflection
at 20 h also coincides with the moment in which the concentration of o-diphenols abruptly decreases to 8.71 mg·kg−1, which means 6.5% of the initial concentration (Table 1). After that moment, the oil is hardly protected against oxidation by means of antioxidants, and the oil undergoes oxidation
at a higher rate, which depends on its composition of fatty acids (Barrera-Arellano et al., 2002). Similar inflections in the increasing trend of polar polymers and oxidized triacylglycerols are observed after 20 h (Table 1).
In addition to the O-H vibration observed for hydroperoxides at ~3425 cm−1, the C-O-O stretching of peroxides and epoxy produce a weak absorption in the range of 890–800. Although this absorption
is not as evident in the variance spectra as the hydroperoxide band (Figure 3), it is present in the spectra of the polar fractions and absent in the spectra for oils and their nonpolar fraction (Figure 6). Since it is a complex region characterized by weak bands along the wavenumbers of the region, the area under the spectra
was considered the best parameter for studying the trend, instead of the peak height. Figure 6 shows the time-course change of the peak area and the spectra in the region under study (890–800 cm−1). The area rapidly increases during the first hours of the experiment. However, unlike the trends observed for hydroperoxide
and tertiary alcohols, the epoxy and peroxide band rises at a slower pace after 6 hours of thermoxidation (9% of TPC). The
epoxy groups responsible for this absorption are formed during thermoxidation and they attach to the triacylglycerol molecules,
resulting in oxidized monomeric triacylglycerols (Velasco et al., 2004). Thus, an oxidation study carried out with methyl oleate and triolein prove the occurrence of trans-9,10- and cis-9,10-epoxystearate, while the same experiment carried out with methyl linoleate and trilinolein produced a series of monounsaturated
epoxides (epoxyoleates) (Bordeaux et al., 1999). In this study the epoxides coming from monounsaturated fatty acids showed a higher stability, and thereby a higher concentration.
|
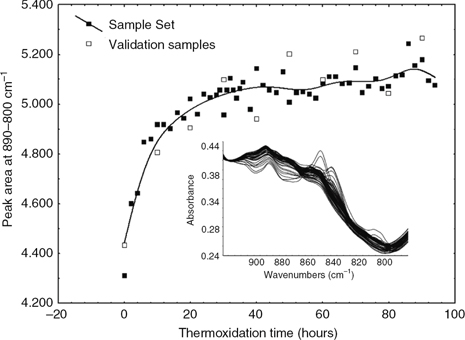 Figure 6. Time-course change in the peak area and the absorption in the region (890–800 cm−1) assigned to peroxide and epoxy groups for the polar fraction during the thermoxidation process. Figure 6. Time-course change in the peak area and the absorption in the region (890–800 cm−1) assigned to peroxide and epoxy groups for the polar fraction during the thermoxidation process.
|
|
In the variance spectrum for the polar fraction the band located at 1450 cm−1 is also noteworthy. This band is assigned to CH2 scissoring deformation (Ismail et al., 1999). However, the intensity of this band is close to the cut-off limit (Figure 7) and consequently the signal is out of the working range for quantitative studies. On the contrary, the nearby band at 1417
cm−1 (Figure 7) is on-scale and can be quantified. The observable magnitude of this band in the variance spectra is likely due to the hydrolysis
of triacylglycerols to produce free acids, although in this case the hydrolysis process is much less significant compared
to oxidation since no food was fried (Zhang et al., 2012; Romero et al., 1998). The absorption at 1417 cm−1 is assigned to the out-of-plane hydroxyl group bending mode δ (O-H----O) (Smith and Victoria, 1968). Thus, the spectrum of pure oleic acid shows this band, unlike that of their corresponding triacylglycerols (triolein) (Figure 7). This difference between the free fatty acids and their corresponding triacylglycerols has also been found for other fatty
acids (linoleic and linolenic acids). Figure 6 shows the trend of this band (1417 cm−1) over time. It rises for 24 hours, and then suddenly reaches stabilization.
|
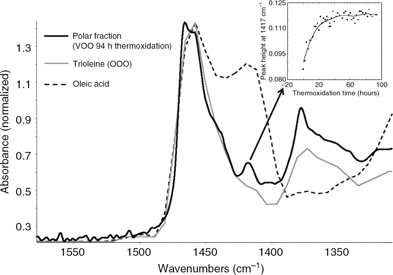 Figure 7. FTIR Spectra (1600–1300 cm−1) of virgin olive oil thermoxidized for 94 hours, pure triolein and oleic acid. The time-course change in the band assigned
to hydroxyl groups (1417 cm−1) in the polar fraction spectra during the thermoxidation process is shown as an insert. Figure 7. FTIR Spectra (1600–1300 cm−1) of virgin olive oil thermoxidized for 94 hours, pure triolein and oleic acid. The time-course change in the band assigned
to hydroxyl groups (1417 cm−1) in the polar fraction spectra during the thermoxidation process is shown as an insert.
|
|
The rise in free fatty acids is also noticeable in the variance spectrum of the polar fraction in the range of 1780–1670 cm−1 (Figure 3). Thus, the ester linkage band is doubled into two bands. One of them is centered at 1743 cm−1, which is assigned to the decrease in ester linkages because of the hydrolysis of triacylglycerols. This band is off-scale
and cannot be quantified. The other band is located at 1713 cm−1 and is assigned to the carbonyl group of the carboxylic acid (Coates, 2000). Although this band is more noticeable in the spectra of the polar fraction, it is not clear that this band is only due
to free fatty acids, since it decreases at the beginning of the process, until it starts rising from 30 hours onwards (22%
of TPC) (Figure 8). The dramatic shrink of this band at the beginning of the process is probably due to the carbonyl group of ketones, which
also absorb in this region (1725–1705 cm−1) (Coates, 2000), together with the thermal deterioration of the existing free fatty acids of the unaltered oil. The increasing trend shown
in the peak height computed in the spectra of the oil corresponds to the results obtained by other authors analyzing free
fatty acids in frying oils (Innawong et al., 2004; Casal et al., 2010) as well as to the determined concentrations of diacylglycerols resulting from hydrolysis (Table 1), which rise from 1.32% to 5.51%.
|
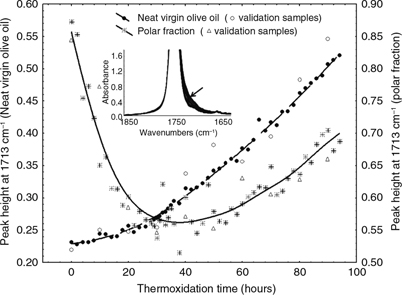 Figure 8. The time-course change in the peak height at 1713 cm−1 computed in the spectra of virgin olive oils and polar fractions during the thermoxidation process. The spectra of the oils
(1850–1650 cm−1) are shown as an insert. Figure 8. The time-course change in the peak height at 1713 cm−1 computed in the spectra of virgin olive oils and polar fractions during the thermoxidation process. The spectra of the oils
(1850–1650 cm−1) are shown as an insert.
|
|
A reduction in the band at ~1746 cm−1 assigned to the stretching vibration of ester linkage (C=O) was also observed, which means a decline in the concentration
of triacylglycerols. This band is off-scale in all the spectra because of its strong intensity. Thus, the time-course change
of the ester groups of triacylglycerols has been studied through the first overtone of ester groups (~3472 cm−1). Although this band interferes with the rest of absorptions of the hydroxyl region (3600–3410 cm−1) (Figure 2), in the spectra of the nonpolar fractions this band is isolated and consequently can be easily measured (Figure 4).
Figure 9A shows the trend of the band area of the first overtone of ester linkage absorption (3493–3452 cm−1) (Figure 4) in the nonpolar fraction of the samples adversus the percentage of total polar compounds. The band area is almost constant with a slight tendency to decrease until the moment
that the oil reaches ~26% of total polar compounds (~36 hours of thermoxidation). At this moment, the concentration of esters
starts decreasing linearly. This trend matches that of the band assigned to free fatty acids in the oils (1713 cm−1) (Figure 8), whose intensity increases at a faster rate from 30 hours (TPC=22%) onwards. The decline in the ester linkage absorption
associated to triacylglycerols is explained by the hydrolysis reactions that take place during thermoxidation, the principal
by-products being free fatty acids and diacylglycerols. Figure 9B shows the relationship between the diacylglycerol content and the total polar compounds. The time-course change in the concentration
of diacylglycerols is consistent with the decrease in intensity of the overtone band of the ester linkage band (Figure 9A), which corroborates the relationship of the latter with hydrolysis.
|
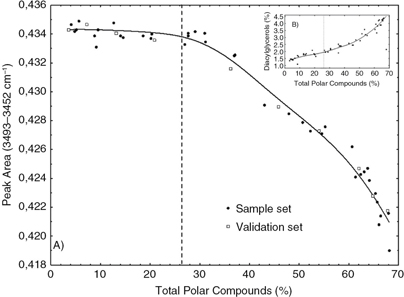 Figure 9. (A) Time-course change in the band area of the first overtone of ester linkage absorption (3493–3452 cm−1) in the nonpolar fraction of the samples during the thermoxidation process. (B) Relationship between diacylglycerol content
and the percentage of total polar compounds. Figure 9. (A) Time-course change in the band area of the first overtone of ester linkage absorption (3493–3452 cm−1) in the nonpolar fraction of the samples during the thermoxidation process. (B) Relationship between diacylglycerol content
and the percentage of total polar compounds.
|
|
4. CONCLUSIONTOP
The analysis of thermoxidized oils with transmission cell allows for the tracking of weak bands that evolve during thermoxidation
with a sufficient signal to noise ratio. Unlike the single trans double bonds, the band assigned to cis double bonds (3010 cm−1) has a non linear trend and it can only be modeled by the quadratic regression model to predict TPC (%). Regarding the rest
of the chemical species evolving during thermoxidation, their time-course change does not match the total polar compounds
contents, and they show different trends depending on the chemical reaction responsible for their formation (either oxidation
or hydrolysis). Since most of the chemical changes take place in the polar fraction, the FTIR analysis of polar and nonpolar
fractions leads to a better interpretation of the oil spectra. Thus, the analysis of the hydroxyl region is simplified by
isolating the hydroperoxide and alcohol bands in the polar fraction, and taking apart the first overtone of the ester linkage
band in the nonpolar fraction. The spectra of polar fractions also provides valuable information on the bands associated with
free fatty acids, epoxy and peroxide compounds since their absorption are more intense compared to the spectra of the oil.
This study improves the interpretation of the spectral changes occurring during thermoxidation of virgin olive oil, and establishes
an advanced knowledge in support of the use of FTIR spectroscopy for monitoring thermoxidized oils.
5. ACKNOWLEDGEMENTTOP
This research has been partially funded by the Spanish State Secretary for Research (Ramón y Cajal Program, AGL2008-01411
and AGL2011-30371-C02-02).
REFERENCESTOP
| ○ |
Baeten V, Fernandez Pierna JA, Dardenne P, Meurens M, García-González DL, Aparicio-Ruiz R. 2005. Detection of the presence
of hazelnut oil in olive oil by FT-Raman and FT-MIR spectroscopy. J. Agric. Food Chem. 53, 6201–6206. http://dx.doi.org/10.1021/jf050595n |
| ○ |
Barrera-Arellano D, Ruiz-Méndez V, Velasco J, Márquez-Ruiz G, Dobarganes C. 2002. Loss of tocopherols and formation of degradation
compounds at frying temperatures in oils differing in degree of unsaturation and natural antioxidant content. J. Sci. Food Agric. 82, 1696–1702. http://dx.doi.org/10.1002/jsfa.1245 |
| ○ |
Billek G. 2000. Health aspects of thermoxidized oils and fats. Eur. J. Lipid Sci. Technol. 102, 587–593. http://dx.doi.org/10.1002/1438–9312(200009)102:8/9<587::AID-EJLT587>3.3.CO;2-R |
| ○ |
Bordeaux O, Márquez-Ruiz G, Dobarganes MC. 1999. Characterization, quantitation and evolution of monoepoxy compounds formed
in model systems of fatty acid methyl esters and monoacid triglycerides heated at high temperature. Grasas Aceites 50, 53–59. http://dx.doi.org/10.3989/gya.1999.v50.i1.636 |
| ○ |
Caldwell JD, Cooke BS, Greer MK. 2011. High performance liquid chromatography-size exclusion chromatography for rapid analysis
of total polar compounds in used frying oils. J. Am. Oil Chem. Soc. 88, 1669–1674. http://dx.doi.org/10.1007/s11746-011-1845-5 |
| ○ |
Casal S, Malheiro R, Sendas A, Oliveira BPP, Pereira JA. 2010. Olive oil stability under deep-frying conditions. Food Chem. Toxicol. 48, 2972–2979. http://dx.doi.org/10.1016/j.fct.2010.07.036 |
| ○ |
Christophoridou S, Dais P. 2009. Detection and quantification of phenolic compounds in olive oil by high resolution 1H nuclear magnetic resonance spectroscopy. Anal. Chim. Acta 633, 283–292. http://dx.doi.org/10.1016/j.aca.2008.11.048 |
| ○ |
Coates J. 2000. Interpretation of infrared spectra, a practical approach. In: R.A. Meyers (Ed.) Encyclopedia of Analytical Chemistry. John Wiley & Sons Ltd.: Chichester, U.K. pp. 1–23.
|
| ○ |
Dobarganes MC, Márquez-Ruiz G. 1998. Analytical evaluation of fats and oils by size-exclusion chromatography. Analysis 26, 61–65. http://dx.doi.org/10.1051/analusis:199826030061 |
| ○ |
Dobarganes MC, Pérez-Camino MC. 1988. Fatty acid composition: a useful tool for the determination of alteration level in heated
fats. Rev. Fr. Corps Gras 35, 67–70.
|
| ○ |
Dobarganes MC, Velasco J, Dieffenbacher A. 2000. Determination of polar compounds, polymerized and oxidized triacylglycerols,
and diacylglycerols in oils and fats – Results of collaborative studies and the standardized method (Technical Report). Pure Appl. Chem. 72, 1563–1575. http://dx.doi.org/10.1351/pac200072081563 |
| ○ |
Friedman M, Levin CE. 2008. Review of methods for the reduction of dietary content and toxicity of acrylamide. J. Agric. Food Chem. 56, 6113–6140. http://dx.doi.org/10.1021/jf0730486 |
| ○ |
García-González DL, Aparicio-Ruiz R, Aparicio R. 2009. Olive oil. In Gourmet and Health-Promoting Oils; Kamal-Eldin A, Moreaou R (Ed.) AOCS press: Champaign, IL, pp. 33–72.
|
| ○ |
Innawong B, Mallikarjunan P, Marcy JE. 2004. The determination of frying oil quality using a chemosensory system. Food Sci. Technol.-Leb. 37, 35–41.
|
| ○ |
Ismail AA, Nicodemo A, Sedman J, van de Voort F, Holzbaur IE. 1999. Infrared spectroscopy of lipids: Principles and applications.
In Spectral Properties of Lipids; Hamilton, RJ, Cast, J (Ed.) CRC Press: Boca Raton, FL. pp. 235–269.
|
| ○ |
IUPAC 2.507. 1992. International Union of Pure and Applied Chemistry (IUPAC). Determination of polar compounds in frying fats.
In Standard Methods for the Analysis of Oils, Fats and Derivatives, (7th ed.). Blackwell: Oxford, U.K.
|
| ○ |
Li Y, García-González DL, Yu X, van de Voort FR. 2008. Determination of free fatty acids in edible oils with the use of a
variable filter array IR spectrometer. J. Am. Oil Chem. Soc. 85, 599–604. http://dx.doi.org/10.1007/s11746-008-1232-z |
| ○ |
Marmesat S, Velasco J, Marquez-Ruiz G, Dobarganes MC. 2007. A rapid method for determination of polar compounds in used frying
fats and oils. Grasas Aceites 58, 179–184.
|
| ○ |
Mateos R, Espartero JL, Trujillo M, Ríos JJ, León-Camacho M, Alcudia F, Cert A. 2001. Determination of phenols, flavones,
and lignans in virgin olive oils by solid-phase extraction and high-performance liquid chromatography with diode array ultraviolet
detection. J. Agric. Food Chem. 49, 2185–2192. http://dx.doi.org/10.1021/jf0013205 |
| ○ |
Moya Moreno MCM, Mendoza Olivares D, Amézquita López FJ, Gimeno Adelantado JV, Bosch Reig F. 1999. Analytical evaluation of
polyunsaturated fatty acids degradation during thermal oxidation of edible oils by Fourier transform infrared spectroscopy.
Talanta 50, 269–275. http://dx.doi.org/10.1016/S0039-9140(99)00034-X |
| ○ |
Piper R. 2001. The market for fried food. In Frying: Improving Quality; Rossell JB. (Ed.) CRC Press: Boca Raton, FL, pp. 7–16. http://dx.doi.org/10.1533/9781855736429.1.7 |
| ○ |
Romero A, Cuesta C, Sánchez-Muniz FJ. 1998. Effect of oil replenishment during deep-fat frying of frozen foods in sunflower
oil and high-oleic acid sunflower oil. J. Am. Oil Chem. Soc. 75, 161–167. http://dx.doi.org/10.1007/s11746-998-0028-5 |
| ○ |
Russin TA, van de Voort FR, Sedman J. 2003. Novel method for rapid monitoring of lipid oxidation by FTIR spectroscopy using
disposable IR cards. J. Am. Oil Chem. Soc. 80, 635–641. http://dx.doi.org/10.1007/s11746-003-0751-8 |
| ○ |
Sanibal EAA, Mancini-Filho J. 2004. Frying oil and fat quality measured by chemical, physical, and test kit analyses. J. Am. Oil Chem. Soc. 81, 847–852. http://dx.doi.org/10.1007/s11746-004-0990-8 |
| ○ |
Scano P, Rosa A, Cesare Marincola F, Locci E, Melis MP, Dessì MA, Lai A. 2008. 13C NMR, GC and HPLC characterization of lipid components of the salted and dried mullet (Mugil cephalus) roe “bottarga”. Chem. Phys. Lipids 151, 69–76. http://dx.doi.org/10.1016/j.chemphyslip.2007.10.001 |
| ○ |
Sedman J, van de Voort FR, Ismail AA, Maes P. 1998. Industrial validation of FTIR trans and iodine value analyses of fats
and oils. J. Am. Oil Chem. Soc. 75, 33–39. http://dx.doi.org/10.1007/s11746-998-0006-y |
| ○ |
Smith JW, Victoria MC. 1968. Infrared spectroscopic investigations of acid-base interactions in aprotic solvents. Part I. The
interaction of tri-n-propylamine and some carboxylic acids. J. Chem. Soc. A, 2468–2474. http://dx.doi.org/10.1039/j19680002468 |
| ○ |
Stier RF. 2001. The measurement of frying oil quality and authenticity. In Frying: Improving Quality; Rossell JB (Ed.) CRC Press: Boca Raton, FL, pp. 7–16. http://dx.doi.org/10.1533/9781855736429.2.165. |
| ○ |
Tabachnick BG, Fidell LS. 1983. Using multivariate Statistics. New York: Harper & Row. |
| ○ |
Tena N, Aparicio R, García-González DL. 2009. Thermal deterioration of virgin olive oil monitored by ATR-FTIR analysis of
trans content. J. Agric. Food Chem. 57, 9997–10003. http://dx.doi.org/10.1021/jf9012828 |
| ○ |
Valavanidis A, Nisiotou C, Papageorgiou Y, Kremli I, Satravelas N, Zinieris N, Zygalaki H. 2004. Comparison of the radical
scavenging potential of polar and lipidic fractions of olive oil and other vegetable oils under normal conditions and after
thermal treatment. J. Agric. Food Chem. 52, 2358–2365. http://dx.doi.org/10.1021/jf030491h |
| ○ |
van de Voort FR, Sedman J, Russin T. 2001. Lipid analysis by vibrational spectroscopy. Eur. J. Lipid Sci. Technol. 103, 815–840. http://dx.doi.org/10.1002/1438–9312(200112)103:12<815::AID-EJLT1111815>3.3.CO;2-G.
|
| ○ |
van de Voort FR, Ghetler A, García-González DL, Li Y. 2008a. Perspectives on Quantitative Mid-FTIR spectroscopy in relation
to edible oil and lubricant analysis: evolution and integration of analytical methodologies. Food Anal. Meth. 1, 153–163. http://dx.doi.org/10.1007/s12161-008-9031-6 |
| ○ |
van de Voort FR, Ismail AA, Sedman J, Dubois J, Nicodemo T. 1994. The determination of peroxide value by Fourier transform
infrared spectroscopy. J. Am. Oil Chem. Soc. 71, 921–926. http://dx.doi.org/10.1007/BF02542254 |
| ○ |
van de Voort FR, Sedman J, Sherazi STH. 2008. Correcting for underlying absorption interferences in Fourier transform infrared
trans analysis of edible oils using two-dimensional correlation techniques. J. Agric. Food Chem. 56, 1532–1537. http://dx.doi.org/10.1021/jf0725068 |
| ○ |
Velasco, J, Dobarganes, MC. 2002. Oxidative stability of virgin olive oil. Eur. J. Lipid Sci. Technol. 104, 661–676. http://dx.doi.org/10.1002/1438-9312(200210)104:9/10<661::AID-EJLT661>3.0.CO;2-D.
|
| ○ |
Velasco J, Marmesat S, Márquez-Ruiz G, Dobarganes MC. 2004. Formation of short-chain glycerol-bound oxidation products and
oxidised monomeric triacylglycerols during deep-frying and occurrence in used frying fats. Eur. J. Lipid Sci. Technol. 106, 728–735. http://dx.doi.org/10.1002/ejlt.200401032 |
| ○ |
Yu X, van de Voort FR, Sedman J. 2007. Determination of peroxide value of edible oils by FTIR spectroscopy with the use of
the spectral reconstitution technique. Talanta 74, 241–246. http://dx.doi.org/10.1016/j.talanta.2007.06.004 |
| ○ |
Zhang Q, Saleh ASM, Chen J, Shen Q. 2012. Chemical alterations taken place during deep-fat frying based on certain reaction
products: A review. Chem. Phys. Lipids 165, 662–681. http://dx.doi.org/10.1016/j.chemphyslip.2012.07.002 |
| ○ |
Zamora R, Gómez G, Dobarganes MC, Hidalgo FJ. 2002a. Oil fractionation as a preliminary step in the characterization of vegetable
oils by high-resolution 13C NMR spectroscopy. J. Am. Oil Chem. Soc. 79, 261–266. http://dx.doi.org/10.1007/s11746-002-0472-z |
| ○ |
Zamora R, Gómez G, Hidalgo FJ. 2002b. Classification of vegetable oils by high-resolution 13C NMR spectroscopy using chromatographically obtained oil fractions. J. Am. Oil Chem. Soc. 79, 267–272. http://dx.doi.org/10.1007/s11746-002-0472-z |