A comparative study of the fatty acid profiles in commercial sheep cheeses
C. Aguilar1, P. Toro-Mujica1, E. Vargas-Bello-Pérez1,*, R. Vera1, C. Ugalde1, S. Rodríguez1 and I. Briones2
1Departamento de Ciencias Animales, Facultad de Agronomía e Ingeniería Forestal, Pontificia Universidad Católica de Chile, Santiago, Chile. Casilla-306. P. O. Box 6904411
2Fondo para la Innovación Agraria, Ministerio de Agricultura, Loreley 1582, La Reina, Santiago, Chile
*Corresponding author: evargasb@uc.cl.
| |
SUMMARY
The present study was carried out to characterize the FA profile of sheep cheese marketed in Chile. Fifty-eight cheeses were
collected from supermarkets of 5 different Chilean cities including 34 sheep cheeses, 7 from goat's milk, 11 from cow's milk,
4 from a mixture of sheep, goat and cow's milk and 2 from a mixture of sheep and cow's milk. Compared to the cow and goat
cheese (3.4 and 2.5 g·100g−1), the sheep cheese (3.8 g·100g−1) contained higher contents of C18:1t. The saturated and polyunsatured FA contents were greater in goat cheese than in sheep
and cow cheese. The n6/n3 ratio was greater in goat (6.1) cheese than in sheep and cow cheese (3.8 and 5.2). The atherogenicity
index was unaffected by cheese type, however, the thrombogenic index was lower in sheep cheese (2.8) than in goat and cow
cheese (3.1 and 2.9). The n6/n3 ratio and thrombogenic index were lower in Chilean sheep cheese than in those imported from
Europe. The fatty acid profile of cheese can be used to differentiate animal species from which the cheese is made and to
some extent the geographical origin that may give some insight as to animal feed and production management.
|
| |
RESUMEN
Estudio comparativo del perfil de ácidos grasos de quesos de oveja comerciales. Este estudio fue llevado a cabo para caracterizar el perfil de AG de quesos de oveja que se comercializan en Chile. Cincuenta
y ocho quesos fueron recogidos de supermercados de 5 ciudades de Chile de los cuales 34 fueron de oveja, 7 de cabra, 11 de
vaca, 4 de mezcla de leche de oveja, cabra y vaca y 2 de mezcla de leche de oveja y vaca. Comparado con quesos de vaca y cabra
(3.4 y 2.5 g·100g−1), los quesos de oveja (3.8 g·100g−1) presentaron mayor contenido de C18:1t. Los AG saturados y poliinsaturados tuvieron concentraciones más altas en los quesos
de cabra que en los quesos de oveja y vaca. La relación n6/n3 fue más alta en quesos de cabra (6.1) que en quesos de oveja
y vaca (3.8 y 5.2). El índice aterogénico no fue afectado por el tipo de queso, sin embargo, el índice trombogénico fue menor
en quesos de oveja (2.8) que en quesos de cabra y vaca (3.8 y 5.2). La relación n6/n3 y el índice trombogénico fueron menores
en quesos chilenos que en quesos importados de Europa. El perfil de AG de quesos puede ser usado para diferenciar entre especies
animales de las cuales proviene el queso y hasta cierto grado, el origen geográfico, ofreciendo indicios sobre el tipo de
alimento y sistema productivo animal del cual provienen los quesos.
|
1. INTRODUCTIONTOP
In Chile there has been a significant growth in cheese production (ODEPA, 2012) and at the same time, there has been an incipient market for sheep cheese because it is considered a gourmet product whose
production is expected to increase in the forthcoming years. In Chile, cardiovascular diseases are the leading cause of death
among adults and the prevalence of cardiovascular risk factors is similar to that of European and North American populations
(Bunout and Escobar, 2000). In the last decade, consumers have become more concerned about the fat content of dairy products and this has led to the
development of different nutritional strategies to improve the FA composition of dairy products such as cheese (Vera et al., 2009; Toro-Mujica et al., 2011). Producing cheese with an improved fatty acid (FA) composition could significantly increase economic returns to farmers
(Vera et al., 2009). Ruminant cheeses have some FA that have beneficial effects on human health such as vaccenic (VA; C18:1t11) and conjugated
linoleic acids (CLA; C18:2 c9, t11) (Aldai et al., 2013). It has been demonstrated that the modulation of dairy ewe diets (Vargas-Bello-Pérez et al., 2013 a,b) results in sheep cheese with reduced atherogenic and thrombogenic indices and low saturated FA contents.
The milk fatty acid profile of ruminants can be affected by different factors such as animal species, lactation stages, feeding,
and genetics (Vargas-Bello-Pérez and Garnsworthy, 2013). Cheese fat from dairy ewes is characterized by high concentrations of FA made-up with 6–10 atoms of carbon (Partidário et al., 2008). Also, compared to bovines and goats, the CLA contents in sheep milk are greater (Shingfield et al., 2010).
Given that sheep cheese has fatty acids that may have positive effects on human health and its production could signify economic
profits, the objective of the present study is to analyze the FA profile of commercial sheep cheese in Chile. The results
could become the basis for developing benchmarking tools and strategies aiming at improving the nutritional characteristics of sheep cheese.
2. MATERIALS AND METHODSTOP
2.1. Cheese samplesTOP
Fifty-eight cheeses were collected from supermarkets of 5 different Chilean cities (Santiago, Rancagua, Melipilla, Viña del
Mar and Puerto Natales) including 34 sheep cheeses, 7 from goat's milk, 11 from cow's milk, 4 from a mixture of sheep, goat
and cow's milk and 2 from a mixture of sheep and cow's milk. The sheep cheeses were produced in Chile (23 cheeses) and imported
from France (2 cheeses) and Spain (9 cheeses). After collection, the cheeses were cut in four sections at which time two cores
of each cheese were obtained and stored in re-sealable bags at –80 °C for one month until further analysis.
2.2. Fatty acid analysisTOP
Two cores of each cheese were used for the FA analysis. The lipids from the cheese were extracted according to a chloroform/methanol
(2:1, v/v) by Folch et al. (1957) method and methylated with the modifications of Sukhija and Palmquist (1988) using hexane as an organic solvent instead of benzene. Analyses of fatty acid methyl esters (FAME) were performed using
a gas chromatograph (GC; Shimadzu Scientific Instruments AOC-20s, Columbia, MD, USA) equipped with a flame ionization detector,
an autoinjector and an Rtx column (30 m × 0.32 mm × 0.20 μm column). The GC conditions were similar to those reported by Vargas-Bello-Pérez et al. (2013b). FA peaks were identified by using two FAME standards (GLC 60; Nu-Check-Prep, Elysan, MN, USA), and the Food Industry 37
FAME mix, 35077 Restek Co, Bellefonte, PA, USA). C18:1 trans isomers were detected by comparing retention times as reported by Ledoux et al. (2000).
2.3. Statistical analysisTOP
The samples were assigned to four groups: cow, sheep, goat and mixtures. The samples were analyzed using ANOVA and multiple
comparisons of means. In order to determine which FA was responsible for the differentiation between cheeses that were made
from different animal species and geographical origin a multivariate analysis was carried out using a correlation matrix between
individual FA to discard those that showed very high correlations (r = >0.9) as well as those without correlations. Bartlett's
test of sphericity was applied to examine the hypothesis that the variables were uncorrelated in the population and the Kaiser-Meyer-Olkin
index was used to measure sampling adequacy. Hierarchical clustering was then performed and a discriminant analysis was used
to verify the extent to which samples were correctly assigned to the clusters identified in the previous analysis. To check
for possible differences among cheeses associated with country of origin (Chile, Spain and France) an individual analysis
of variance and multiple means comparison were performed. The SPSS statistical software for Windows was used (version 15.0.0;
SPSS Inc., Chicago IL, USA).
3. RESULTS AND DISCUSSIONTOP
3.1. Fatty acid profile of cheesesTOP
From the cheese samples analyzed, only C17:0 was not different among animal species (Table 1). Regardless of cheese type, C10:0, C14:0, C16:0, C18:0, C18:1 t11 and C18:1c9 represented around 78% of the total FA, and
these results agree with those reported previously (Partidário et al., 2008; Walther et al., 2008). As reported by Park et al. (2007), sheep and goat cheese contained higher contents of caproic (C6:0), caprylic (C8:0), capric (C10:0) and lauric (C12:0) acids
than cow cheese. Fatty acids which are formed by 4 to 14 carbons arise chiefly from de novo synthesis whereas FAs with more than 16 carbons are derived from the uptake of circulating lipids. Ruminants utilize acetate
produced by the ruminal fermentation of carbohydrates (contained in dietary fiber) as the major carbon source (Bauman and Griinari, 2003). Fatty acids with less than 12 carbons are associated with the typical flavors of small ruminant cheese and can also be
used to detect mixtures of milk from different species (Park et al., 2007).
Table 1. Fatty acid profile (mean ± standard deviation) of cheese from different animal species (g·100g−1 of total FAME)
| Fatty acid |
Cow (n = 11) |
Sheep (n = 34) |
Goat (n = 7) |
Mixture (n = 6) |
P-value |
| C4:0 |
1.32±0.15c |
1.18±0.17b |
1.01±0.07a |
1.18±0.07b |
0.001 |
| C6:0 |
1.08±0.05a |
1.36±0.19bc |
1.44±0.11c |
1.21±0.11ab |
<0.001 |
| C8:0 |
0.81±0.05a |
1.62±0.29c |
2.06±0.24d |
1.29±0.25b |
<0.001 |
| C10:0 |
2.17±0.23a |
5.92±1.06c |
8.44±1.22d |
4.47±1.07b |
<0.001 |
| C12:0 |
2.93±0.38a |
3.99±0.59b |
4.46±0.82b |
3.18±0.54a |
<0.001 |
| C14:0 |
11.1±0.62ab |
11.43±1.15b |
10.53±0.82a |
10.23±1.01a |
0.028 |
| C14:1c9 |
1.62±0.17c |
0.84±0.13b |
0.49±0.04a |
0.91±0.22b |
<0.001 |
| C15:0 |
1.35±0.25b |
1.34±0.25b |
1.01±0.12a |
1.05±0.21a |
0.001 |
| C16:0 |
31.84±3.08b |
28.55±2.33a |
29.88±1.1ab |
30.9±1.87b |
<0.001 |
| C16:1c9 |
2.01±0.14c |
1.4±0.39b |
0.74±0.25a |
1.37±0.36b |
<0.001 |
| C17:0 |
0.73±0.12 |
0.76±0.14 |
0.69±0.10 |
0.69±0.17 |
0.418 |
| C17:1n3(c10) |
0.34±0.05b |
0.36±0.07ab |
0.29±0.07a |
0.32±0.07ab |
0.047 |
| C18:0 |
12.12±1.39ab |
11.64±1.91ab |
11.08±1.33a |
13.12±1.53b |
0.159 |
| C18:1t |
3.36±1.65ab |
3.77±1.21b |
2.47±1.26a |
2.7±0.65ab |
0.050 |
| C18:1n9c |
22.52±1.52b |
19.64±1.92a |
19.75±2.93a |
22.68±1.35b |
<0.001 |
| C18:2n6(t9,12) |
0.41±0.07a |
0.58±0.13b |
0.52±0.23ab |
0.41±0.10a |
0.001 |
| C18:2n6(c9,12) |
2.15±0.41a |
2.22±0.42a |
3.22±0.43b |
2.2±0.33a |
<0.001 |
| C18:3n6(c6,9,12) |
0.06±0.07a |
0.34±0.07c |
0.24±0.07b |
0.29±0.08bc |
<0.001 |
| C18:3n3(c9,12,15) |
0.63±0.27a |
0.96±0.34b |
0.77±0.47ab |
0.55±0.33a |
0.009 |
| C20:1n9(c11) |
1.26±0.67ab |
1.49±0.59b |
0.74±0.29a |
0.86±0.29a |
0.005 |
| Others |
0.95±0.15a |
0.6±0.24b |
0.18±0.10a |
0.39±0.11a |
<0.001 |
| Short chain FA |
2.40±0.15 |
2.53±0.33 |
2.44±0.15 |
2.39±0.05 |
0.434 |
| Medium chain FA |
5.91±0.65a |
11.53±1.89c |
14.96±2.06d |
8.93±1.75b |
<0.001 |
| Short + medium chain FA |
5.39±0.29a |
8.14±1.34b |
10.07±1.62c |
12.94±1.53d |
<0.010 |
| Long chain FA |
57.13±2.23b |
53.72±1.83a |
53.19±1.21a |
55.99±1.63b |
<0.001 |
| Saturated FA |
65.45±2.57a |
67.78±2.14b |
70.6±1.84c |
67.32±2.09ab |
<0.001 |
| Monounsaturated FA |
31.11±2.61c |
27.51±1.93b |
24.47±2.2a |
28.83±1.85b |
<0.001 |
| Polyunsaturated FA |
3.25±0.28a |
4.11±0.61b |
4.75±0.77c |
3.45±0.51a |
0.009 |
| PUFA n3 |
0.63±0.27a |
0.96±0.34b |
0.77±0.47ab |
0.55±0.33a |
<0.001 |
| PUFA n6 |
2.62±0.43a |
3.15±0.49b |
3.98±0.46c |
2.9±0.37ab |
<0.001 |
| PUFA n6/ PUFA n3 |
5.17±2.82ab |
3.79±1.81a |
6.09±1.79b |
6.45±2.78b |
<0.007 |
| PUFA/SFA |
0.049±0.005a |
0.061±0.009b |
0.067±0.011b |
0.051±0.009a |
<0.001 |
| Atherogenicity index1 |
2.33±0.35 |
2.49±0.35 |
2.63±0.29 |
2.34±0.32 |
0.226 |
| Thrombogenic index2 |
2.94±0.44ab |
2.81±0.28a |
3.1±0.28b |
3.09±0.34ab |
0.070 |
| Short-chain FA = C4:0-C6:0; Medium-chain FA = C8:0-C12:0; Short- + medium- chain FA = C4:0-C10:0; Long-chain FA = ≥C14:0; |
| a,b,c Means in the same row with different superscripts are different (P<0.05). |
| 1Atherogenicity index = [(12:0 + 4(14:0) + 16:0] / [(n6 + n3) PUFA + 18:1 + ΣMUFA] (Ulbricht and Southgate, 1991); |
| 2Thrombogenic index = (14:0 + 16:0 + 18:0) / [(0.5×18:1) + 0.5(ΣMUFA) + 0.5(n6PUFA) + 3(n3PUFA) + (n3PUFA/n6PUFA)] (Ulbricht
and Southgate, 1991). |
Compared with cow and goat, sheep cheese had higher contents of C18:1 trans isomers. In ruminant fat, vaccenic acid (VA; C18:1 t11) is the most common C18:1 trans isomer accounting for 60 to 80% of the total trans FA (Vargas-Bello-Pérez and Garnsworthy, 2013). VA can be converted to C18:2 c9, t11 (rumenic acid; RA) through the action of stearoyl coenzyme A desaturase and it has
been estimated that 20% of VA can be converted to RA in humans. The RA has been identified as anti-carcinogenic, anti-atherosclerotic,
antioxidant, and immunomodulator (Young et al., 2013). The C18:1 trans isomer contents in sheep cheese are similar to those reported in Italian (Nudda et al., 2005) and Spanish (Luna et al., 2005) cheeses. This may be due to the feeding practices.It is possible that those cheeses came from farms where the sheep were
fed with fresh pastures or supplemented with oilseeds. When pasture inclusion increases in the total diet, linear increases
in C18:3n3, C18:1 t11 and C18:2 c9t11 and decreases in C10:0–C16:0 are observed (Chilliard et al., 2007). On the other hand, oilseeds are rich sources of polyunsaturated fatty acids (PUFA), which, after being biohydrogenated
in the rumen, can increase the concentrations of health promoting FA such as linolenic (C18:3n3) and rumenic acids (Zhang
et al., 2006).
Interestingly, the C18:1 trans isomers and C18:3n3 contents were higher in Chilean sheep cheese than in the French and Spanish cheese (Table 2). As mentioned before, those FA can be improved when the ewe diet is based mostly on pastures. In Chile, sheep production
is based largely on grazing systems, however, in Spain for example, sheep cheese is produced throughout the year leading to
an intensification of reproductive management, and a reduction in grazing periods (Riedel et al., 2007). This type of system results in a substitution of on-farm natural resources (forages and pastures) with external inputs
(conserved forages and concentrates) (Vera et al., 2009). No differences were observed between French and Spanish sheep cheese so it is possible that these countries have similar
conditions among their production systems including feeding, breeds and level of intensification of farm management (Riedel
et al., 2007).
Table 2. Fatty acid profile (mean ± standard deviation) of sheep cheese from different geographical origins (g·100g−1 of total FAME)
| Fatty acid |
Chile (n=23) |
France (n=2) |
Spain (n=9) |
P-value |
| C4:0 |
1.09±0.16a |
1.18±0.19ab |
1.32±0.10b |
0.003 |
| C6:0 |
1.3±0.21a |
1.54±0.10a |
1.42±0.13a |
0.122 |
| C8:0 |
1.53±0.31 |
1.94±0.19 |
1.7±0.19 |
0.087 |
| C10:0 |
5.61±1.13 |
7.15±0.29 |
6.23±0.71 |
0.072 |
| C12:0 |
3.84±0.60 |
4.67±0.07 |
4.13±0.45 |
0.090 |
| C14:0 |
11.6±1.25 |
11.81±0.10 |
10.85±0.64 |
0.215 |
| C14:1c9 |
0.92±0.09b |
0.69±0.01a |
0.7±0.06a |
<0.001 |
| C15:0 |
1.46±0.21b |
1.08±0.01a |
1.09±0.08a |
<0.001 |
| C16:0 |
28.88±2.79 |
28.25±0.55 |
27.8±1.20 |
0.527 |
| C16:1c9 |
1.52±0.40 |
1.3±0.02 |
1.19±0.27 |
0.090 |
| C17:0 |
0.8±0.15b |
0.66±0.02ab |
0.67±0.04a |
0.037 |
| C17:1n3(c10) |
0.39±0.07b |
0.29±0.04a |
0.30±0.02a |
0.001 |
| C18:0 |
11.14±2.09 |
12±0.47 |
12.81±1.22 |
0.093 |
| C18:1t |
4.26±1.18b |
2.84±0.48ab |
2.95±0.59a |
0.007 |
| C18:1n9c |
19.1±1.89a |
19.27±0.07ab |
21.38±1.14b |
0.007 |
| C18:2n6(t9,12) |
0.59±0.10 |
0.41±0.08 |
0.56±0.12 |
0.075 |
| C18:2n6(c9,12) |
1.98±0.26a |
2.46±0.05b |
2.69±0.29b |
<0.001 |
| C18:3n6(c6,9,12) |
0.34±0.08 |
0.3±0.03 |
0.35±0.05 |
0.628 |
| C18:3n3(c9,12,15) |
1.1±0.25b |
0.78±0.09ab |
0.59±0.14a |
<0.001 |
| C20:1n9(c11) |
1.86±0.42b |
0.93±0.19a |
0.83±0.15a |
<0.001 |
| Others |
0.68±0.24b |
0.48±0.05ab |
0.43±0.13a |
0.014 |
| Short chain FA |
2.39±0.33a |
2.72±0.08ab |
2.74±0.23a |
0.019 |
| Medium chain FA |
10.98±1.97 |
13.76±0.55 |
12.05±1.33 |
0.070 |
| Short + medium chain FA |
9.54±1.7 |
10.67±1.09 |
11.81±0.4 |
0.050 |
| Long chain FA |
53.88±2.03 |
53.8±1.15 |
53.22±1.49 |
0.676 |
| Saturated FA |
67.25±2.15 |
70.27±0.68 |
68.01±1.21 |
0.097 |
| Monounsaturated FA |
28.05±1.93 |
25.30±0.63 |
27.37±1.06 |
0.091 |
| Polyunsaturated FA |
4.02±0.57 |
3.95±0.10 |
4.2±0.48 |
0.678 |
| PUFA n3 |
1.09±0.25b |
0.78±0.10ab |
0.59±0.14b |
<0.001 |
| PUFA n6 |
2.92±0.36a |
3.17±0.03ab |
3.61±0.37b |
<0.001 |
| PUFA n6/ PUFA n3 |
2.76±0.61a |
4.1±0.51b |
6.41±1.27c |
<0.001 |
| PUFA/SFA |
0.059±0.009 |
0.056±0.002 |
0.062±0.008 |
0.703 |
| Atherogenicity index1 |
2.49±0.37 |
2.74±0.1 |
2.39±0.17 |
0.380 |
| Thrombogenic index2 |
2.71±0.25a |
3.09±0.18b |
2.96±0.19b |
0.019 |
| Short-chain FA = C4:0-C6:0; Medium-chain FA = C8:0-C12:0; Short- + medium- chain FA = C4:0-C10:0; Long-chain FA = ≥C14:0; |
| a,b,cMeans in the same row with different superscripts are different (P<0.05). |
| 1Atherogenicity index = [(12:0 + 4(14:0) + 16:0] / [(n6+n3)PUFA + 18:1 + ΣMUFA] (Ulbricht and Southgate, 1991); |
| 2Thrombogenic index = (14:0 + 16:0 + 18:0) / [(0.5×18:1) + 0.5(ΣMUFA) + 0.5(n6PUFA) + 3(n3PUFA) + (n3PUFA/n6PUFA)] (Ulbricht
and Southgate, 1991). |
3.2. Nutritional value of total lipids in cheesesTOP
Nutritional recommendations are based on different ratios such as PUFA n6/ PUFA n3 and PUFA/SFA; these values are used to
evaluate the nutritional value of fat for human consumption. The values for PUFA/SFA found in our cheese samples were below
the recommended amount (above 0.45) for the human diet whereas only the values for sheep cheese were below the recommended
level (less than 4.0) for the PUFA n6/PUFA n3 ratio (British Department of Health, 1994). Compared to cow and goat, sheep cheese had a lower thrombogenic index and intermediate concentrations of SFA, MUFA and
PUFA (Table 1). Saturated FA are known to increase the risk of coronary heart disease (CHD; Williams et al., 2000), on the contrary, milk MUFA and PUFA (e.g., C18:2 c9, t11) can reduce the risk of CHD and prevent some types of cancer (Mohammadzadeh
et al., 2013). However, there is a lack of scientific evidence that other SFA such as C4:0-C10:0 (short- and medium- chain FA; SMFA) have
an effect on blood cholesterol and CHD risk (Astrup et al., 2011). In this study, compared to cow and sheep, goat cheese had higher contents of SMFA.
From the human health perspective, in this study, Chilean sheep cheese could be considered healthier than those imported from
Europe; this is supported by the higher PUFA n3 and lower PUFA n6 contents (consequently lower PUFA n6/ PUFA n3 ratio) found
in the Chilean sheep cheese (Table 2). The PUFA n3 play an important role in the prevention and control of coronary artery disease, hypertension, diabetes, arthritis,
autoimmune disorders and cancer (Simopoulos, 2000).
3.3. Multivariate analysisTOP
The correlation matrix of FA discarded C4:0, C6:0, C18:0 and C20:1n9 (c11). The principal component analysis (PCA) carried
out on the 16 remaining FA resulted in 4 principal components (PCs) which explained 0.84 of the overall variance in the data.
PC1 and PC2 explained 0.34 and 0.28 of the variation in FA contents (Table 3). The KMO index was 0.62, whereas the Bartlett's test of sphericity showed the suitability (P<0.001) of those variables selected
for analysis.
Table 3. Principal component (PC) analysis related to the fatty acid profile of cheese
| PC |
Eigenvalue |
Variables |
Correlation |
| 1 |
5,1 |
C8:0 |
0,90 |
|
33,71 |
C10:0 |
0,92 |
|
(33,7)2 |
C14:1c9 |
−0,94 |
|
|
C16:1c9 |
−0,85 |
| 2 |
4,1 |
C16:0 |
−0,67 |
|
27,5 |
C18:1t |
0,92 |
|
(61,2) |
C18:2n6(t9,12) |
0,72 |
|
|
C18:3n3(c9,12,15) |
0,76 |
| 3 |
2,0 |
C15:0 |
0,74 |
|
13,1 |
C17:0 |
0,88 |
|
(74,3) |
C17:1n3(c10) |
0,91 |
| 4 |
1,4 |
C14:0 |
0,93 |
|
9,3 |
C18:1n9c |
−0,81 |
|
(83,6) |
|
|
1Proportion of variance explained;
2Variance accumulated. |
Three groups were found after PCA was carried out in order to obtain data clusters related to the fatty acid profiles of the
cheeses. Group I was formed by 26 samples from which 23 were Chilean sheep cheeses, 2 were Chilean mixture cheeses (90% sheep
and 10% cow milk) and 1 Chilean goat cheese. Group II was composed of 13 samples from which 11 were Chilean cow cheeses and
2 were Spanish mixture cheeses (proportion of milks was not found in the label). Finally, Group III was formed by 19 samples
from which 9 were Spanish sheep cheeses, 2 were French sheep cheeses, 2 were Spanish mixture cheeses and 6 were Chilean goat
cheeses.
PC1 consisted of the typical FA that can be found in the milk of small ruminants (C8:0 and C10:0) (Partidário et al., 2008) whereas C14:1c9 and C16:1c9 are usually detected in the milk and cheeses of cows (O'Donnell et al., 2010). Figure 1 shows a clear difference among animal species particularly between Groups I and II. PC2 comprised C16:0, C18:1t, C18:3n3
and C18:2n6, and therefore, the cheese in this PC may have a high MUFA/SFA ratio. Group I (mainly Chilean cheeses) had higher
proportions of these FA.
|
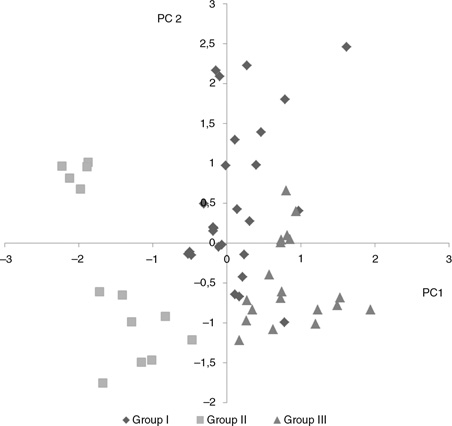 Figure 1. Positioning of the cheeses according to the scores obtained for PC 1 and PC 2. Figure 1. Positioning of the cheeses according to the scores obtained for PC 1 and PC 2.
Three groups were found after PCA was carried out in order to obtain data clusters related to the fatty acid profiles of the cheese. Group I: 26 samples from which 23 were Chilean sheep cheeses, 2 were Chilean mixture cheeses (90% sheep and 10% cow milk) and 1 Chilean goat cheese. Group II: 13 samples from which 11 were Chilean cow cheeses and 2 were Spanish mixture cheeses (proportion of milks was not found in the label). Group III: 19 samples from which 9 were Spanish sheep cheeses, 2 were French sheep cheeses, 2 were Spanish mixture cheeses and 6 were Chilean goat cheeses.
|
|
The different data clusters obtained in this study showed that some FA vary depending on animal species, however, there are
some confounding factors related to the type of feed, production system and breed of animals (Carta et al., 2008). For example, in Group III, where most of the European cheeses were grouped, most of the production systems may be intensive
and their feeding management relies on high-concentrate diets (Sanz Sampelayo et al., 2007). These particular characteristics of production systems, animals, feedstuffs, etc., are closely related to the organoleptic
characteristics of cheese that lead to the creation of the Protected Denomination of Origin (PDO) or Protected Geographical
Identification (PGI) regimes (Martínez et al., 2011) and therefore become useful tools for creating strategies aiming at improving the nutritional characteristics of sheep cheese
in Chile.
4. CONCLUSIONSTOP
The results indicated that the FA profiles of Chilean cheese were desirable from a human health standpoint. The fatty acid
profile of cheese can be used to differentiate the animal species from which the cheese is made and to some extent the geographical
origin that may give some insights into animal feed and production management. The data from this study could be used to develop
benchmark tools and strategies aiming at improving the nutritional characteristics of sheep cheese.
ACKOWLEDGEMENTSTOP
This study was supported by a research grant from FIA PYT-2008-0213 (Fondo de Innovación Agraria, Ministerio de Agricultura,
Chile).
REFERENCESTOP
| ○ |
Aldai N, de Renobales M, Barron LJR, Kramer JKG. 2013. What are the trans fatty acids issues in foods after discontinuation
of industrially produced trans fats? Ruminant products, vegetable oils, and synthetic supplements. Eur. J. Lipid Sci. Tech.
115, 1378–1401. http://dx.doi.org/10.1002/ejlt.201370029.
|
| ○ |
Astrup A, Dyerberg J, Elwood P, Hermansen K, Hu FB, Jakobsen MU, Kok FJ, Krauss RM, Lecerf JM, LeGrand P, Nestel P, Riserus
U, Sanders T, Sinclair A, Stender S, Tholstrup T, Willett WC. 2011. The role of reducing intakes of saturated fat in the prevention
of cardiovascular disease: where does the evidence stand in 2010? Am. J. Clin. Nutr.
93: 684–688. http://dx.doi.org/10.3945/ajcn.110.004622.
|
| ○ |
Bauman DE, Griinari JM. 2003. Nutritional regulation of milk fat synthesis. Annu. Rev. Nutr.
23, 203–227. http://dx.doi.org/10.1146/annurev.nutr.23.011702.073408.
|
| ○ |
British Department of Health. 1994. Nutritional aspects of cardiovascular disease. Report on Health and Social Subjects N°
46, HMSO, London, UK, 1994.
|
| ○ |
Bunout D, Escobar E. 2000. Prevención de enfermedades cardiovasculares: ¿deben aplicarse los mismos criterios en América Latina
que en Europa y Norte América? Rev. Esp. Cardiol.
53, 889–895. |
| ○ |
Carta A, Casu S, Usai MG, Addis M, Fiori M, Fraghí A, Miari S, Mura L, Piredda G, Schibler L, Sechi T, Elsen JM, Barillet
F. 2008. Investigating the genetic component of fatty acid content in sheep milk. Small Ruminant Res.
79, 22–28. http://dx.doi.org/10.1016/j.smallrumres.2008.07.015.
|
| ○ |
Chilliard Y, Glasser F, Ferlay A, Bernard L, Rouel J, Doreau M. 2007. Diet, rumen biohydrogenation and nutritional quality
of cow and goat milk fat. Eur. J. Lipid Sci. Technol.
109, 828–855. http://dx.doi.org/10.1002/ejlt.200700080.
|
| ○ |
Folch J, Lees M, Sloane-Stanley GH. 1957. A simple method for the isolation and purification of total lipids from animal tissues.
J. Biol. Chem.
226, 497–509. PMid:13428781.
|
| ○ |
Ledoux M, Laloux L, Wolff RL. 2000. Analytical methods for determination of trans-C18 fatty acid isomers in milk fat. A review.
Analusis,
28, 402–412. http://dx.doi.org/10.1051/analusis:2000125.
|
| ○ |
Luna P, Fontecha J, Juarez M, de la Fuente MA. 2005. Changes in the milk and cheese fat composition of ewes fed commercial
supplements containing linseed with special reference to the CLA content and isomer composition. Lipids
40, 445–454. http://dx.doi.org/10.1007/s11745-005-1403-3.
|
| ○ |
Martínez S, Franco I, Carballo J. 2011. Spanish goat and sheep milk cheeses. Small Ruminant Res.
101, 41–54. http://dx.doi.org/10.1016/j.smallrumres.2011.09.024.
|
| ○ |
Mohammadzadeh M, Faramarzi E, Mahdavi R, Nasirimotlagh B, Jafarabadi MA. 2013. Effect of conjugated linoleic acid supplementation
on inflammatory factors and matrix metalloproteinase enzymes in rectal cancer patients undergoing chemoradiotherapy. Integr. Cancer Ther.
12, 496–502. http://dx.doi.org/10.1177/1534735413485417.
|
| ○ |
Nudda A, McGuire MA, Battacone G, Pulina G. 2005. Seasonal variation in conjugated linoleic acid and vaccenic acid in milk
fat of sheep and its transfer to cheese and ricotta. J Dairy Sci.
88, 1311–1319. http://dx.doi.org/10.3168/jds.S0022-0302(05)72797-1.
|
| ○ |
O'Donnell AM, Spatny KP, Vicini JL, Bauman DE. 2010. Survey of the fatty acid composition of retail milk differing in label
claims based on production management practices. J Dairy Sci.
93, 1918–1925. http://dx.doi.org/10.3168/jds.2009-2799.
|
| ○ |
Office of Agrarian Studies and Policies (ODEPA). 2012. Estadísticas /por macro rubros/ lácteas. available at: http://www.odepa.gob.cl/jsp/lacteos/seil/seil_i5trp_enc.jsp. (accessed 10 December 2012).
|
| ○ |
Park YW, Juárez M, Ramos M, Haenlein GFW. 2007. Physico-chemical characteristics of goat and sheep milk. Small Ruminant Res.
68, 88–113. http://dx.doi.org/10.1016/j.smallrumres.2006.09.013.
|
| ○ |
Partidário AM, Ribeiro JCS, Prates JAM. 2008. Fatty acid composition and nutritional value of fat in three PDO ewe's milk
Portuguese cheeses. Dairy Sci. Technol.
88, 683–694. http://dx.doi.org/10.1051/dst:2008032.
|
| ○ |
Riedel JL, Casasus I, Bernues A. 2007. Sheep farming intensification and utilization of natural resources in a Mediterranean
pastoral agro-ecosystem. Livest. Sci.
111, 153–163. http://dx.doi.org/10.1016/j.livsci.2006.12.013.
|
| ○ |
Sanz Sampelayo MR, Chilliard Y, Schmidely P, Boza J. 2007. Influence of type of diet on the fat constituents of goat and sheep
milk. Small Ruminant Res.
68, 42–63. http://dx.doi.org/10.1016/j.smallrumres.2006.09.017.
|
| ○ |
Shingfield KJ, Bernard L, Leroux C, Chilliard Y. 2010. Role of trans fatty acids in the nutritional regulation of mammary
lipogenesis in ruminants. Animal
4, 1140–1166. http://dx.doi.org/10.1017/S1751731110000510.
|
| ○ |
Simopoulos AP. 2000. Human requirement for n-3 polyunsaturated fatty acids. Poultry Sci.
79, 961–970. http://dx.doi.org/10.1093/ps/79.7.961.
|
| ○ |
Sukhija PS, Palmquist DL. 1988. Rapid method for determination of total fatty-acid content and composition of feedstuffs and
feces. J. Agric. Food Chem.
36, 1202–1206. http://dx.doi.org/10.1021/jf00084a019.
|
| ○ |
Toro-Mujica P, García A, Gómez-Castro AG, Acero R, Perea J, Rodríguez-Estévez V, Aguilar C, Vera R. 2011. Technical efficiency
and viability of organic dairy sheep farming systems in a traditional area for sheep production in Spain. Small Ruminant Res.
100, 89–95. http://dx.doi.org/10.1016/j.smallrumres.2011.06.008.
|
| ○ |
Ulbricht TLV, Southgate DAT. 1991. Coronary Heart-Disease -7 Dietary Factors. Lancet
338, 985–992. http://dx.doi.org/10.1016/0140-6736(91)91846-M.
|
| ○ |
Vargas-Bello-Pérez E, Vera R, Aguilar C, Lira R, Peña I, Fernández J. 2013a. Feeding olive cake to ewes improves fatty acid
profile of milk and cheese. Anim. Feed Sci. Tech.
184, 94–99. http://dx.doi.org/10.1016/j.anifeedsci.2013.05.016.
|
| ○ |
Vargas-Bello-Pérez E, Vera R, Aguilar C, Lira R, Peña I, Valenzuela A, Cerda H. 2013b. Effect of dietary inclusion of lampante
olive oil on milk and cheese fatty acid profiles of ewes. Grasas Aceites
64, 295–303. http://dx.doi.org/10.3989/gya.108312.
|
| ○ |
Vargas-Bello-Pérez E, Garnsworthy PC. 2013 Trans fatty acids and their role in the milk of dairy cows. Ciencia Inv. Agr.
40, 449–473. http://dx.doi.org/10.4067/S0718-16202013000300001.
|
| ○ |
Vera R, Aguilar C, Lira R. 2009. Differentiation of sheep milk and cheese based on quality and composition. Ciencia Inv. Agr.
36, 307–328. http://dx.doi.org/10.4067/S0718-16202009000300001.
|
| ○ |
Walther B, Schmid A, Sieber R, Wehrmüller K. 2008. Cheese in nutrition and health. Dairy Sci. Technol.
88, 389–405. http://dx.doi.org/10.1051/dst:2008012.
|
| ○ |
Williams CM. 2000. Dietary fatty acids and human health. Ann. Zootech.
49, 165–180. http://dx.doi.org/10.1051/animres:2000116.
|
| ○ |
Young JF, Therkildsen M, Ekstrand B, Che BN, Larsen MK, Oksbjerg N, Stagsted J. 2013. Novel aspects of health promoting compounds
in meat. Meat Sci. 95, 904–911. http://dx.doi.org/10.1016/j.meatsci.2013.04.036.
|
| ○ |
Zhang RH, Mustafa AF, Zhao X. 2006. Effects of feeding oilseeds rich in linoleic and linolenic fatty acids to lactating ewes
on cheese yield and on fatty acid composition of milk and cheese. Anim. Feed Sci. Tech.
127, 220–233. http://dx.doi.org/10.1016/j.anifeedsci.2005.09.001.
|