Comparison of analytical techniques for the determination of the positional distribution of fatty acids in triacylglycerols.
Relationship with pig fat melting point and hardness
J. Seguraa, N. Ruiz-Lópezb,*, D. Menoyob, M.I. Camberoc and C.J. López-Botea
aDepartamento de Producción Animal, Facultad de Veterinaria, Universidad Complutense, 28040 Madrid, Spain
bDepartamento de Producción Animal, Universidad Politécnica de Madrid, 28040 Madrid, Spain
cDepartamento de Nutrición, Bromatología y Tecnología de los Alimentos, Facultad de Veterinaria, Universidad Complutense, 28040 Madrid, Spain
*Corresponding author: noemi.ruiz@ig.csic.es
| |
SUMMARY
This study was conducted to compare two of the most widely used methods for the determination of the positional distribution
of fatty acids within the triacylglycerol molecules from fats of animal origin. Method A involves incubation of the triacylglycerol
fraction with an aqueous suspension of the lipase enzyme, separation of the reaction products by thin-layer chromatography
(TLC), and analysis of fatty acid methyl esters by gas-liquid chromatography. Method B eliminates the need for TLC. This technique
makes use of the fact that methanolic-NaOH methylates only fatty acids esterified to glycerol. Our results demonstrated that
method A data were in line with previous literature. Additionally, method A showed good correlations between fatty acid positional
distribution and fat melting point and hardness. However, method B showed an underestimation of palmitic acid and lacked correlation
with selected physical properties.
|
| |
RESUMEN
Comparación de técnicas analíticas usadas para la determinación de la distribución posicional de ácidos grasos en los triacilglicéridos.
Relación con el punto de fusión y la dureza de la grasa de cerdo. Este estudio se realizó con el objetivo de comparar los dos métodos más comúnmente utilizados en la determinación de la
distribución posicional de ácidos grasos en las moléculas de triacilglicéridos de grasas de origen animal. El método A consiste
en la incubación de los triacilglicéridos en una suspensión acuosa de la enzima lipasa, la separación de los productos por
cromatografía de capa fina (TLC), y el posterior análisis de los ésteres metílicos de ácidos grasos de cada fracción mediante
cromatografía gas-líquido. El método B elimina la separación por TLC. Este método se basa en que la metilación básica (NaOH)
únicamente metila los ácidos grasos esterificados al glicerol. Cuando analizamos grasa subcutánea de cerdo, nuestros resultados
demuestran que los datos obtenidos con el método A estuvieron en concordancia con resultados publicados anteriormente. Además
el método A mostró una buena correlación entre la distribución de los ácidos grasos y el punto de fusión y dureza de las grasas
analizadas. Sin embargo, el método B condujo a una subestimación del ácido palmítico y a resultados carentes de correlación
con las propiedades físicas citadas.
|
1. INTRODUCTIONTOP
Triacylglycerols (TAGs) consist of a glycerol backbone to which three fatty acids (FAs) are esterified. The positions are
numbered by a stereo-chemical numbering system: sn-1-, sn-2- and sn-3 (Figure 1). It is well known that natural TAGs exist in the form of a large number of distinct molecular species. The possible number
of different TAGs (including enantiomers) in a mixture is n3, where n is the number of different FAs. Even considering a fat containing a limited number of FAs (low n); there would be a very large amount of different TAG molecules to analyze.
|
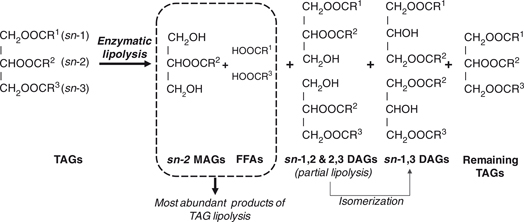 Figure 1. Schematic representation of TAG enzymatic lipolysis and its reaction products. TAG positions are defined by a ‘stereo-specific
numbering’ (sn) system as sn-1, sn-2 and sn-3 where R1, R2, and R3 represent saturated or unsaturated hydrocarbon chains. When TAGs are incubated with a specific lipase and an appropriate
buffer, fatty acids are hydrolyzed from the primary positions leaving 2-monoacylglycerol molecules, which can be isolated
for the determination of its fatty acid composition. Additionally, sn-1,2 and sn-2,3 diacylglycerols resulting from partial TAG lipolysis are also generated. These molecules could be isomerized with the
generation of sn-1,3 diacylglycerols. Abbreviations: DAGs, diacylglycerols; FFA, free fatty acids; MAGs, monoacylglycerols; TAGs, triacylglycerols. Figure 1. Schematic representation of TAG enzymatic lipolysis and its reaction products. TAG positions are defined by a ‘stereo-specific
numbering’ (sn) system as sn-1, sn-2 and sn-3 where R1, R2, and R3 represent saturated or unsaturated hydrocarbon chains. When TAGs are incubated with a specific lipase and an appropriate
buffer, fatty acids are hydrolyzed from the primary positions leaving 2-monoacylglycerol molecules, which can be isolated
for the determination of its fatty acid composition. Additionally, sn-1,2 and sn-2,3 diacylglycerols resulting from partial TAG lipolysis are also generated. These molecules could be isomerized with the
generation of sn-1,3 diacylglycerols. Abbreviations: DAGs, diacylglycerols; FFA, free fatty acids; MAGs, monoacylglycerols; TAGs, triacylglycerols.
|
|
Quantitatively, the TAG fraction constitutes the most important lipid component in meat and meat products. Other minor fat
constituents include phospholipids, free fatty acids, sterols (including cholesterol) and fat-soluble vitamins. Under normal
circumstances, the human digestive system is able to digest TAGs and to absorb them with high efficiency (more than 95%).
It has been proven that dietary FA composition and stereo-specific positioning of these FAs in TAG molecules are important
factors in FA digestion and absorption (Mu and Hoy, 2004). Besides that, the distribution of FAs within the TAG molecules also affects the physical properties of the adipose tissue.
This fact has many technological implications in the processing of meats which are closely linked to the quality features
of final products (Smith et al., 1998). Recent studies have shown that the position of the FAs within the TAG molecule might affect the incidence of illnesses
such as obesity, diabetes or hypertension (Ponnampalam et al., 2011; Gouk et al., 2013) in humans. Hunter (2001) reviewed how the stereo-specific structure of dietary TAGs may affect human lipid metabolism which implies their involvement
in the progress of different cardiovascular diseases.
Although FA positional distribution is a topic of interest in fats from animal origin, little information exists on interventional
studies aimed to alter this distribution. Moreover, marked differences due to diverse analytical methodologies exist, leading
to erratic scientific information on this topic.
Several methods are used for TAG analysis. They can be divided into four categories: enzymatic hydrolysis, chemical, spectroscopic
and spectrometric methods. The enzymatic approaches use lipases which specifically hydrolyze esterified FAs from the sn-1 and sn-3 positions of the TAG glycerol backbone (Figure 1) and are followed by the determination of the FA profile of the residual 2-monoacylglycerol (2-MAG) fraction and/or other
resulting fractions like free fatty acids. The chemical method involves partial deacylation of the TAGs with a Grignard reagent
(Becker et al., 1993). Nuclear Magnetic Resonance (NMR) is the basic spectroscopic way to regiospecifically characterizes FAs (Redden et al., 1996) and HPLC coupled with mass spectrometry (Kuksis and Itabashi, 2005) is the fourth approach to determine the position of FAs into the TAG backbone. Every one of these four methods offers some
advantages and disadvantages. The enzymatic methods are time consuming and they only inform about the FA profiles at the sn-2 and sn-1,3 positions, making it impossible to distinguish between TAG enantiomeric forms. However, the stereochemical distribution
of fatty acids in triacylglycerols has been described by calculating the asymmetric α coefficient from the sn-2 fatty acid, and triacylglycerol composition of the oil (Martínez-Force et al., 2004). This coefficient reflects the relative content of fatty acids at the sn-1 and sn-3 positions. The compositions of positions sn-1 and sn-3 were initially obtained by complex “stereospecific” procedures with many steps involving degradation, synthesis, enzymatic
hydrolysis and chromatographic separation of the products (Brockerhoff, 1965). This α coefficient reflects the relative content of fatty acids at the sn-1 and sn-3 positions. Nowadays, this task has been improved by the development of methods involving chiral chromatography (Christie, 1992). On the other hand, enzymatic methods are relatively simple and non-expensive; additionally they do not need any special
equipment. For these reasons the enzymatic methods are regularly used for the study of the positional distribution of FAs in TAG molecules.
Two enzymatic procedures are extensively used for TAG molecule studies. One of the methods uses the lipase treatment followed
by thin-layer chromatography (TLC) separation of the reaction products and by acid methylation of the 2-MAG fraction (Luddy et al., 1964). The second method is faster and easier to use as it eliminates the separation of the fractions by the TLC used in the standard
technique.
This second method makes use of two different methylation procedures. After lipase reaction, it is possible to determine the
free fatty acids by comparing the FA contents of the two methylation reactions (Williams et al., 1995). The objective of the present study is to compare these two procedures when analyzing pig fat samples.
2. MATERIALS AND METHODSTOP
2.1. MaterialsTOP
All solvents were purchased from Scharlab (Barcelona, Spain) and used as received. All other reagents were purchased by Sigma-Aldrich
(Madrid, Spain) including: Tris/HCl buffer, lipase from porcine pancreas (Type II, 100–500 units/mg protein), lipase from
Rhizopus arrhizus (lyophilized powder, ≥300 units/mg solid), primuline, silica gel TLC plates and sodium deoxycholate.
2.2. Experimental designTOP
Pigs (Landrace × Large White (25% Pietrain)) were randomly selected at 80 kg body weight for the experiment. The pigs were
fed a commercial diet containing 2.41 Mcal·kg−1 Net Energy, 162 g Crude Protein, 37 g·kg−1 Crude Ash. The source of dietary fat was lard (3.2%). The dietary fatty acid composition was 0.97% palmitic acid, 0.43% stearic
acid, 1.64% oleic and and 0.95% linoleic acid. The calculated dietary FA composition was 0.97% (palmitic acid), 0.43% (stearic
acid), 1.64% (oleic acid) and 0.95% (linoleic acid). Pigs were fed the commercial diet ad libitum for 32 days and then slaughtered
at 110 (±2.98) kg of body weight. The right thigh from each pig was obtained by cutting (24 h after slaughter) and processed
in a traditional manner for approximately 12 months to produce a dry-cured ham (Santos et al., 2008), which were subsequently deboned. The subcutaneous fat at the level of the biceps femoris muscle was carefully taken from each dry-ham. The SF samples were stored at 4 °C until analysis. Samples were analyzed in
the 1st week of storage.
2.3. Triacylglycerol purificationTOP
The total lipids of the subcutaneous fat were extracted following Segura and López-Bote (2014) and Segura et al. (2015) protocols. The TAG fraction was purified (as Sayanova et al., 2012) by TLC using silica gel plates (0.25 mm thickness) that were developed using hexane: ethyl ether: acetic acid (75:25:1 by
volume). The TLC plates were sprayed with a 0.05% solution of primuline in acetone: water (80:20 by volume) to identify the
position of the TAG fraction on the plates. The TAG fraction was scraped off the plates and eluted from silica with hexane:
ethyl ether (95:5 by volume).
2.4. Positional analysis of FAs in TAGs-Method ATOP
A positional analysis of purified TAGs was performed as previously described by Luddy et al. (1964) and adapted by Mancha and Vazquez (1970). Samples containing 10 mg TAGs were dried under nitrogen and re-suspended in 1 mL of 1 mM Tris/HCl (pH 8.0). Samples were
sonicated for 60 sec to ensure complete emulsification of the lipid. Then 0.1 mL of 22% CaCl2 and 0.25 mL of 0.1% deoxycolate were added. The samples were warmed at 40 °C for 30 sec. Fat hydrolysis started after the
addition of 2 mg pancreatic lipase (Sigma-Aldrich). The samples were vortexed for 1–2 min. The reaction was stopped when approximately
60% of the TAGs were hydrolyzed by adding 0.5 mL of 6 N HCl (to prevent diacylglycerol isomerization). The total lipids were
extracted three times with 1.5 mL diethyl ether, evaporated at 40 °C under nitrogen, and separated into lipid classes by TLC
as above. The spots corresponding to 2-MAG and remaining TAGs were scraped off the plate and directly transmethylated for
GC-FID analysis. The validity of the procedure was confirmed by comparing the FA composition of the intact TAG sample and
those remaining after the partial hydrolysis (Martínez-Force et al., 2009). The mean composition of FAs in the sn-1,3 positions was calculated using the composition of an aliquot of the initial TAGs and the formula:
Mean sn-1,3 % = [(3×% FAs in TAGs) − (% FAs in 2-MAG)]/2.
Fatty acid methyl esters (FAMEs) were obtained from isolated lipids by heating the samples at 80 °C for 1 h in 3 mL of methanol:
toluene: H2SO4 (88:10:2 by volume) as in Garcés and Mancha, 1993. After cooling, 1 mL of hexane was added and the samples were mixed. FAMEs were recovered from the upper phase. FAMEs were
separated and quantified using a gas chromatograph (Agilent, HP 6890 Series GC System) equipped with a flame ionization detector.
Separation was performed with a J&W GC Column, HP-Innowax Polyethylene Glycol (30 m×0.316 mm×0.25 μm). Nitrogen was used as
a carrier gas. After injection at 170 °C, the oven temperature was raised to 210 °C at a rate 3.5 °C·min−1, then to 250 °C at a rate of 7 °C·min−1 and held constant for 1 minute. The flame ionization was held at 250 °C. The split ratio was 1:40. FAME peaks were identified
by comparing their retention times with those of authentic standards (Sigma-Aldrich, Madrid, Spain).
2.5. Positional analysis of FAs in TAGs-Method BTOP
Extracted TAGs were digested with Rhizopus arrhizus lipase (Sigma-Aldrich, Spain) following the protocol of Williams et al. (1995), as modified by Smith et al. (1998). Lipids (2 μL) were added to 1 mL of buffer containing 1 mg·mL−1 Triton X-100, 0.05 M borate, 0.04 M Tris (pH 7.2). Samples were sonicated for 60 s to ensure a complete emulsification of
the lipids. Onehalf of the suspension was transferred to a clean tube. Two hundred units of R. arrhizus lipase were added to the tube. The remaining portion of the suspension was analyzed without digestion. Both sets of tubes
were incubated at 37 °C for 60 min. The reaction was terminated with 0.5 mL of 1 N acetic acid and 3 mL of chloroform:methanol
(2:1 by volume). The lipids were extracted three times with chloroform:methanol and evaporated under N2. The complete digestion of TAGs was confirmed by TLC.
Lipase hydrolysis products were trans-methylated by incubating with 1 mL of 0.1 M NaOH in methanol for 30 min at 65 °C. After
cooling, 1 mL of hexane was added and the samples were mixed. FAMEs were recovered from the upper phase, separated and quantified
by GC as shown in 2.3 (see above). The NaOH/methanol methylation procedure does not methylate non-esterified FAs. Therefore,
the fatty acid compositions of the lipase-digested (recognized as FAs in sn-2 position) and undigested (FAs in total lipids) fractions were used to calculate the average composition of the FAs in the
sn-1,3 positions (Smith et al., 1998):
Average sn-1,3 % = (3×% FAs in total lipids) − (2×% FAs in sn-2 position)
2.6. Determination of melting PointTOP
Triplicate subcutaneous fat samples were independently collected from each dry-cured ham. Samples were melted at 80 °C and
1 cm was drawn into capillary tubes while still warm. The capillary tubes containing the samples were stored at 4 °C overnight
and then placed vertically in a chilled water bath. The temperature was gradually increased in the water bath (2 °C·min−1). The temperature at which the lipid began to move up the capillary tube was recorded (ISO 6321-2002).
2.7. Texture profile analysisTOP
A texture profile analysis (TPA) was performed using a TA.XT2i SMS Stable Micro Systems Texture Analyzer (Stable Microsystems
Ltd., Surrey, England) with the Texture Expert programmes. Textural tests of dry-cured ham subcutaneous fat were carried out
in quadruplicate at about 22 °C. Briefly, four cylinders of 1.5 cm high and 1 cm wide were prepared from every sample. A slice
of 1.5 cm of subcutaneous fat from the Biceps femoris level was cut and the cylinders were made using a stainless steel cutting cylindrical device made for that porpous. A double
compression cycle test was performed with up to 50% compression of the original portion height using an aluminium cylinder
probe of 2 cm in diameter. A time of 5 seconds was allowed to elapse between the two compression cycles. Force-time deformation
curves were obtained with a 25 kg load cell applied at a cross-head speed of 2 mm·s−1. Hardness (N), measured as the maximum force required to compress the sample, was quantified (Bourne, 1978).
2.8. Statistical analysisTOP
Response data were evaluated using the General Linear Model (GLM) of SAS version 9.2 (SAS Inst. Inc., Cary, NC, 2009). The
Pearson linear correlation matrix was carried out with the Proc Corr Pearson procedure contained in SAS.
3. RESULTS AND DISCUSSIONTOP
The firmness of the fatty tissue in pork meat is one of the most important criteria of meat quality (Enser, 1983). The composition in saturated FAs principally dictates the melting point of a fat (firmness), with a highly saturated fat
having a higher melting point (firmer) than an unsaturated fat. In this study, subcutaneous fat samples had and average slip
point value of 29.9 (Table 1). This value is in agreement with previous records published in the Codex Alimentarius (1999) and Silva et al. (2009). Additionally, the hardness of these samples varied between 14.2 and 40.2 N, which is within the range of the values described
by Herrero et al. (2007) in fermented sausages and Herrero et al. (2008) in cooked meat sausages, all of them high-fat meat products. Table 2 shows the average, standard deviation and range of main FAs in the TAG fraction from those samples, as well as the values
for the sum of all saturated fatty acids (SFA), monounsaturated fatty acids (MUFA) and polyunsaturated fatty acids (PUFA).
There were no remarkable differences between the subcutaneous TAG fractions which were to be evaluated using method A or B.
Table 1. Mean, standard deviation (SD) and range of melting point and hardness of dry-cured ham subcutaneous fat
|
Mean |
SD |
Range |
| Slip pointa (°C) |
29.9 |
1.3 |
27.8–32.5 |
| Hardnessb (N) |
22.9 |
6.8 |
14.2–40.2 |
aData obtained from twenty ham samples analyzed in triplicate.
bData obtained from four ham samples analyzed in quadruplicate. |
Table 2. Fatty acid (g·100g−1) composition1 of intact triacylglycerides from the subcutaneous fat of dry-cured hams and TAG sn-2 and sn-1,3 fatty acid compositions obtained from the two analytical methods under evaluation
|
Method A |
Method B |
P value |
| Mean±SD |
Range |
Mean±SD |
Range |
| TAGs |
|
|
|
|
|
| 16:0 |
24.9±1.2 |
23.3–27.7 |
25.4±1.9 |
23.6–30.0 |
ns |
| 16:1 |
2.6±0.3 |
1.8–3.1 |
2.2±0.2 |
1.8–2.6 |
ns |
| 18:0 |
13.8±2.0 |
10.5–20.3 |
13.8±3.5 |
11.1–19.3 |
ns |
| 18:1n-9 |
48.9±2.5 |
42.8–53.8 |
46.1±2.6 |
37.7–49.0 |
* |
| 18:2n-6 |
5.5±1.8 |
2.7–8.5 |
7.6±1.6 |
7.0–10.9 |
* |
| Others |
4.4±0.6 |
2.7–4.9 |
5.0±0.3 |
4.3–5.7 |
ns |
| SFA |
40.8±3.0 |
37.0–50.0 |
41.0±3.2 |
34.1–50.0 |
ns |
| MUFA |
53.4±2.7 |
47.1–58.5 |
50.7±2.8 |
41.2–54.2 |
* |
| PUFA |
5.9±1.9 |
2.9–9.0 |
7.2±1.9 |
8.1–11.8 |
* |
| sn-2 position |
|
|
|
|
|
| 16:0 |
43.2±6.2 |
31.0–52.9 |
22.8±2.1 |
16.6–25.5 |
*** |
| 16:1 |
3.1±0.4 |
2.4–3.8 |
3.3±0.3 |
2.6–3.9 |
ns |
| 18:0 |
7.7±1.1 |
5.8–10.7 |
8.6±1.0 |
7.1–10.8 |
*** |
| 18:1n-9 |
31.8±4.6 |
24.5–42.2 |
47.5±2.1 |
42.0–50.8 |
*** |
| 18:2n-6 |
3.9±1.1 |
2.2–5.7 |
11.8±2.2 |
8.6–16.0 |
*** |
| Others |
10.4±3.4 |
6.2–16.2 |
6.1±0.5 |
5.2–7.5 |
*** |
| SFA |
57.1±5.9 |
42.4–65.4 |
33.5±2.9 |
25.5–38.2 |
*** |
| MUFA |
36.0±4.8 |
28.3–47.6 |
52.1±2.2 |
46.2–55.1 |
*** |
| PUFA |
6.8±1.7 |
4.9–10.0 |
14.4±2.5 |
10.9–19.4 |
*** |
| sn-1,3 positions |
|
|
|
|
|
| 16:0 |
15.4±3.0 |
9.6–20.0 |
30.5±5.2 |
22.8–41.0 |
*** |
| 16:1 |
2.2±0.4 |
1.2–2.9 |
0.3±0.4 |
0.1–1.4 |
*** |
| 18:0 |
16.4±2.9 |
12.6–25.7 |
27.1±5.9 |
12.0–37.7 |
*** |
| 18:1n-9 |
55.8±4.5 |
47.7–66.1 |
37.3±8.2 |
18.3–55.3 |
*** |
| 18:2n-6 |
6.2±2.2 |
2.7–9.7 |
5.2±2.4 |
0.3–10.5 |
ns |
| Others |
4.1±0.9 |
1.6–4.9 |
1.7±0.5 |
0.3–2.5 |
*** |
| SFA |
33.4±5.2 |
24.5–45.3 |
56.2±10.0 |
30.1–75.0 |
*** |
| MUFA |
60.4±4.9 |
51.4–70.4 |
39.0±8.6 |
20.5–58.9 |
*** |
| PUFA |
6.3±2.2 |
2.8–9.8 |
5.3±2.6 |
1.3–10.9 |
ns |
| *P<0.05, ***P<0.005.
|
| 1Each value is the mean ± SD from three independent experiments.
|
| Abbreviations: MUFA, monounsaturated fatty acids; PUFA, polyunsaturated fatty acids SFA, saturated fatty acids; SD, standard
deviation.
|
There is not a general agreement on the recommended methodology to assess the positional distribution of FAs within the TAGs
in fats from animal origin (Smith et al., 1998; Perona and Ruiz-Gutierrez, 2004). In table 2, the positional distributions of major FAs within TAG fractions are shown as obtained by the two different analytical methods
under evaluation. Both methods start by the lipase digestion of the TAGs using lipases which are specific for the primary
ester bond of acylglycerols (sn-1,3 specific). As a result, lipase hydrolysis mainly produces free fatty acids and 2-MAGs. Method A is based on the TLC separation
of the hydrolysis products, followed by the acid trans-methylation of 2-MAG and initial TAG fractions. As TAG hydrolysis may
not be completely random and as there may be some contamination from FAs liberated from position sn-2 following acyl migration to positions sn-1,3 (see isomerization in Figure 1), the free fatty acid released after lipase hydrolysis may be somewhat different from the composition originally present
in the primary positions (sn-1,3) of the TAGs. Thus, the mean composition of each fatty acid in positions sn-1 and sn-3 was calculated from its proportion in the intact TAG and in position sn-2, using the relationship previously described by Luddy et al. (1964) (see Materials and Methods 2.3).
Method B is simpler and quicker than method A. This method is easier to use as it eliminates the TLC used in method A and
it can be performed on smaller samples using less lipase. This method also starts by using a lipase that de-esterifies FAs
from the sn-1,3 position. However, method B makes use of the fact that methanolic-NaOH methylates only FAs that are esterified to the
glycerol backbone and converts free fatty acids to aqueously soluble sodium salts. After lipase treatment the difference between
the fatty acid composition of the two methylation reactions (intact and lipase treated samples) is a quantitative measure
of the fatty acids released by the enzyme. Therefore, the fatty acid composition of the lipase-digested and undigested (total)
fractions are used to calculate the average composition of FAs at the sn-1,3 TAG positions as described by Smith et al. (1998) (see Materials and Methods 2.4).
These two analytical methods (A and B) were applied on TAG fractions obtained from dry-cured ham subcutaneous fat (Table 2). Surprisingly, the fatty acid distributions obtained by both methods were significantly different. The fatty acid profile
obtained with method A showed that palmitic acid (16:0) is mainly located in the sn-2 position of TAGs (43.2% of total FAs in sn-2 versus 15.4% of total FAs in sn-1,3), while a different saturated fatty acid, stearic acid (18:0), is mainly esterified at the external positions (sn-1,3) of the TAGs, as well as oleic acid (18:1n-9) and linoleic acid (18:2n-6). Similar distribution has been reported earlier in a variety of pig tissues. Fatty acids are not randomly esterified to
the glycerol hydroxyl groups in animal fats. In the adipose tissue of pigs and in human milk the sn-2-position of TAGs is mostly occupied by SFA, mainly palmitic acid (Christie and Moore, 1970; Innis and Nelson, 2013). Furthermore, this preference for the sn-2 position is used for species differentiation (Mottram et al., 2001; Szabo et al., 2007). However, results obtained when using method B were completely different. Method B indicated that oleic acid is the major
fatty acid at the sn-2 position in pork TAGs (average 47.5%) and more importantly, it showed that palmitic acid is preferentially esterified to
positions sn-1,3. Similar results were obtained by King et al. (2004) who used the same methodology of analysis (Method B). Method B underestimates the concentration of palmitic acid in sn-2, which obviously affects the rest of the fatty acid evaluation. Method B essentially relies on two facts (1) that, the
lipase digestion is ideal, and only a mixture of 2-MAGs and free fatty acids are obtained after lipolysis and (2) that a basic
trans-methylation would lead to the correspondent FAMEs of exclusively the fatty acid components of the 2-MAGs. Although we
have not completely elucidated the reasons for such underestimation, a likely explanation is that this method does not take
into account the minority fractions resulting from the partial lipolysis (sn-1,2 DAGs and sn-2,3 DAGs) of the products from the sn-1,3 DAG isomerization and intact TAGs (non hydrolyzed) when FAs are methylated and mistakenly accounted for as fatty acids
from 2-MAGs. It is likely that either under lipase digestion or under basic trans-methylation conditions, the translocation
of FAs from sn-2 to external positions could be facilitated, as earlier described by Mattson and Volpenhein (1961). This translocation would diminish the concentration of palmitic acid in the sn-2 position of TAGs which ultimately would underestimate the real value of the whole FAs occurrence in the internal (sn-2) position.
As a further step, we aimed to optimize a method for predicting the melting point of a pig fat. Wood et al. (1978) attributed the content in stearic acid as the best predictor of melting point and Lea et al. (1970) considered the relationship between MUFA and SFA the best index. In general, higher proportions of stearic acid and lower
proportions of linoleic acid led to a harder fat. Hugo and Roodt (2007) reviewed the significance of porcine fat quality and reported that both linoleic acid and palmitic acid are important in
terms of firmness. López-Bote et al. (2002) found that an increase in dietary SFA entailed a rise in fat firmness. Isabel et al. (2003) and Hallenstvedt et al. (2012) revealed that changes in dietary fat, specifically in PUFA, MUFA and SFA levels, had a direct effect on shoulder fat firmness.
Smith et al. (1998) and King et al. (2004) analyzed the effect caused by changes in dietary fat on the positional distribution of FAs in TAGs and they related some
of such observed changes with variations in adipose tissue melting points. They reported that palmitic acid and stearic acid
accumulated in sn-1,3 positions increased the slip and melting points in bovine adipose tissue.
In Table 3, a Person matrix linear correlation of melting point and hardness against the main FAs resulted from both methods is shown.
The results indicate that the fatty acid profiles of TAGs were not high-quality indicators of fat melting point or hardness,
and that the content in palmitic acid was the best indicator for fat melting point and stearic acid was the best indicator
for hardness.
Table 3. Pearson's linear correlation coefficients for melting point and hardness values against fatty acid compositions from
both analytical methods in dry-cured ham subcutaneous fat
|
Melting point |
Hardness |
| Method A |
Method B |
Method A |
Method B |
| TAGs |
|
|
|
|
| 16:0 |
0.453 |
0.617** |
0.584* |
0.461 |
| 16:1 |
−0.131 |
0.219 |
−0.378 |
0.476* |
| 18:0 |
0.338 |
0.341 |
0.690** |
0.388* |
| 18:1n-9 |
−0.225 |
0.180 |
−0.490* |
0.148 |
| 18:2n-6 |
−0.088 |
−0.296 |
−0.532* |
−0.470* |
| SFA |
0.329 |
0.008 |
0.708** |
0.280 |
| MUFA |
−0.297 |
0.199 |
−0.451* |
0.172 |
| PUFA |
−0.090 |
−0.309 |
−0.545* |
−0.489* |
| sn-2 position |
|
|
|
|
| 16:0 |
−0.445* |
0.226 |
−0.070 |
0.000 |
| 16:1 |
−0.145 |
−0.003 |
−0.510* |
0.153 |
| 18:0 |
0.114 |
0.480 |
−0.099 |
−0.109 |
| 18:1n-9 |
0.587** |
0.013 |
0.137 |
0.460* |
| 18:2n-6 |
0.212 |
−0.356* |
−0.262 |
−0.362 |
| SFA |
−0.517* |
0.336 |
−0.101 |
−0.046 |
| MUFA |
0.565** |
0.014 |
0.143 |
0.463* |
| PUFA |
0.185 |
−0.401 |
−0.065 |
−0.353 |
| sn-1,3 position |
|
|
|
|
| 16:0 |
0.582** |
0.492* |
0.356 |
0.183 |
| 16:1 |
−0.085 |
0.012 |
−0.182 |
0.407 |
| 18:0 |
0.311 |
−0.162 |
0.715** |
0.012 |
| 18:1n-9 |
−0.505* |
0.164 |
−0.470 |
−0.104 |
| 18:2n-6 |
−0.162 |
0.064 |
−0.586* |
−0.042 |
| SFA |
0.564* |
−0.186 |
0.632** |
0.103 |
| MUFA |
−0.527* |
0.184 |
−0.435 |
−0.078 |
| PUFA |
−0.162 |
−0.043 |
−0.596* |
−0.233 |
*P<0.05,
**P<0.005.
|
| Abbreviations: MUFA, monounsaturated fatty acids; PUFA, polyunsaturated fatty acids SFA, saturated fatty acids. |
The examination of both methods by themselves, with no more variability sources other than the intrinsic biological variation
of the samples, was able to establish similar relationships between melting point and hardness and main FAs to those already
reported by recently cited authors. Method A led to correlations between the fat melting point and oleic acid, total MUFA,
internal TAG (sn-2) position contents, or the palmitic acid content at the external positions. However, Method B results only showed one positive
and significant correlation: the palmitic acid content at the sn-1,3 position and the fat melting point. Regarding hardness, it seems that the sn-2 fatty acids in TAGs are not good indicators (for both methods). However, stearic and total SFA contents in the sn-1,3 TAG positions showed a positive correlation with hardness when TAGs were analyzed by method A but not when method B was
used. In fact, none of the contents of FAs in TAGs from internal or external positions analyzed by method B showed any significant
correlation with hardness values.
From our point of view, it is clear that method B underestimates the proportion of palmitic acid in the sn-2 position of TAGs from pork fat samples. For that reason, it was not possible to get any high-quality correlation of the
fatty acids with the fat melting point or hardness when this method was used.
4. CONCLUSIONSTOP
After the comparison of two commonly used methods for the determination of the positional distribution of fatty acids within
triacylglycerols obtained from subcutaneous fat samples it was found that method A (based in TLC followed by acid trans-methylation
of 2-monoacylglycerol products of a previous lipase digestion and of intact triacylglycerols) led to results which are in
line with the most recent findings in the literature. Additionally, this method's results showed positive correlations between
the positional distribution of FA and the physical properties of subcutaneous fat. Method B was founded on the fact that a
basic trans-methylation would only methylate fatty acids esterified to glycerol molecules, and this method led to entirely
different results which were lacking correlation with selected physical fat properties. We concluded that these inexact results
were likely due to an underestimation of sn-2 palmitic acid concentration by method B.
ACKNOWLEDGMENTSTOP
This research was financed by MEDGAN (S2013 / ABI-2913). Thanks are due to Isabel Martín for her skilful technical assistance.
REFERENCESTOP
| ○ |
Becker CC, Rosenquist A, Hølmer G. 1993. Regiospecific analysis of triacylglycerols using allyl magnesium bromide. Lipids. 28, 147–149. http://dx.doi.org/10.1007/BF02535779.
|
| ○ |
Bourne MC. 1978. Texture profile analysis. Food Technol. 32, 62–66.
|
| ○ |
Brockerhoff H. 1965. A stereospecific analysis of triglycerides. J. Lipid Res. 6, 10–15.
|
| ○ |
Christie WW, Moore JH. 1970. A comparison of structures of triglycerides from various pig tissues. Biochim Biophys Acta. 210, 46–56.
|
| ○ |
Christie WW. 1992. The chromatographic resolution of chiral lipids. In Oily Press, Ayr (Ed.) Advances in Lipid Methodology - One, pp. 121–148. http://dx.doi.org/10.1016/0005-2760(70)90060-3.
|
| ○ |
Codex Alimentarius. 1999. CODEX – STAN 211. Codex 1999 Standard for Named Animal Fats. |
| ○ |
Enser MB. 1983. The relationship between the composition and the consistency of pig backfat. In Wood JD (Ed.) Fat quality in lean pigs, Meat Research Institute Special report No. 2, Document number EUR 8901 EN, CEC Workshop, Brussels, Belgium, 53–57.
|
| ○ |
Garcés R, Mancha M. 1993. One-step lipid extraction and fatty-acid methyl-esters preparation from fresh plant-tissues. Anal. Biochem. 211, 139–143. http://dx.doi.org/10.1006/abio.1993.1244.
|
| ○ |
Gouk SW, Cheng SF, Mok JSL, Ong ASH, Chuah CH. 2013. Long-chain SFA at the sn-1,3 positions of TAG reduce body fat deposition in c57bl/6 mice. Br. J. Nutr. 110, 1987–1995. http://dx.doi.org/10.1017/S0007114513001475.
|
| ○ |
Hallenstvedt E, Kjos NP, Overland M, Thomassen M. 2012. Changes in texture, colour and fatty acid composition of male and
female pig shoulder fat due to different dietary fat sources. Meat Sci. 90, 519–527. http://dx.doi.org/10.1016/j.meatsci.2011.08.009.
|
| ○ |
Herrero AM, Ordoñez JA, de Ávila R, Herranz B, de la Hoz L, Cambero MI. 2007. Breaking strength of dry fermented sausages
and their correlation with texture profile analysis (TPA) and physico-chemical characteristics. Meat Sci. 77, 331–338. http://dx.doi.org/10.1016/j.meatsci.2007.03.022.
|
| ○ |
Herrero AM, de la Hoz L, Ordoñez JA, Herranz B, Romero de Ávila MD, Cambero MI. 2008. Tensile properties of cooked meat sausages
and their correlation with texture profile analysis (TPA) parameters and physico-chemical characteristics. Meat Sci. 80, 690–696. http://dx.doi.org/10.1016/j.meatsci.2008.03.008.
|
| ○ |
Hugo A, Roodt E. 2007. Significance of porcine fat quality in meat technology: A review. Food Res Int. 23, 175–198. http://dx.doi.org/10.1080/87559120701225037.
|
| ○ |
Hunter JE. 2001. Studies on effects of dietary fatty acids as related to their position on triglycerides. Lipids. 36, 655–668. http://dx.doi.org/10.1007/s11745-001-0770-0.
|
| ○ |
Innis SM, Nelson CM. 2013. Dietary triacyglycerols rich in sn-2 palmitate alter post-prandial lipoprotein and unesterified fatty acids in term infants. Prostag Leukotr Ess. 89, 145–151. http://dx.doi.org/10.1016/j.plefa.2013.03.003.
|
| ○ |
Isabel B, López-Bote CJ, de la Hoz L, Timón M, García C, Ruiz J. 2003. Effects of feeding elevated concentrations of monounsaturated
fatty acids and vitamin e to swine on characteristics of dry cured hams. Meat Sci. 64, 475–482. http://dx.doi.org/10.1016/S0309-1740(02)00225-5.
|
| ○ |
ISO 6321:2002. 2002. Animal and vegetable fats and oils - Determination of melting point in open capillary tubes (slip point),
Second edition. pp 2–15.
|
| ○ |
King DA, Behrends JM, Jenschke BE, Rhoades RD, Smith SB. 2004. Positional distribution of fatty acids in triacylglycerols
from subcutaneous adipose tissue of pigs fed diets enriched with conjugated linoleic acid, corn oil, or beef tallow. Meat Sci. 67, 675–681. http://dx.doi.org/10.1016/j.meatsci.2004.01.006.
|
| ○ |
Kuksis A, Itabashi Y. 2005. Regio- and stereospecific analysis of glycerolipids. Methods. 36 (2), 172–85. http://dx.doi.org/10.1016/j.ymeth.2004.11.001.
|
| ○ |
Lea CH, Swoboda PAT, Gatherum DP. 1970. A chemical study of soft fat in cross-bred pigs. J. Agr. Sci. 74, 279–284. http://dx.doi.org/10.1017/S0021859600022899.
|
| ○ |
López-Bote CJ, Isabel B, Daza A. 2002. Partial replacement of poly- with monounsaturated fatty acids and vitamin e supplementation
in pig diets: effect on fatty acid composition of subcutaneous and intramuscular fat and on fat and lean firmness. Anim. Sci. 75, 349–358.
|
| ○ |
Luddy FE, Barford RA, Herb SF, Magidman P, Riemenschneider RW. 1964. Pancreatic lipase hydrolysis of triglycerides by a semimicro
technique. J. Am. Oil Chem. Soc. 41, 693–696. http://dx.doi.org/10.1007/BF02661412.
|
| ○ |
Mancha M, Vázquez A. 1970. Transformación de los glicéridos durante la maduración de la aceituna. III. Distribución de los
ácidos grasos en los triglicéridos. Grasas Aceites. 21, 127–131.
|
| ○ |
Martínez-Force E, Ruiz-López N, Garcés R. 2004. The determination of asymmetrical stereochemical distribution of fatty acids
in triacylglycerols. Anal. Biochem. 334, 175–182. http://dx.doi.org/10.1016/j.ab.2004.07.019.
|
| ○ |
Martínez-Force E, Ruiz-López N, Garcés R. 2009. Influence of specific fatty acids on the asymmetric distribution of saturated
fatty acids in sunflower (Helianthus annuus L.) triacylglycerols. J Agric Food Chem. 2009. 57, 1595–1599. http://dx.doi.org/10.1021/jf803227n.
|
| ○ |
Mattson EH, Volpenhein RA. 1961. The use of pancreatic lipase for determining the distribution of fatty acids in partial and
complete glycerides. J. Lipid Res. 2, 58–62.
|
| ○ |
Mottram HR, Crossman ZM, Evershed RP. 2001. Regiospecific characterisation of the triacylglycerols in animal fats using high
performance liquid chromatography-atmospheric pressure chemical ionisation mass spectrometry. Analyst. 126, 1018–1024. http://dx.doi.org/10.1039/b102491b.
|
| ○ |
Mu HL, Hoy CE. 2004. The digestion of dietary triacylglycerols. Prog. Lipid Res. 43, 105–133. http://dx.doi.org/10.1016/S0163-7827(03)00050-X.
|
| ○ |
Perona JS, Ruiz-Gutiérrez V. 2004. Analysis of neutral lipids: triacylglycerols. In Nollet LML (Ed.) Handbook of food analysis. Marcel Dekker, New York, 275–312.
|
| ○ |
Ponnampalam EN, Lewandowski P, Nesaratnam K, Dunshea FR, Gill H. 2011. Differential effects of natural palm oil, chemically-and
enzymatically-modified palm oil on weight gain, blood lipid metabolites and fat deposition in a pediatric pig model. Nutr. J. 10, 1–7. http://dx.doi.org/10.1186/1475-2891-10-53.
|
| ○ |
Redden PR, Lin X, Horrobin DF. 1996. Comparison of the Grignard deacylation TLC and HPLC methods and high resolution 13C-NMR
for the sn-2 positional analysis of triacylglycerols containing γ-linolenic acid. Chem. Phys. Lipids. 79, 9–19. http://dx.doi.org/10.1016/0009-3084(95)02502-2.
|
| ○ |
Santos C, Hoz L, Cambero MI, Cabeza MC, Ordoñez JA. 2008. Enrichment of dry-cured ham with alpha-linolenic acid and alpha-tocopherol
by the use of linseed oil and alpha-tocopheryl acetate in pig diets. Meat Sci. 80, 668–674. http://dx.doi.org/10.1016/j.meatsci.2008.03.004.
|
| ○ |
Sayanova O, Ruiz-López N, Haslam R, Napier J. 2012. The role of Delta 6-desaturase acyl-carrier specificity in the efficient
synthesis of long-chain polyunsaturated fatty acids in transgenic plants. Plant Biotechnology Journal. 10, 195–206. http://dx.doi.org/10.1111/j.1467-7652.2011.00653.x.
|
| ○ |
Segura J, López-Bote CJ. 2014. A laboratory efficient method for intramuscular fat analysis. Food Chem. 145, 821–825. http://dx.doi.org/10.1016/j.foodchem.2013.08.131.
|
| ○ |
Segura J, Escudero R, Romero de Ávila MD, Cambero MI, López-Bote CJ. 2015. Effect of fatty acid composition and positional
distribution within the triglyceride on selected physical properties of dry-cured ham subcutaneous fat. Meat Sci. 103, 90–95. http://dx.doi.org/10.1016/j.meatsci.2015.01.008.
|
| ○ |
Silva RC, Cotting LN, Poltronieri TP, Balcão VM, Gioielli LA. 2009. Physical properties of structured lipids from lard and
soybean oil produce by enzymatic interesterification. Ciência e Tecnologia de Alimentos. 29, 652–660. http://dx.doi.org/10.1590/S0101-20612009000300031.
|
| ○ |
Smith SB, Yang AJ, Larsen TW, Tume RK. 1998. Positional analysis of triacylglycerols from bovine adipose tissue lipids varying
in degree of unsaturation. Lipids. 33, 197–207. http://dx.doi.org/10.1007/s11745-998-0196-8.
|
| ○ |
Szabo A, Febel H, Sugar L, Romvari R. 2007. Fatty acid regiodistribution analysis of divergent animal triacylglycerol samples
- a possible approach for species differentiation. J. Food Lipids. 14, 62–77. http://dx.doi.org/10.1111/j.1745-4522.2006.00071.x.
|
| ○ |
Williams JP, Khan MU, Wong D. 1995. A simple technique for the analysis of positional distribution of fatty-acids on diacylglycerols
and triacylglycerols using lipase and phospholipase-A2. J Lipid Res. 36, 1407–1412.
|
| ○ |
Wood JD, Enser MB, Macfie HJ, Smith WC, Chadwick JP, Ellis M, Laird R. 1978. Fatty acid composition of backfat in large white
pigs selected for low backfat thickness. Meat Sci. 2, 289–300. http://dx.doi.org/10.1016/0309-1740(78)90030-X.
|