Correlation between lipid and carotenoid synthesis and photosynthetic capacity in Haematococcus pluvialis grown under high light and nitrogen deprivation stress
C. Lianga, Y. Zhaia, D. Xub, N. Yeb,*, X. Zhangb, Y. Wangc, W. Zhanga and J. Yua
aQingdao University of Science & Technology, Qingdao 266042, China
bYellow Sea Fisheries Research Institute, Chinese Academy of Fishery Sciences, Qingdao 266071, China
cQingdao Agricultural University, Qingdao 266109, China
*Corresponding authors: yenh@ysfri.ac.cn
| |
SUMMARY
Recently, H. pluvialis has been demonstrated to have significant potential for biofuel production. To explore the correlation between total lipid
content and other physiological parameters under stress conditions, the responses of H. pluvialis to high light intensity (HL), nitrogen deprivation (-N), and high light intensity with nitrogen deprivation (HL-N) were investigated.
The total lipid content in the control cells was 12.01% dw, whereas that of the cells exposed to HL, -N, and HL-N conditions
was 56.92, 46.71, and 46.87% dw, respectively. The fatty acid profile was similar under all conditions, with the main components
including palmitic acid, linoleic acid, and linolenic acid. A good correlation was found between individual carotenoid and
total lipids, regardless of culture conditions. Photosynthetic parameters and lipid content were also found to be well-correlated.
|
| |
RESUMEN
Correlación entre lípidos, síntesis de carotenoides y capacidad fotosintética de Haematococcus pluvialis desarrollado bajo luz intensa y deficiencia de nitrógeno. Recientemente, H. pluvialis ha demostrado tener un gran potencial para la producción de biocombustibles. Para explorar la correlación entre el contenido
total de lípidos y otros parámetros fisiológicos en condiciones de estrés, se investigaron las respuestas de H. pluvialis a una alta intensidad de luz (HL), una privación de nitrógeno (-N), y ambos, alta intensidad de la luz con privación de nitrógeno
(HL-N). El contenido total de lípidos de las células control fue de 12,01% dw, mientras que el de las células expuestas a
HL, N, y condiciones de HL-N fue de 56,92, 46,71, y 46,87% dw, respectivamente. El perfil de ácidos grasos fue similar para
todas las condiciones, cuyos componentes principales fueron los ácidos palmítico, linoleico y linolénico. Se encontró una
buena correlación entre carotenoides y lípidos totales individuales, independientemente de las condiciones de cultivo. También
se encontró una buena correlación entre los parámetros fotosintéticos y el contenido de lípidos.
|
1. INTRODUCTIONTOP
Energy has become a crucial factor for humans’ economic growth and high standard of living, especially after the industrial
revolution in the late eighteenth and early nineteenth centuries (Atabani et al., 2012). The global energy crisis has stimulated the need to find alternative energy resources (González-Fernández et al., 2012). Microalgae are a promising source of biofuel due to their simple cellular structure, higher growth rate, and higher lipid
content than conventional oleaginous vegetable crops (Halim, 2012). It has been reported that microalgae are the more sustainable source of biodiesel in terms of food security and environmental
impact, when compared with palm oil (Ahmad et al., 2011).
Algae species and culture conditions have been found to be the two most important factors contributing to high oil yield (Ghasemi
et al., 2012; Xu et al., 2013; Mou et al., 2012). The freshwater microalga Neochloris oleoabundans and the marine microalgae Nannochloropsis sp. are considered to be suitable for biofuel production because of their high oil content (29.0 and 28.7%, respectively)
(Gouveia and Oliveira, 2009). The average lipid production in microalgae has been found to vary between 1 and 70%; however, under certain conditions,
some species have been noted to exhibit a lipid content of up to 90% dry weight (dw) (Chisti, 2007; Li et al., 2008). It has been reported that the oil content of Botryococcus braunii can reach 75% dw under nitrogen-deficient condition; however, the alga has been found to exhibit low productivity (Ghasemi et al., 2012). Recently, Damiani et al. (2010) assessed the potential use of the unicellular green alga Haematococcus pluvialis as a biodiesel feedstock, and analyzed the lipid content and composition of H. pluvialis under both control and stress conditions. It was observed that nitrogen is quantitatively the most important nutrient affecting
the biomass growth and lipid productivity of various microalgae (Griffiths and Harrison, 2009). Furthermore, optimized light intensities have been reported to improve the lipid content in microalgae (Rosenberg et al., 2008). The lipid production of the most common algae ranged between 20 and 50%, and high light intensity has been observed to
stimulate higher productivities (Mata et al., 2010).
H. pluvialis is an important commercial microalga due to its significant ability to accumulate ketocarotenoid-astaxanthin (Sarada et al., 2006). Many studies have examined the content, synthesis, and biological activity of fatty acids and astaxanthin in H. pluvialis (Damiani et al., 2010; Cifuentes et al., 2003; Cerón et al., 2007). Stress conditions such as nutrient limitation and high light intensity induced lipid accumulation during cyst formation
in H. pluvialis (Zhekisheva et al., 2002). These conditions are also conducive to enhancing astaxanthin synthesis and changing other physiological performance (Sarada
et al., 2006; Cifuentes et al., 2003). A significant inverse correlation between photosynthetic efficiency and cellular neutral lipid yields has been found in
the freshwater microalgae Chlorella sp. (White et al., 2011). Furthermore, Solovchenko et al. (2010) demonstrated that there was a tight, nonlinear relationship between the car/chl ratio and TFA contents per dw, regardless
of the cultivation conditions.
Although astaxanthin in H. pluvialis has been intensively investigated, studies examining its lipid accumulation strategy under various conditions are still limited.
To explore the association between the synthesis of lipids and carotenoids in H. pluvialis, the lipid production and carotenoid accumulation in H. pluvialis under conditions of nitrogen deprivation and high light intensity were investigated in this study. In addition, the PSII
photosynthetic characteristics were synchronously analyzed by PAM fluorometry technology to determine whether there was any
relationship between them.
2. MATERIALS AND METHODSTOP
2.1. Algal strain and culture conditionsTOP
The microalga H. pluvialis used in this study was provided by the Laboratory of Phycology, Yellow Sea Fisheries Research Institute, Chinese Academy
of Fishery Science. The strain was cultivated in an MCM medium at 20 °C under 50 μmol photons·m−2s−1 with a 12:12-h light/dark photoperiod (Boussiba and Vonshak, 1991). The algae in exponential growth phase were used for the experiments. The algal cells were harvested by centrifugation (8000×
g for 3 min), washed twice in double-distilled water, and re-suspended in the corresponding culture conditions: (1) MCM medium,
under the same conditions as those indicated earlier (control); (2) MCM medium, under 350 μmol photons·m−2s−1 light intensity (HL); (3) nitrogen-free medium, under optimal light intensity (-N); and (4) nitrogen-free medium, under 350
μmol photons·m−2s−1 light intensity (HL-N). Each experiment was performed for 14 days and at least three independent repetitions for each treatment
were carried out. The H. pluvialis cells were sampled every 2 days for the subsequent analyses.
2.2. Lipid extractionTOP
H. pluvialis cells were harvested and lyophilized using a freezer dryer for analyzing the total lipid content. A total of 50 mg of freeze-dried
samples were treated with 1000 μL of methanol at 4 °C for 15 min. The extraction was repeated three times to obtain all the
neutral lipids. Subsequently, the methanol extract was treated with peroxide-free diethyl ether (containing 0.01% butylhydroxytoluene
(BHT), hexane, and water) up to a final ratio of 1:1:1:1 (v/v/v/v). After centrifugation of the mixture (3000 g for 5 min),
the upper phase was collected. The pH of the lower phase was adjusted to 3–4 with acetic acid, and was subjected to re-extraction
with a mixture of diethyl ether and hexane (at a ratio of 1:1, v/v). Subsequently, the combined phases were evaporated to
dryness in nitrogen and stored at −20 °C. Four different treatments were performed after 14 days and at least three independent
repetitions for each extraction were carried out.
2.3. Analysis of fatty acid compositionTOP
The fatty acid analysis was performed as described by An et al. (2013). A total amount of 20 mg of each lyophilized sample was added to a conical flask containing 30 mL of petroleum ether. The
solution was placed in an ultrasound bath (40.0 kHz, 600 W) for 30 min at 50 °C, and this operation was repeated twice. Then,
the solvent was moved from a rotary vacuum evaporator at 50 °C until the weight was unchanged. The total fatty acids were
transmethylated to fatty acid methyl esters (FAMEs) with 5 mL of 0.4 M KOH:Methanol (v/v) at room temperature (25 °C). The
analysis of the resulting FAMEs was carried out using a Finnigan Trace GC-MS (Agilent Technologies, USA). The FAMEs were identified
by comparison with authentic standards (Sigma Chemicals Co., USA), and peaks were integrated with DPS software Version 7.05
(Zhejiang University, China).
2.4. Measurements of growth and PSII photosynthetic parametersTOP
Cell growth was determined by counting the cell numbers using a hemocytometer. Photosynthetic capability was determined by
means of the DIVING-PAM (Walz, Effeltrich, Germany) connected to a PC with WinControl software, using the pulse–amplitude
modulated method. Before measurement, the samples were kept in the dark for 15 min and the original fluorescence (F0) was determined under a low measuring light. A saturation light pulse was applied to obtain maximum fluorescence (Fm) in the dark-adapted samples. The Fm yield in the illuminated samples was denoted as Fm’, and the real-time fluorescence yield was indicated as Ft. The maximal PSII quantum yield (Fv/Fm) was calculated according to the equation: Fv/Fm = (Fm − F0)/Fm. The effective PSII quantum yield (Y(II)) was calculated as follows: Y(II) = (Fm' − Ft)/Fm'. The non-photochemical quenching of chlorophyll fluorescence (NPQ) was calculated based on the following equation: NPQ =
(Fm − Fm’)/Fm’. All the measurements were performed at room temperature.
2.5. Pigment analysisTOP
For pigment analysis, 50 mL of the H. pluvialis culture were harvested at different intervals of stress induction and ultrasonic decomposition. The pigment was extracted
from the algal cells by adding dimethyl sulfoxide (DMSO) at 70 °C for 5 min. The total carotenoids and chlorophyll contents
were determined by UV–Vis spectrophotometers (Purkinje General, China) using the coefficients mentioned by Solovchenko et al. (2010). The chlorophyll and carotenoid concentrations were expressed in mg of chlorophyll per liter and mg of carotenoid per liter,
respectively.
2.6. Statistical analysisTOP
Each experiment was repeated three times. All the observations and calculations were made separately for each set of experiments.
The data were expressed as means with standard deviation (SD). Statistical analyses were performed using SPSS 17.0 for Windows
(SPSS, Chicago, IL, USA). Variance among treatments was tested using a one-way ANOVA. The significance level was p<0.05
for all tests unless otherwise indicated.
3. RESULTSTOP
3.1. Growth measurementsTOP
In the control culture, the sample showed a maximum cell concentration of 9.01×10⁵ cells·mL−1 after 14 days and exhibited an exponential phase from the 2nd to the 10th day. The cells exposed to the control culture retained their flagella for longer periods compared to that under stress conditions.
In the [HL] cultures, after being cultured for 4 days, the algae entered the exponential growth phase with the highest cell
concentration of 3.94×10⁵ cells·mL−1 after 14 days. In the [-N] cultures and in the [HL-N] cultures, the maximum cell concentrations were 2.15×10⁵cells·mL−1 and 1.67×10⁵cells·mL−1, respectively. Although as the stress advanced, all the treatments showed an increase in biomass yield; the cultures stressed
with treatments showed lower cell concentrations than the control cultures. The cells under nitrogen-deficiency treatment
and the high light combined with the nitrogen-deficiency treatment did not exhibit an obvious exponential phase (Figure 1). The culture stressed with high-light produced significantly more biomass than the cultures under other treatments.
|
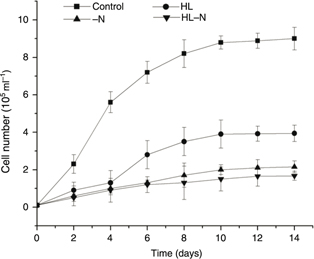 Figure 1. Growth of H. pluvialis in the control, HL, -N, and HL-N cultures. Error bars denote standard deviations among the replicates. HL refers to the cells
under high light (350 μmol photons m−2 s−1 of continuous light); -N refers to the cells under nitrogen starvation stress; HL-N refers to the cells under high light
(350 mol photons m−2 s−1 of continuous light) and nitrogen starvation stress. Figure 1. Growth of H. pluvialis in the control, HL, -N, and HL-N cultures. Error bars denote standard deviations among the replicates. HL refers to the cells
under high light (350 μmol photons m−2 s−1 of continuous light); -N refers to the cells under nitrogen starvation stress; HL-N refers to the cells under high light
(350 mol photons m−2 s−1 of continuous light) and nitrogen starvation stress.
|
|
3.2. Total lipid and rates of TFA synthesisTOP
Figure 2 shows the contents in total lipid in the cultures. Under control condition, the total lipid content of H. pluvialis gradually increased with increasing cultivation time, the maximum total lipid content was 13.60% (percentage dry weight =
% dw) at the 10th day. The total lipid content in the [-N] cultures increased sharply in the first 6 days and raised slowly in the following
4 days, then declined after the 10th day. A similar result was observed in the [HL-N] cultures. Thus, the highest lipid productivities were obtained after 10
days, allowing for a production of up to 46.71% and 46.87%, respectively. In the [HL] culture, a sharp increase in total lipid
content in the first 8 days was observed and a similar increase, although less pronounced, was observed in the following 2
days. The highest amount of total lipid content was obtained after 10 days’ cultivation, which was significantly higher than
that in the longer cultivated culture (Figure 2). The maximum productivity for total lipid accumulation in high-light-exposed cells was 56.92%, which was almost six-fold
over the control cells. The cellular contents of total lipid declined after 10 days regardless of any culture condition (Figure 2). The results suggest that the 10th stress day may be the optimal time for lipid production.
|
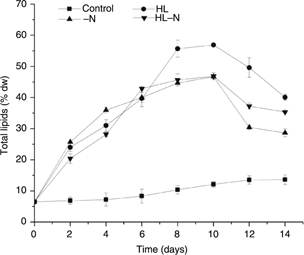 Figure 2. Total lipid content (in % dw) in H. pluvialis grown in the control, HL, -N, and HL-N cultures. Figure 2. Total lipid content (in % dw) in H. pluvialis grown in the control, HL, -N, and HL-N cultures.
|
|
3.3. Effect of different stress conditions on fatty acid compositionTOP
To identify the change in the fatty acid composition of the H. pluvialis cells grown under stress, a typical profile of lipids extracted from the lyophilized cells of H. pluvialis was developed, as shown in Table 1. The major fatty acids in H. pluvialis were palmitic acid (C16:0), linoleic acid (C18:2n6), and linolenic acid (C18:3n3), which altogether were found to represent
about 60–70% of the TFA. Under stress conditions, all of them increased, especially the palmitic acid content (C16:0) under
HL-N. Additionally, the oleic acid (C18:1) increased by 2-fold, 1.2-fold and 1.4 fold, respectively, under HL, -N, and HL-N
culture conditions, accompanied by a decrease in C16:2, C16:4 and EPA fatty acids. The percentage of saturated fatty acids
(SFA) was shown to be significantly higher in cultures grown under the [HL] culture (30.80%), the [-N] culture (29.11%) and
the [HL-N] culture (30.79%) conditions compared to the control (27.81%). In general, the polyunsaturated fatty acid (PUFA)
content presented a downward trend, whereas the monounsaturated fatty acid (MUFA) content increased under stress conditions.
Table 1. Fatty acid profile (% of TFA) in the control, HL, -N, and HL-N cultures
| Fatty acids |
Control |
HL |
-N |
HL-N |
| C14:0 |
0.49±0.04 |
0.72±0.02 |
0.45±0.02 |
0.60±0.04 |
| C16:0 |
24.5±0.51 |
26.62±0.00 |
26.41±0.10 |
27.70±0.62 |
| C16:2 |
2.30±0.13 |
0.64±0.02 |
0.53±0.03 |
0.00±0.00 |
| C16:3 |
3.58±0.08 |
1.23±0.06 |
0.90±0.06 |
0.58±0.02 |
| C16:4 |
9.92±0.07 |
7.47±0.08 |
8.09±0.05 |
7.94±0.01 |
| C18:0 |
3.26±0.01 |
3.40±0.09 |
2.44±0.06 |
3.09±0.01 |
| C18:1 |
3.09±0.02 |
9.55±0.17 |
6.83±0.34 |
7.52±0.00 |
| C18:2n6 |
19.09±0.03 |
19.25±0.04 |
20.14±0.56 |
21.30±0.45 |
| C18:3n6 |
1.35±0.04 |
1.15±0.23 |
1.17±0.22 |
0.92±0.11 |
| C18:3n3 |
19.59±0.50 |
19.80±0.34 |
20.48±0.22 |
20.04±0.01 |
| C18:4 |
3.71±0.04 |
3.73±0.10 |
3.07±0.16 |
3.70±0.06 |
| C20:4n6 (ARA) |
2.77±0.05 |
1.54±0.05 |
1.38±0.12 |
1.40±0.04 |
| C20:5n3 (EPA) |
1.86±0.03 |
1.36±0.18 |
1.23±0.00 |
1.36±0.01 |
| σSFAb |
28.31±0.55 |
30.73±0.07 |
29.29±0.19 |
31.38±0.60 |
| σMUFAb |
3.09±0.02 |
9.55±0.17 |
6.83±0.34 |
7.52±0.00 |
| σPUFAb |
64.17±0.44 |
56.17±0.26 |
59.99±1.25 |
57.26±0.60 |
| aValues are means ± SD of three determinations
|
| bSFA Saturated fatty acids, MUFA Monounsaturated fatty acids, PUFA Polyunsaturated fatty acids
|
| HL refers to the cells under high light (350 μmol photons·m−2 s−1 of continuous light); -N refers to the cells under nitrogen starvation stress; HL-N refers to the cells under high light
(350 μmol photons m−2 s−1 of continuous light) and nitrogen starvation stress.
|
3.4. Analysis of pigment contentTOP
The influence of stress on carotenoid accumulation and chlorophyll was examined in the present study in order to understand
whether the accumulation of lipid and carotenoid was synchronized. The dynamic changes in chlorophyll and carotenoids content
are presented in Figure 3. The cellular content of total carotenoids in the control culture did not change appreciably. In the [-N] culture, the total
carotenoid content increased moderately. In the [HL] culture, the content in total carotenoids increased slightly on the first
6 days, continued to increase sharply between day 6 and day 10, and subsequently remained stable (Figure 3A). The carotenoid content peaked on the 10th day, to 36.12 mg·L−1 in the [HL] cultures and to 27.21mg·L−1 in the [-N] cultures, respectively. The carotenoid content in the [HL-N] culture was more than two- times higher than that
observed in the control culture (Figure 3A).
|
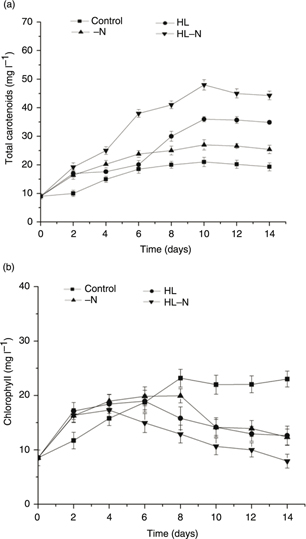 Figure 3. Dynamics of (A) total carotenoid and (B) chlorophyll contents in H. pluvialis cells grown in the control, HL, -N, and HL-N culture. Figure 3. Dynamics of (A) total carotenoid and (B) chlorophyll contents in H. pluvialis cells grown in the control, HL, -N, and HL-N culture.
|
|
In the [HL] culture and [-N] culture, the chlorophyll content increased sharply after the first several days of incubation
and then moderately increased, reaching a maximum value of 18.95 mg·L−1 on day 6 and 19.94 mg·L−1 on day 8, respectively. After 14 days, the chlorophyll content decreased to a similar level in both the cultures (Figure 3B). On the other hand, the [HL-N] culture exhibited the highest chlorophyll content, which reached a value of approximately
17.31 mg·L−1 on the fourth day of cultivation and declined slightly thereafter (Figure 3B).
3.5. PSII photosynthetic characteristicsTOP
Since the relationship between the change in photosynthetic efficiency and the production of lipids has not been widely studied
in algae, we’ve paid special attention to the changes in the PSII photosynthetic characteristics. Fv/Fm, Y(II) and NPQ were measured to evaluate changes in the photosynthesis efficiency. The Fv/Fm, Y(II) and NPQ differed among the four samples during the course of incubation. The control showed no distinct changes in Fv/Fm, Y(II) and NPQ. Fv/Fm of the [HL] cultures; the [-N] cultures and the [HL-N] cultures decreased by 47.6%, 55.9% and 55.67% after a treatment of
10 days (Figure 4A); Y(II) of the stress treatments decreased by 45.2%,30.4% and 63.6% (Figure 4B); and NPQ of the three stress cultures was found 11.09, 14.2 and 6.9 times higher, respectively, than the initial value (Figure 4C).
|
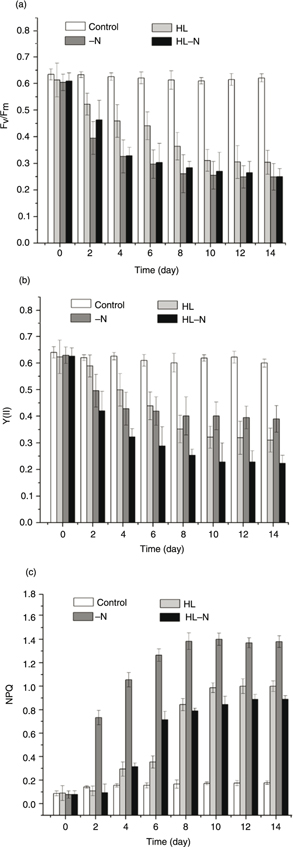 Figure 4. Changes in the three photosynthesis fluorescence parameters in the control, HL, -N, and HL-N cultures: (A) Fv/Fm, (B) Y(II), and (C) NPQ. Figure 4. Changes in the three photosynthesis fluorescence parameters in the control, HL, -N, and HL-N cultures: (A) Fv/Fm, (B) Y(II), and (C) NPQ.
|
|
3.6. Relationships between total lipids and carotenoid synthesis and photosynthetic capacityTOP
A good correlation was found between contents of individual carotenoid and total lipid. As shown in Table 2, it provided high correlation factors ranging from R=0.786 to R=0.862. In stress conditions, the positive correlation
of carotenoid and total lipid presents a more obvious trend compare to the control condition.
Table 2. Correlation indices (R2) of photosynthetic parameters and total lipid contents in the control, HL, -N, and HL-N cultures
| Parameter |
Control |
HL |
-N |
HL-N |
| Fv/Fm |
0.59 |
0.87 |
0.71 |
0.84 |
| Y(II) |
0.29 |
0.87 |
0.72 |
0.84 |
| NPQ |
0.58 |
0.77 |
0.74 |
0.78 |
| Total carotenoids |
0.79 |
0.81 |
0.81 |
0.86 |
| Note: HL refers to the cells under high light (350 μmol photons· m−2s−1 of continuous light); -N refers to the cells under nitrogen starvation stress; HL-N refers to the cells under high light
(350 μmol photons m−2 s−1 of continuous light) and nitrogen starvation stress.
|
The parameters of the PAM Flourometer (Fv/Fm, Y(II), NPQ) recorded significant physiological stress induced by different stress conditions. (Figure 5 A, B, C)
|
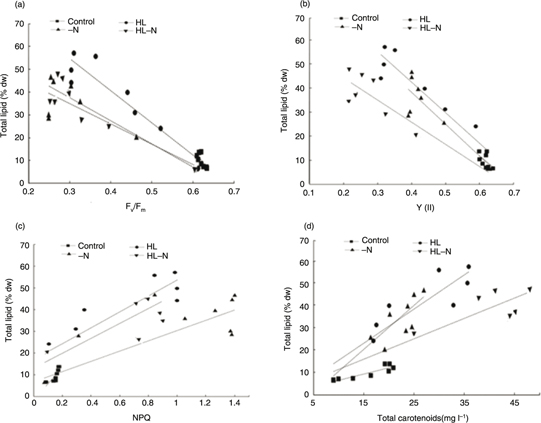 Figure 5. Correlation analysis between total lipid content and photosynthetic parameters: (A) Between total lipid content and Fv/Fm;
(B) Between total lipid content and Y(II); (C) Between total lipid content and NPQ; and (D) Between total lipid and total
carotenoids. Figure 5. Correlation analysis between total lipid content and photosynthetic parameters: (A) Between total lipid content and Fv/Fm;
(B) Between total lipid content and Y(II); (C) Between total lipid content and NPQ; and (D) Between total lipid and total
carotenoids.
|
|
The algal samples in the control exhibited a tight, nonlinear relationship with total lipid content whether Fv/Fm (R2=0.586), Y(II) (R2=0.289), NPQ (R2=0.580) (Figure 5; Table 2). In the [HL] cultures, the [-N] cultures and the [HL-N] cultures, NPQ were well correlated with content of total lipids.
4. DISCUSSIONTOP
In the present work, attempts were made to compare the changes in lipid content and pigment profile with photosynthesis efficiency
in H. pluvialis under various stress conditions. The patterns of biomass accumulation recorded in H. pluvialis (Figure 1) are compatible with previous observations under similar conditions (Damiani et al., 2010). The accumulation of fatty acids under nitrogen starvation is a widely known phenomenon (Ahmad et al., 2011; Gouveia and Oliveira, 2009; Chisti, 2007), although the effect of high light intensity or high light and nitrogen starvation on fatty acid content has not been studied
extensively. Thus, we were particularly interested in examining the relationship between lipid accumulation and high light
intensity in H. pluvialis cultures with or without nitrogen. Stress conditions induced a sharp increase in the content of lipid of H. pluvialis. The data on biomass increase and lipid accumulation (Figures 1 and 2) were identified with the conclusion that when microalgae were cultured under stress condition, preferential degradation
of the nitrogen containing macromolecules occurs as a result in the change in cellular C/N balance, which apparently shifted
toward lipid accumulation (White et al., 2011). According to the previous study, Zhekisheva et al. (2002) found no significant differences in the fatty acid composition in cultures of the German strain of H. Pluvialis subjected to either high light intensity or nitrogen deprivation. And the study also showed that the accumulation of oleic
acid was co-related with an increase in astaxanthin esters when H. pluvialis was grown under nitrogen starvation or high light intensity conditions. Our data were consistent with the conclusion. The
data in Table 1 show that oleic acid content increased sharply in the cells exposed to stress conditions, but it is not the major composition
of fatty acid. However, Cerón et al. (2007) showed that oleic acid was the major fatty acid present in cysts. The differences in oleic acid content observed in this
study could be attributed to differences in growing conditions since the strain cultures were not supplemented with CO2 (Damiani et al., 2010). The de novo pathway produced most of the 18:1 and 16:0 at the expense of the PUFAs 16:2, 16:4 and EPA (Recht et al., 2012). In our study, we also found that PUFAs 16:2, 16:4 and EPA decreased when H. pluvialis cells were cultivated under stress conditions. EPA is a group of fatty acids located in the chloroplast membrane under nutritional
limitations, such as nitrogen, and cells are unable to resynthesize them and/or even keep the concentration of these components
constant (Solovchenko et al., 2010). Thus, we inferred that stresses would influence the photosystem. However, the relationship between the change in photosynthetic
efficiency and the production of lipids has not been widely studied in the algal realm.
The PAM fluorometry has been well used by ecologists to determine phytoplankton photosynthetic efficiency (Petrou et al., 2008; Gustavs et al., 2010). Under environmental stress conditions, data showed significant changes in the physiological parameters (Fv/Fm, Y(II) and NPQ) measured (Figure 4). Previous studies (Petrou et al., 2008) have shown that nutrient starved algae redirect energy from photosynthetic processes towards maximizing nutrient uptake
upon nutrient addition. This redirection of energy leads to a net decrease in the capacity of cells to dissipate energy photochemically.
This resulted (Figure 4C) in an increased NPQ value, suggesting a means of photoprotection. The maximum quantum efficiency Fv/Fm is used to estimate nutrient limitation and Fv/Fm value decreased in the stress culture. A significant inverse correlation was shown between both Fv/Fm and Y(II) and cellular neutral lipid yields. Moreover, NPQ value and lipid content presented a positive correlation (Figure 5C). Oxborough et al. (2000) showed that fluorescence provides an extremely sensitive tool for examining energy metabolism in photosynthetic cells and
the interactions between carbon and nutrient assimilation to be in the form of lipids. The synthesis of neutral lipids has
been found to be a protective mechanism for cells against stressful conditions (Courchesne et al., 2009). PAM fluorometry can be used to increase the yields of lipids by identifying the extent of stress induced by environmental
factors.
The influence of stress on carotenoid accumulation and chlorophyll was also studied in order to understand whether the accumulations
of lipids and carotenoid synchronized. In our results, it was found that the cultivation of H. pluvialis in the [HL] cultures and the [-N] cultures was accompanied by significant changes in its pigment content and composition
(Figure 3). It has been reported that under stress conditions, such as high light irradiance or nitrogen limitation, H. pluvialis formed clusters of globules containing carotenoids at the cell center (Zhekisheva et al., 2002). Carotenoids appeared mostly as mono- and di-esters of various fatty acids and total secondary carotenoids consist of astaxanthin
up to 95% (Sarada et al., 2006). Thus, H. pluvialis had the primary carotenoid composition of the astaxanthin. After exposed to stress conditions, these clusters underwent a
reversible spreading so as to shield a larger surface area of the chloroplast (Yong and Lee, 1991). It was suggested that astaxanthin may act as an antioxidant, inhibiting lipid peroxidation (Cifuentes et al., 2003). Our data represent the same trends of changes in total lipid and carotenoid contents. The relationship between lipid and
carotenoids under stress conditions perfectly matched the above-mentioned point of view (Figure 5D), providing correlation indexes (R2) from 0.786 to 0.862. It was thus reasonable to assume that the fatty acid metabolism under conditions inductive to pigment
accumulation would be one of the key factors controlling astaxanthin biosynthesis in this alga. Therefore, our results indicated
that H. pluvlialis could be a potential microalga for synchronizing the production of biofuel and carotenoids.
5. CONCLUSIONSTOP
This study described the favorable condition for lipid production by H. pluvialis grown under high light intensity and nitrogen deprivation. A significant correlation between carotenoid and lipid content
revealed the possibility of using this alga for combined high-value production of biofuel and carotenoids. The strong correlation
was also observed between the photosynthetic parameters and lipid accumulation. Future studies should consider different culture
conditions, such as CO2 supplementation or the use of a different nitrogen source to obtain an adequate lipid yield.
ACKNOWLEDGMENTSTOP
This work was supported by Shandong Science and Technology plan project (2011GHY11528), the Hi-Tech Research and Development
Program (863) of China (2012AA052103), Special Scientificesearch Funds for Central Non-profit Institutes,Yellow Sea Fisheries
Research Institutes (20603022012004), National Natural Science Foundation of China (41176153,31200187, 31000135), Qingdao
Municipal Science and Technology plan project (12-6-1-3-hy, 11-2-4-3- 5 -jch).
REFERENCESTOP
| ○ |
Ahmad AL, Mat YNH, Derek CJC, Lim JK. 2011. Microalgae as a sustainable energy source for biodiesel production: A review.
Renew Sust. Energy Rev. 15, 584–593. http://dx.doi.org/10.1016/j.rser.2010.09.018.
|
| ○ |
An ML, Mou SL, Zhang XW, Zheng Z, Ye NH, Wang DS, Zhang W, Miao JL. 2013. Expression of fatty acid desaturase genes and fatty
acid accumulation in Chlamydomonas sp. ICE-L under salt stress. Bioresour. Technol. 149, 77–83. http://dx.doi.org/10.1016/j.biortech.2013.09.027.
|
| ○ |
Atabani AE, Silitonga AS, Badruddin IA, Mahlia TMI, Masjuki HH, Mekhilef S. 2012. A comprehensive review on biodiesel as an
alternative energy resource and its characteristics. Renew Sust. Energy Rev. 16, 2070–2093. http://dx.doi.org/10.1016/j.rser.2012.01.003.
|
| ○ |
Boussiba S, Vonshak A. 1991. Astaxanthin accumulation in the green alga Haematococcus pluvialis. Plant Cell Physiol. 32, 1077–1082.
|
| ○ |
Cerón MC, García-Malea MC, Rivas J, Acien FG, Fernández JM, Del Río E, Guerrero MG, Molina E. 2007. Antioxidant activity of
Haematococcus pluvialis cells grown in continuous culture as a function of their carotenoid and fatty acid content. Appl. Microb. Cell Physiol. 74, 1112–1119.
|
| ○ |
Chisti Y. 2007. Biodiesel from microalgae. Biotechnol. Advance 25, 294–306. http://dx.doi.org/10.1016/j.biotechadv.2007.02.001.
|
| ○ |
Cifuentes AS, Gonzalez MA, Vargas S, Hoeneisen M, Gonzalez N. 2003. Optimization of biomass, total carotenoids and astaxanthin
production in Haematococcus pluvialis Flotow strain Steptoe (Nevada, USA) under laboratory conditions. Biol. Res. 36, 343–357. http://dx.doi.org/10.4067/S0716-97602003000300006.
|
| ○ |
Courchesne NMD, Parisien A, Wang B, Lan CQ. 2009. Enhancement of lipid production using biochemical, genetic and transcription
factor engineering approaches. J. Biotechnol. 141, 31–41. http://dx.doi.org/10.1016/j.jbiotec.2009.02.018.
|
| ○ |
Damiani MC, Popovich CA, Constenla D, Leonardi PI. 2010. Lipid analysis in Haematococcus pluvialis to assess its potential use as a biodiesel feedstock. Bioresour Technol. 101, 3801–3807. http://dx.doi.org/10.1016/j.biortech.2009.12.136.
|
| ○ |
Ghasemi Y, Rasoul Amini S, Naseri AT, Montazeri Najafabady N. 2012. Microalgae Biofuel Potentials (Review). Appl. Biochem. Microbiol. 48, 126–144. http://dx.doi.org/10.1134/S0003683812020068.
|
| ○ |
González-Fernández C, Sialve B, Bernet N, Steyer JP. 2012. Impact of microalgae characteristics on their conversion to biofuel.
Biofuel Bioprod. Bior. 6, 105–113. http://dx.doi.org/10.1002/bbb.338.
|
| ○ |
Gouveia L, Oliveira AC. 2009. Microalgae as a raw material for biofuels production. J. Ind. Microbiol. Biotechnol. 36, 269–74. http://dx.doi.org/10.1007/s10295-008-0495-6.
|
| ○ |
Griffiths MJ, Harrison STL. 2009. Lipid productivity as a key characteristic for choosing algal species for biodiesel production.
J. Appl. Phycol. 21, 493–507. http://dx.doi.org/10.1007/s10811-008-9392-7.
|
| ○ |
Gustavs L, Eggert A, Michalik D, Karsten U.2010. Physiological and biochemical responses of green microalgae from different
habitats to osmotic and matric stress. Protoplasma 243, 3–14. http://dx.doi.org/10.1007/s00709-009-0060-9.
|
| ○ |
Halim R. 2012. Extraction of oil from microalgae for biodiesel production: A review. Biotechnol Adv. 30, 709–732. http://dx.doi.org/10.1016/j.biotechadv.2012.01.001.
|
| ○ |
Li Y, Horsman M, Wang B, Wu N, Lan CQ. 2008. Effects of nitrogen sources on cell growth and lipid accumulation of green alga
Neochloris oleoabundans. Appl. Microbiol. Biot. 81, 629–636. http://dx.doi.org/10.1007/s00253-008-1681-1.
|
| ○ |
Mata TM, Martins AA, Caetano NS. 2010. Microalgae for biodiesel production and other applications: A review. Renew Sust. Energy Rev. 14, 217–232. http://dx.doi.org/10.1016/j.rser.2009.07.020.
|
| ○ |
Mou SL, Xu D, Ye NH, Zhang XW, Liang CW, Liang Q, Zheng Z, Zhuang ZM, Miao J L. 2012. Rapid estimation of lipid content in
an Antarctic ice alga (Chlamydomonas sp.) using the lipophilic fluorescent dye BODIPY 505/515. J. Appl. Phycol. 24, 1169–1176. http://dx.doi.org/10.1007/s10811-011-9746-4.
|
| ○ |
Oxborough K, Hanlon A RM, Underwood GJC, Baker NC. 2000. In vivo estimation of the photosystem II photochemical efficiency
of individual microphytobenthos cells using high resolution imaging of chlorophyll a fluorescence. Limnol Oceanogr. 43, 1207–1221.
|
| ○ |
Petrou K, Doblin MA, Smith RA, Ralph PJ, Shelly K, Beardall J.2008. State transitions and non-photochemical quenching during
a nutrient induced fluorescence transient in phosphate starved Duniella Tertiolecta. J. Phycol. 44, 1204–1211. http://dx.doi.org/10.1111/j.1529-8817.2008.00585.x.
|
| ○ |
Recht L, Zarka A, Boussiba S. 2012. Patterns of carbohydrate and fatty acid changes under nitrogen starvation in the microalgae
Haematococcus pluvialis and Nannochloropsis sp. Appl. Microbiol. Biot. 94, 1495–1503. http://dx.doi.org/10.1007/s00253-012-3940-4.
|
| ○ |
Rosenberg JN, Oyler GA, Wilkinson L, Betenbaugh MJ. 2008. A green light for engineered algae: redirecting metabolism to fuel
a biotechnology revolution. Current Opin. Biotech. 19, 430–436. http://dx.doi.org/10.1016/j.copbio.2008.07.008.
|
| ○ |
Sarada R, Vidhyavathi R, Usha D, Ravishankar GA. 2006. An efficient method for extraction of astaxanthin from green alga Haematococcus pluvialis. J. Agric. Food Chem. 54, 7585–7588. http://dx.doi.org/10.1021/jf060737t.
|
| ○ |
Solovchenko A, Merzlyak MN, Khozin-Goldberg I, Cohen Z, Boussiba S. 2010. Coordinated carotenoid and lipid syntheses induced
in parietochloris incisa (chlorophyta, trebouxiophyceae) mutant deficient in Δ5 desaturase by nitrogen stavation and high light. J. Phycol. 46, 763–772. http://dx.doi.org/10.1111/j.1529-8817.2010.00849.x.
|
| ○ |
White S, Anandraj A, Bux F. 2011. PAM fluorometry as a tool to assess microalgal nutrient stress and monitor cellular neutral
lipids. Bioresour Technol. 102, 1675–82. http://dx.doi.org/10.1016/j.biortech.2010.09.097.
|
| ○ |
Xu D, Gao Z, Li F, Fan X, Zhang X, Ye N, Mou S, Liang C, Li D.2013. Detection and quantitation of lipid in the microalga Tetraselmis subcordiformis (Wille) Butcher with BODIPY 505/515 staining. Bioresour. Technol. 127, 386–390. http://dx.doi.org/10.1016/j.biortech.2012.09.068.
|
| ○ |
Yong YYR, Lee YK. 1991. Do carotenoids play a photoprotective role in the cytoplasm of Haematococcus lacustris (Chlorophyta)? Phycologia 30, 257–261. http://dx.doi.org/10.2216/i0031-8884-30-3-257.1.
|
| ○ |
Zhekisheva M, Boussiba S, Khozin-Goldberg I, Zarka A, Cohen Z. 2002. Accumulation of oleic acid in haematococcus pluvilis
(chlorophyceae) under nitrogen starvation or high light is correlated with that of astaxanthin esters. J. Phycol. 38, 325–331. http://dx.doi.org/10.1046/j.1529-8817.38.s1.9.x.
|