Volatile compounds in the perirenal fat from calves finished on semi-extensive or intensive systems with special emphasis on terpenoids
S. Sotoa,c, E. Serranob, M.J. Humadab, A. Fernández-Dieza, I. Caroa, A. Castroa and J. Mateoa,*
aDepartamento de Higiene y Tecnología de los Alimentos, Facultad de Veterinaria, Campus Vegazana s/n, Universidad de León,
24007 León, Spain
bCentro de Investigación y Formación Agrarias (C.I.F.A.). Gobierno de Cantabria, C/ Héroes 2 de mayo, 27, 39600, Muriedas,
Cantabria, Spain
cInstituto de Ciencias Agropecuarias. Universidad Autónoma del Estado de Hidalgo. Ave. Universidad s/n km 1. 43600. Tulancingo,
Hidalgo, México
*Corresponding author: jmato@unileon.es
| |
SUMMARY
Grazing ruminants and their production systems have been associated with lower environmental impact and higher animal welfare,
along with distinctive meat quality characteristics when compared to intensively reared animals. Recent studies have been
aimed at finding compounds in ruminant meat and fat which could be used as tracers of herbage feeding. This study determined
and compared the volatile composition of the perirenal fat from Tudanca-breed calves reared on semi-extensive (SE; n=8) or
intensive (I; n=8) systems. The volatile compounds of perirenal fat were analyzed using simultaneous distillation-extraction
and gas chromatography coupled with mass spectrometry (GC/MS) with the mass spectra detector operating in full scan mode.
Terpenes were also determined using solid-phase micro-extraction and GC/MS operating in the selective ion monitoring mode.
The SE system resulted in decreased levels of octanal, 2-octenal and 2,4-decadienal, and increased levels of 2,3-octanedione
and skatole. The levels of α-pinene, aromadendrene, α-phellandrene, eucalyptol and α-gurjunene were higher for the SE system.
Fenchene, eucalyptol and α-gurjunene have not been reported in previous studies on beef volatiles. The study showed the possibility
of using several terpenes of perirenal fat as indicators of pasture-feeding in Tudanca calves.
|
| |
RESUMEN
Compuestos volátiles de grasa perirrenal de terneros terminados en sistemas semi-extensivos o intensivos, con especial énfasis
en terpenoides. La producción de rumiantes en pastoreo puede suponer un menor impacto ambiental y un mayor bienestar animal, y considerarse
como una característica de calidad diferenciada de la carne generada, con respecto a los animales producidos de forma intensiva.
En estudios recientes se ha investigado sobre la presencia de compuestos en la carne o grasa de rumiantes que puedan ser utilizados
como marcadores de alimentación a base de pasto. En el presente estudio se ha determinado y comparado la composición volátil
de la grasa perirrenal de terneros de raza Tudanca criados mediante un sistema semi-extensivo (SE; n=8) o intensivo (I; n=8).
Los compuestos volátiles de grasa perirrenal fueron analizados utilizando un método de extracción-destilación simultánea seguido
por cromatografía de gases acoplada a un detector de espectro de masas (CG/EM), operando en modo de barrido completo. Por
otra parte, se determinaron de forma específica los terpenoides utilizando la técnica de microextracción en fase solida seguida
por CG/EM, operando en modo de barrido selectivo de iones. La grasa del sistema SE mostró menores niveles de octanal, 2-octenal
y 2,4-decadienal y mayores niveles de 2,3-octanodiona y escatol que el sistema I. Además, los niveles de α-pineno, aromadendreno,
α-felandreno, eucaliptol, α-gurjuneno fueron más altos en el sistema SE. La presencia de fencheno, eucaliptol y α-gurjuneno
no ha sido descrita en estudios previos en compuestos volátiles en carne o grasa de bovino. Este estudio muestra la posibilidad
de utilizar varios terpenos presentes la grasa perirrenal como indicadores de alimentación en pastoreo en terneros Tudancos.
|
1. INTRODUCTIONTOP
The northern low-land cattle-production region in the European Union, i.e., the western coastal area, is characterized by
grassland farming and fodder production (Allen et al., 1980). More specifically in the Spanish Cantabria region, milk, beef and veal are largely produced from cattle. An endangered
local breed from Cantabria is the Tudanca cattle, which is used for meat production and their meat has been included in the
Protected Geographical Indication (PGI), “Carne de Cantabria” (Commission Regulation (EC) No 1483/2004). Tudanca breeding
females are typically used in suckler herds under semi-extensive production systems. Male calves are usually weaned at 5 months
of age and most of them are sold lean for finishing elsewhere.
In European Mediterranean countries veal obtained from calves (less than one year old) is appreciated for its pale color and
high tenderness. Therefore, production of finished calves slaughtered between 9 and 10 months old might be an interesting
possibility to improve profitability on Tudanca farms. Strategies for finishing these animals could include a semi-extensive
suckling system based on pasture feeding, suckling until slaughter and supplementation with a limited quantity of concentrate,
or an intensive system based on concentrate and conserved forages feeding (Humada et al., 2013).
Grazing ruminants and their production systems have been associated with higher value for environment and animal welfare when
compared to indoor-housed ruminants and intensive production (Horrigan et al., 2002). Moreover, feeding systems have effects on beef quality. According to a number of studies conducted over the last few years,
pasture feeding resulted in increased values of unsaturated fatty acids, vitamin E and β-carotenes and lower intramuscular
fat content (Yang et al., 2002; Descalzo et al., 2005; Röhrle et al., 2011; Vasta et al., 2012; Humada et al., 2012; Humada et al., 2014). Taking into account this information, there is an increasing consumer interest in beef from pasture-based production systems.
Recent studies have managed to find compounds in beef that could be used as herbage feeding tracers, based on the significant
effect of the feeding system on the volatile composition of beef (Prache et al., 2005; Serrano et al., 2011; Vasta et al., 2012). Higher levels in the volatile fraction of meat and fat of skatole, 2,3-octanodione and several terpenoids, especially sesquiterpenes,
such as aromadendrene, γ-cadinene or germacrene D, among others, led to the conclusion that those compounds could be used
as indicators of pasture diets in cattle (Vasta and Priolo, 2006; Serrano et al., 2011; Vasta et al., 2012). The ketone 2,3-octanedione could originate from the lipoxygenase activity of leafy plants during the mastication of green
forages and then accumulate in the fat via absorption from the rumen or the lungs (Young et al., 1997). Terpenoids (present in green herbage) are directly transferred from the rumen to the animal tissues. Prache et al. (2005) suggested that terpenoids could be used not only to recognize the type of diet animals consume but also to localize the
geographical origin of pasture-fed animals. Furthermore, Serrano et al. (2011) reported that a higher accumulation of terpenoids was observed in perirenal and intraperitoneal fat compared to intermuscular
and subcutaneous fat.
The purpose of this study was to determine and characterize differences in the volatile composition, with special emphasis
on terpenoids, of the perirenal fat from Tudanca calves finished either on a semi-extensive suckling system or an intensive
system and to evaluate the possibility of using terpene levels in the fat as determined by static-headspace solid-phase micro-extraction
to trace the production system.
2. MATERIALS AND METHODSTOP
2.1. Fat samplesTOP
The perirenal fat from sixteen male Tudanca-breed calves was used for a volatile compound analysis. The animals were reared
following two different production systems, a semi-extensive suckling system and an intensive system, on the experimental
farm “Finca Aranda”, Cóbreces, northern Spain, with an elevation of about 84 m above sea level.
In the semi-extensive suckling system production (SE), eight calves, born in January, were maintained on pasture with their
mothers until slaughter at 10 months old (163±12 kg of body weight). These animals were reared in a rotational grazing system
in an area of 4.9 ha divided into three paddocks and supplemented with crushed barley ad libitum from six months of age onwards. The botanical composition of the grassland was estimated by recording at 600 points, located
1 m apart, on two transects per paddock. The botanical composition and the percentage of the main species with regard to total
species (in brackets) was as follows: monocotyledons, Agrostis capillaris (31), Lolium perenne (19.2), Holcus lanatus (17.8), other (4.8); and dicotyledons, Trifolium repens (15.6), Trifolium pratense (2.5), Lotus corniculatus (2.4), Plantago lanceolata (2.0).
Animals reared under the intensive system were born in March. They were weaned at 5 months of age and then allocated to a
feedlot pen, where they were fed ad libitum with a commercial concentrate (15.5% crude protein, 2.5% crude fat, 7.0% crude fiber and 7% ash; composed of corn, wheat,
corn distillers grains with solubles, wheat middling, wheat bran, decorticated soybean meal, sugar beet pulp, sunflower meal,
sugarcane molasses, calcium carbonate, sodium bicarbonate, sodium chloride and monocalcium phosphate) and rye grass (Lolium perenne) silage (pH 4.14, 27.5% dry matter, 3.0% crude fat and 9.1% ashes) until slaughtered at 9 months of age (144±5 kg of body
weight).
All animals were transported to a commercial slaughterhouse. The slaughter took place immediately after arrival and was performed
according to the European legislation on animal welfare [Council Regulation (EC) No. 1099/2009]. Total perirenal fat of each
carcass was taken 45 minutes post-slaughter, placed in individual polyethylene bags and maintained under refrigeration for
approximately 24 hours. Samples of 100 g were then wrapped in aluminum foil, sealed in polyethylene bags with a vacuum packaging
machine and stored frozen (−80 °C) until analysis (up to three months). Before analysis, samples were thawed at 4 °C overnight
and then homogenized in a food processor.
2.2. Determination of volatile compounds extracted using simultaneous distillation-extractionTOP
The volatile compounds of samples were extracted using the simultaneous distillation-extraction technique and then analyzed
using gas-chromatography coupled mass spectrometry (GC/MS). For the extraction, 40 g of homogenized fat were added to 200
mL of ultrapure deionized water in a flask (500 mL). Volatile constituents were extracted for 3 hours in a Likens-Nikerson
apparatus (J&W scientific, Folsom, CA, USA). The sample flask, with the fat, was immersed in a glycerin bath maintained at
150 °C, and the solvent flask (250 mL), containing 50 mL of diethyl ether, was immersed in a water bath at 45 °C. The distillate
was concentrated to 1 mL using a Makro Kuderna-Danish concentrator (Sigma-Aldrich, St. Louis, MO, USA) in a water bath at
45 °C. After that, anhydrous sodium sulfate was added to remove traces of water and the concentrate was transferred to chromatographic
vials.
Volatile compounds were analyzed in duplicate using a GC 7890A equipment coupled to an MS 5975C detector (Agilent System Zwingen,
Switzerland). One μl of the concentrate was injected into the injection port operating at 260 °C in the split mode (5:1 split
ratio). Compounds were separated using a DB-5MS column (60 m×250 μM×0.25 μM; J&W Scientific) and detected as described by
Vieira et al. (2012). Briefly, helium was used as carrier gas at a constant flow rate of 1.5 mL·min−1. After injection, the oven was kept at 35 °C for 1 min, heated at 10 °C·min−1 to 50 °C, then the temperature was raised at 4 °C·min−1 to 200 °C, and afterwards at 50 °C·min−1 to 250 °C, which was kept for 11 min. The temperature of the transfer line and source were both set at 250 °C. The mass spectrometer
operated in electron impact mode with an electron energy of 70 eV and an emission current of 50 μA. Detection was carried
out in full-scan mode, the scan range was 40–350 mass-to-charge and the scan rate 3.94 scans/s. Compounds were identified
by comparing their mass spectra with those contained in the NIST/EPA/NIH mass spectral database together with personal interpretation.
Moreover, a series of n-alkanes (Hydrocarbons/C5-C20; Sigma-Aldrich) was used to calculate the experimental linear retention
indexes (LRI) for each volatile and, whenever possible, compound identities were confirmed by comparison of their experimental
LRI with those from the literature.
2.3. Volatile compounds extracted by solid-phase micro-extractionTOP
Volatiles were extracted from the fat samples in duplicate, based on the method described by Machiels and Istasse (2003) with some modifications. A 2-g homogenized fat aliquot was placed in a 15-mL vial which was sealed with a cap with a silicone/polytetrafluoroethylene
septa (Agilent Technologies). The vial was then sonicated to equilibrium in a 200-W ultrasonic water bath (JP Selecta, Barcelona,
Spain) for 20 min at 50 °C. Ultrasounds were then switched off and a 75 μm carboxen/polydimethylsiloxane-coated fused silica
SPME fiber (SPME; Supelco, Bellefonte, PA, USA) was exposed to the head-space of the vial with the sample for 50 min at 50
°C. Afterwards, the compounds adsorbed by the SPME fiber were desorbed in the gas chromatograph injection port for 2 min at
260 °C in the splitless mode.
The chromatographic conditions regarding column and oven were the same as those described above. The detection was carried
out with the detector operating in selected ion monitoring (SIM) mode to increase the sensitivity in the detection of terpenes.
Ions m/z 93 and 136 were monitored for monoterpenes and ions m/z 93, 136, 161, 189 and 204 for sesquiterpenes (Viallon et al., 2000).
Presumptive terpenes were first detected from the chromatogram peaks by spectral interpretation, i.e., considered as presumptive
(detected, although unidentified) monoterpenes or sesquitepenes in the compounds associated to peaks showing the selected
monitored ions in appropriate ratios (expected ratios for those compounds). Furthermore, when possible, presumptive terpenes
were identified by comparing and contrasting the retention times and spectral data of the previously identified terpenes (identified
from the simultaneous distillation-extraction analysis of volatiles) with those from the present SPME-extraction analysis.
2.4. Statistical analysisTOP
A single factor analysis of variance (one-way ANOVA using F distribution) was carried out in order to determine the effect
of the production system on the volatile composition. The production system was the factor, and fat samples from each animal
were the experimental units. Moreover, a principal component (PC) analysis was also carried out. In this PC analysis model,
only the content of the terpenes showing significant differences in the ANOVA analysis (P<0.05) were considered as variables. Analyses were performed using the STATISTICA for Windows software (Release 6.0; StatSoft,
Tulsa, OK, USA).
3. RESULTS AND DISCUSSIONTOP
3.1. Volatile compounds in perirenal fat analysed using simultaneous distillation-extractionTOP
Sampling of the adipose tissue from calf carcasses was considered more suitable than sampling of muscle tissue for the purpose
of this study, i.e., the first represents a less destructive sampling and is richer in terpenoids. Furthermore, perirenal
fat was selected among different fat depots following the recommendations of Serrano et al. (2011). Volatile compounds of perirenal fat samples extracted with the Likens-Nickerson technique are shown in Table 1. They were classified into ten chemical families: aliphatic-alicyclic hydrocarbons (7 compounds), aliphatic aldehydes (13),
aliphatic ketones (7), aliphatic alcohols (1), aliphatic acids (2), esters (1), furans (1), benzene compounds (16), sulfur
compounds (1), and terpenoids (9). Moreover, four peaks could not be identified (unknown compounds). The chemical families
showing the highest concentrations were, in order of abundance, aliphatic-alicyclic hydrocarbons, aliphatic aldehydes, terpenoids
and aliphatic ketones.
Table 1. Volatile compounds detected in the perirenal fat of calves reared under intensive and semi-extensive system expressed
as peak area units×10–6
|
Feeding system |
SEM |
P-level
|
LRI |
Reliabilitya |
| Intensive (n=8) |
Semi-extensive (n=8) |
| Aliphatic-alicyclic hydrocarbons |
|
|
|
|
|
|
| 1,1,4-Trimethyl cyclohexane |
1.09 |
0.57 |
0.41 |
NS |
850 |
MS+LRI |
| 2,2,4-Trimethyl heptane |
0.41 |
0.12 |
0.23 |
NS |
881 |
MS+LRI |
| Nonane |
1.54 |
1.72 |
0.92 |
NS |
900 |
MS+LRI |
| Undecane |
0.72 |
0.32 |
0.58 |
NS |
1100 |
MS+LRI |
| Dodecane |
19.72 |
17.34 |
3.62 |
NS |
1200 |
MS+LRI |
| Tetradecane |
23.46 |
21.85 |
4.22 |
NS |
1400 |
MS+LRI |
| Hexadecane |
17.23 |
15.28 |
3.40 |
NS |
1600 |
MS+LRI |
| Sum of unidentified alkanesb |
20.56 |
26.15 |
2.80 |
NS |
– |
MS |
| Sum of unidentified alkenesb |
4.10 |
2.71 |
1.40 |
NS |
– |
MS |
| Subtotal |
88.80 |
86.08 |
10.52 |
NS |
– |
– |
| Aliphatic aldehydes |
|
|
|
|
|
|
| Heptanal |
10.37 |
6.30 |
1.89 |
NS |
903 |
MS+LRI |
| 2-Heptenal |
4.58 |
2.14 |
1.14 |
NS |
962 |
MS+LRI |
| Octanal |
7.66 |
3.70 |
1.26 |
* |
1005 |
MS+LRI |
| 2,4-Heptadienal |
1.78 |
1.15 |
0.56 |
NS |
1014 |
MS+LRI |
| 2-Octenal |
6.29 |
1.96 |
1.07 |
* |
1061 |
MS+LRI |
| Nonanal |
15.97 |
12.10 |
2.47 |
NS |
1106 |
MS+LRI |
| 2-Nonenal |
5.08 |
2.85 |
0.84 |
NS |
1162 |
MS+LRI |
| Decanal |
2.01 |
0.92 |
0.38 |
# |
1208 |
MS+LRI |
| 2-Decenal |
7.25 |
3.98 |
1.12 |
# |
1266 |
MS+LRI |
| 2,4-Decadienal |
8.36 |
2.23 |
1.38 |
** |
1321 |
MS+LRI |
| 2-Undecenal |
4.92 |
2.32 |
0.82 |
NS |
1371 |
MS+LRI |
| Dodecanal |
1.67 |
1.12 |
0.31 |
NS |
1414 |
MS+LRI |
| Tetradecanal |
5.13 |
4.30 |
0.96 |
NS |
1613 |
MS+LRI |
| Subtotal |
81.06 |
45.08 |
12.91 |
# |
|
|
| Aliphatic ketones |
|
|
|
|
|
|
| 2-Heptanone |
3.50 |
1.13 |
0.67 |
* |
890 |
MS+LRI |
| 1-Octen-3-one |
2.70 |
0.48 |
0.57 |
* |
982 |
MS+LRI |
| 2,3-Octanedione |
11.70 |
25.08 |
3.09 |
* |
988 |
MS+LRI |
| 2-Nonanone |
1.43 |
0.88 |
0.36 |
NS |
1092 |
MS+LRI |
| Decan-2-one |
0.50 |
0.14 |
0.26 |
NS |
1193 |
MS+LRI |
| Undecan-2-one |
2.19 |
2.43 |
0.57 |
NS |
1295 |
MS+LRI |
| Tridecan-2-one |
23.90 |
23.24 |
4.44 |
NS |
1498 |
MS+LRI |
| Subtotal |
45.92 |
53.38 |
8.94 |
NS |
|
|
| Aliphatic alcohols |
|
|
|
|
|
|
| 1-Octen-3-ol |
4.18 |
1.66 |
1.37 |
NS |
984 |
MS+LRI |
| Aliphatic acids |
|
|
|
|
|
|
| Decanoic acid |
0.89 |
1.60 |
0.75 |
NS |
1365 |
MS+LRI |
| Dodecanoic acid |
2.76 |
4.13 |
0.43 |
# |
1562 |
MS+LRI |
| Subtotal |
3.65 |
5.74 |
0.84 |
# |
|
|
| Aliphatic esters |
|
|
|
|
|
|
| Dodecanoate ethyl |
15.01 |
3.08 |
6.05 |
NS |
1589 |
MS+LRI |
| Furans |
|
|
|
|
|
|
| Pentil-furan |
9.89 |
9.52 |
4.37 |
NS |
994 |
MS+LRI |
| Benzene compounds |
|
|
|
|
|
|
| p-Xilene |
2.61 |
2.65 |
0.60 |
NS |
867 |
MS+LRI |
| m-Xilene |
1.22 |
0.66 |
0.40 |
NS |
869 |
MS+LRI |
| Benzaldehyde |
2.31 |
3.31 |
1.46 |
NS |
967 |
MS+LRI |
| 1-Phenylethanone |
1.03 |
0.21 |
0.34 |
# |
1070 |
MS+LRI |
| m-Cresol |
1.50 |
0.76 |
0.54 |
NS |
1074 |
MS+LRI |
| Metil-benzoate |
0.21 |
0.21 |
0.13 |
NS |
1098 |
MS+LRI |
| Benzoic acid |
0.32 |
0.23 |
0.23 |
NS |
1159 |
MS+LRI |
| Indole |
5.69 |
1.14 |
1.30 |
* |
1299 |
MS+LRI |
| 1,3-Diisocianate-2-methyl-benzene, |
1.06 |
0.40 |
0.64 |
NS |
1355 |
MS |
| 2,4-Diisocianate-1-methyl-benzene. |
1.99 |
0.54 |
1.47 |
NS |
1361 |
MS |
| Skatole |
0.58 |
2.02 |
0.35 |
* |
1394 |
MS+LRI |
| 2,6-Di-tert-butilbenzoquinone |
7.38 |
3.35 |
2.84 |
NS |
1473 |
MS+LRI |
| 3-Phenyl-decane |
0.69 |
0.71 |
0.22 |
NS |
1570 |
MS+LRI |
| 5-Phenyl-undecane |
1.06 |
0.48 |
0.35 |
NS |
1628 |
MS+LRI |
| 1-Propyl-octyl-benzene |
0.42 |
0.08 |
0.17 |
NS |
1636 |
MS |
| 1-Ethyl-nonyl-benzene |
1.51 |
0.50 |
0.41 |
NS |
1653 |
MS |
| Subtotal |
29.59 |
17.25 |
8.09 |
NS |
|
|
| Sulfur compounds |
|
|
|
|
|
|
| Diethyl disulfide |
4.79 |
4.29 |
0.83 |
NS |
924 |
MS+LRI |
| Sum of unidentified sulfur compoundsb |
1.44 |
2.43 |
0.74 |
NS |
|
|
| Subtotal |
6.23 |
6.72 |
0.85 |
NS |
|
|
| Terpenoids |
|
|
|
|
|
|
| α-Pinene |
1.59 |
8.95 |
2.21 |
* |
937 |
MS+LRI |
| Fenchene |
5.56 |
5.25 |
2.08 |
NS |
955 |
MS+LRI |
| α-Phellandrene |
ND |
0.48 |
0.16 |
– |
1009 |
MS+LRI |
| Limonene |
3.92 |
1.62 |
1.17 |
NS |
1032 |
MS+LRI |
| Eucalyptol |
ND |
2.05 |
1.20 |
– |
1037 |
MS+LRI |
| α-Gurjunene |
ND |
3.66 |
1.01 |
– |
1422 |
MS+LRI |
| β-Gurjunene |
0.20 |
0.52 |
0.23 |
NS |
1449 |
MS+LRI |
| Aromandendrene |
0.78 |
20.62 |
5.16 |
** |
1456 |
MS+LRI |
| Unidentified terpenoid |
39.7 |
37.37 |
5.10 |
NS |
1478 |
MS |
| Subtotal |
51.87 |
80.78 |
9.67 |
* |
|
|
| Unknown compounds |
|
|
|
|
|
|
| Sum of unknown compoundsb |
9.44 |
10.20 |
1.41 |
NS |
|
|
| TOTAL |
342.1 |
319.27 |
40.86 |
NS |
|
|
| SEM: Standard error of the mean. P-level: Level of significance found by analysis of variance: NS, no significant; #, P<0.1; * P<0.05; and ** P>0.01. LRI: Experimental linear retention index.
|
| ND: not-detected (<0.03 ng g−1).
|
| aMS: Mass spectrum identified using NIST/EPA/NIH mass spectral data base and personal interpretation. LRI: Experimental LRI
in agreement with literature values for a DB-5 capillary column (Adams, 2007; Kondjoyan and Berdagué, 1996); NIST database, http://webbook.nist.gov).
|
| bA total of 7 unidentified alkanes (LRI in order of abundance: 1465, 974, 963, 1022, 1374, 1379 and 1357), 5 unidentified alkenes
(LRI: 934, 1035, 940, 885 and 910), 3 sulfur compounds (LRI: 1212, 1260 and 1109) and 9 unknown compounds (LRI: 1536, 1527,
1581, 1384, 1640, 1096, 1331, 1647 and 1631) were detected in fat samples; individual values are not shown for brevity.
|
The predominance of aliphatic hydrocarbons and aldehydes in fat agrees with previous studies into beef fat volatiles (Watanabe et al., 2008; Watkins et al., 2012). The majority of the hydrocarbons, aldehydes and ketones detected could be considered as fatty acid degradation/oxidation products (Frankel, 1982; Mottram, 1998; Narváez-Rivas et al., 2014).
Aldehyde levels were lower in fat from the semi-extensive production system (SE-fat) than in fat from the intensive production
system (I-fat). Statistical differences were found for the levels of octanal, 2-octenal and 2,4-decadienal (P<0.05), and statistical trends for the levels of decanal, 2-decenal and the sum of aldehydes (P<0.1) (Table 1). Aliphatic aldehyde levels in cooked meat are indicative of lipid oxidation/degradation (Shahidi, 2001). Similar to aldehydes, the levels of 2-heptanone and 1-octen-3-one, which are compounds also derived from lipid oxidation/degradation
(Resconi et al., 2012), were lower in the SE-fat. Therefore, SE-fat would have been more stable to lipid oxidation/degradation. This is supported
by a previous study by Soto et al. (2014) using Longissimus dorsi muscle samples from the same animals, where six-day refrigerated-stored semi-extensive beef showed lower levels of thiobarbituric
acid reactive substances than intensive beef (0.25 vs 0.80 mg of malonaldehyde per kg of beef). The higher stability of the lipids from pasture-fed cattle in comparison to those
from intensively grain-fed cattle can been attributed to higher amounts of vitamin E in the former (Descalzo et al., 2005; Humada et al., 2014).
In contrast to that observed for the above-mentioned ketones, the levels of 2,3-octanedione were higher in SE-fat (P<0.05). Several studies have reported higher levels of 2,3-octanedione in meat or fat from ruminants fed on green-forage based
diets than in those from ruminants fed conserved forage- and concentrate-based diets (Vasta and Priolo, 2006; Sivadier et al., 2010; Serrano et al., 2011). In these studies, it has been suggested that 2,3-octanedione could be used as an indicator of a green herbage diet in ruminant
meat. Young et al. (1997) proposed that 2,3-octanedione could originate from the action of lipoxygenase (an enzyme abundant in green leafy tissue)
on linoleic and linolenic acids. On the other hand, this volatile can also be originated from lipid oxidation in meat (Elmore et al., 2004).
Terpenoids, the third group in abundance, could originate from feeding since they are thought to be directly transferred from
the diet, mainly grass, to animal tissues (Vasta and Priolo, 2006; Narváez-Rivas et al., 2012). In fact, different terpenes, together with other volatiles, have been used or proposed as biomarkers to distinguish between
intensive and extensive production systems in pigs (Narváez-Rivas et al., 2008 and 2011) or ruminants (Sivadier et al., 2010; Serrano et al., 2011).
Most of the terpenoids identified in this study have been previously found in beef (Moon et al., 2004; Insausti et al., 2005; Serrano et al., 2011; Vasta et al., 2012). However, to our better knowledge, fenchene, eucalyptol and β-gurgujene have not been reported in previous studies on beef
volatiles. Qualitative and quantitative variations among studies on the terpenoid levels in beef are expected because of their
dependence not only on the extraction method but also on cattle production systems and the botanical composition of grass
and forage which animals can graze on (Cornu et al., 2001; Prache et al., 2005; Vasta and Priolo, 2006).
In this study, terpenoids were more abundant (P<0.05) in the SE-fat than in the I-fat (Table 1). The levels of α-pinene and aromadendrene were higher (P<0.05) in SE-fat, and α-phellandrene, eucalyptol and α-gurjunene were found only in SE-fat. These results agree with previous
studies (Vasta et al., 2012; Serrano et al., 2011; Vasta and Priolo, 2006) which reported that several specific terpenes, i.e., α-pinene and aromadendrene (found in this study) or α-terpinolene,
β-copaene, β-caryophyllene, α-ylangene, germacrene D, α- and γ-cadinene (not found in this study) were present at higher concentrations
in beef from pasture-fed animals than in those fed on conserved forages and/or high-concentrate diets. On the other hand,
also in agreement with these studies, limonene and β-gurjunene were not related to a green herbage or concentrate-based diet.
Finally, statistical differences were also detected in two benzene compounds (Table 1) so as the levels of indole were higher in the I-fat and those of skatole were higher in SE-fat (P<0.05). Among these two compounds, skatole seems to be more markedly influenced by the ruminant dietary regimen (Vasta and Priolo, 2006). The skatole concentration in ruminant fat or meat has been found to be inversely related to the proportion of concentrate in the diet (Calkins and Hodgen, 2007; Vasta et al., 2012; Serrano et al., 2011). Skatole is a lyposoluble compound deriving from the degradation of tryptophan by a microbial action in the rumen (Young et al., 2003; Vasta and Priolo, 2006) and, according to Sheath et al. (2001), tryptophan degradation tends to be higher in forage-based diets as a consequence of a higher protein/non-fibrous carbohydrate
ratio.
3.2. Volatiles in perirenal fat analyzed using SPMETOP
The terpenes of perirenal fat as analyzed using SPME extraction are shown in Table 2. Chromatograms from a sample of both SE-fat and I-fat are shown in Fig. 1. A total of 25 compounds (16 monoterpenes and 9 sesquiterpenes) were detected. Among them, only six (3 monoterpenes: α-pinene,
α-phellandrene and limonene; and 3 sesquiterpenes: α-gurjunene, β-gurjunene and aromadendrene) could be positively identified
by comparing their retention times and the spectral data obtained from the SPME-extraction analysis with those obtained from
the previous Likens-Nickerson-extraction analysis. The rest of compounds were considered as presumptive terpenes. Regarding
the identified terpenes, in agreement with the results presented in Table 1, aromadendrene levels were higher in SE-fat, and α-pinene, α-phellandrene and α-gurjunene were only detected in SE-fat.
|
 Figure 1. Gas chromatography-mass spectrometry (selected monitoring ion mode) chromatograms of terpenes from samples of perirenal fat
of calves reared in intensive and semi-extensive systems. The locations for the identified terpenes showing significant differences
between treatments (Table 2) were numbered as follows: 1, α-pinene; 2, α-phellandrene; 3, monoterpene X; 4, monoterpene XII; 5, α-gurjunene; 6, aromadendrene;
7, sesquiterpene XVI; and 8, sesquiterpene XVII. Figure 1. Gas chromatography-mass spectrometry (selected monitoring ion mode) chromatograms of terpenes from samples of perirenal fat
of calves reared in intensive and semi-extensive systems. The locations for the identified terpenes showing significant differences
between treatments (Table 2) were numbered as follows: 1, α-pinene; 2, α-phellandrene; 3, monoterpene X; 4, monoterpene XII; 5, α-gurjunene; 6, aromadendrene;
7, sesquiterpene XVI; and 8, sesquiterpene XVII.
|
|
Table 2. Terpenes detected in the perirenal fat of calves from different feeding systems (peak area units×10–3, showing in brackets the number of samples where the compounds were detected)
|
Feeding system |
SEM |
P-level
|
LRI |
| Intensive (n=8) |
Semi-extensive (n=8) |
| Positively identified monoterpenesa |
|
|
|
|
|
| α-Pinene |
ND (0) |
102.75 (7) |
35.46 |
– |
934 |
| α-Phellandrene |
ND (0) |
42.15 (4) |
18.15 |
– |
1007 |
| Limonene |
51.23 (8) |
76.51 (8) |
17.06 |
NS |
1030 |
| Subtotal |
51.23 |
221.41 |
62.22 |
# |
|
| Presumptive unidentified monoterpenesb |
|
|
|
|
|
| I |
45.36 (8) |
42.46 (8) |
9.50 |
NS |
1016 |
| II |
30.86 (8) |
31.54 (8) |
8.21 |
NS |
1017 |
| III |
15.42 (7) |
20.33 (7) |
6.88 |
NS |
1024 |
| IV |
25.48 (5) |
24.09 (7) |
8.81 |
NS |
1058 |
| V |
16.38 (7) |
18.75 (7) |
5.55 |
NS |
1083 |
| VI |
9.91 (6) |
18.51 (7) |
4.17 |
NS |
1085 |
| VII |
13.57 (7) |
20.08 (7) |
4.02 |
NS |
1099 |
| VIII |
22.87 (7) |
22.39 (6) |
5.87 |
NS |
1115 |
| IX |
26.62 (8) |
22.10 (6) |
4.36 |
NS |
1166 |
| X |
20.62 (7) |
6.68 (3) |
3.56 |
* |
1219 |
| XI |
172.13 (8) |
149.69 (8) |
11.62 |
NS |
1264 |
| XII |
30.39 (8) |
12.72 (6) |
3.51 |
** |
1368 |
| XIII |
131.13 (8) |
113.73 (8) |
8.46 |
NS |
1373 |
| Subtotal |
560.75 |
503.08 |
29.22 |
NS |
|
| Total monoterpenes |
612.0 |
724.5 |
66.03 |
NS |
|
| Positively identified sesquiterpenesa |
|
|
|
|
|
| α-Gurjunene |
ND (0) |
91.85 (8) |
33.22 |
– |
1422 |
| β-Gurjunene |
63.28 (8) |
73.42 (8) |
7.17 |
NS |
1447 |
| Aromandendrene |
45.63 (8) |
423.07 (8) |
106.71 |
* |
1455 |
| Subtotal |
108.90 |
588.34 |
182.13 |
# |
|
| Presumptive unidentified sesquiterpenesb |
|
|
|
|
|
| XIV |
11.28 (6) |
22.61 (7) |
4.63 |
NS |
1465 |
| XV |
15.51 (8) |
18.39 (8) |
2.52 |
NS |
1476 |
| XVI |
ND (0) |
56.96 (8) |
15.62 |
- |
1505 |
| XVII |
7.76 (7) |
39.24 (8) |
10.79 |
* |
1510 |
| XVIII |
12.23 (6) |
51.15 (8) |
18.68 |
NS |
1553 |
| XIX |
42.71 (8) |
73.77 (8) |
13.58 |
NS |
1615 |
| Subtotal |
89.49 |
262.11 |
37.76 |
** |
|
| Total sesquiterpenes |
198.39 |
850.45 |
165.28 |
* |
|
| Total terpenes |
810.36 |
1574.94 |
226.87 |
# |
|
| SEM: Standard error of the mean. P-level: Level of significance found by analysis of variance: NS, no significant; #, P<0.1; * P<0.05; and ** P<0.01. LRI: Experimental linear retention index. ND: not-detected.
|
| aTerpenes detected from the selected monitored ions by spectral interpretation and identified by comparing and contrasting
the retention times and spectral data for the previously identified terpenes in the simultaneous distillation-extraction analysis
of volatiles (Table 1).
|
| bPresumptive terpenes detected from the selected monitored ions spectra, by spectral interpretation.
|
No significant effect of production system on the sum and most of the presumptive monoterpenes (11 out of 13) was observed.
However, contrary to the above-mentioned trend (higher levels of terpenes in meat from grazing cattle) monoterpenes X and
XII showed lower values in the SE-fat than in the I-fat. On the other hand, the levels of sesquiterpenes were clearly higher
in SE-fat than in I-fat: total presumptive sesquiterpenes and compound XVII showed significant differences, and compound XVI
was not detected in I-fat whereas it was an important compound in SE-fat.
These findings regarding terpenes confirm those observed by Serrano et al. (2011), who found that among the monoterpenes detected in beef fat, only the levels of three of them were affected by grass feeding,
and α-pinene and γ-terpinene were the only two monoterpenes which presented higher levels in the fat from grass-fed animals.
In contrast, sesquiterpenes were more strongly affected by feeding, and thus would have higher potential than monoterpenes
to be used as biomarkers of grass feeding. Moreover, it should be taken into account that the method used in this study for
detecting presumptive terpenes could cause higher interference, and thus a higher occurrence of false positive identification
rates, in monoterpene identification than in sesquiterpenes. This is due to the fact that only two ions were monitored (93
and 196) for monoterpene identification whereas five ions were monitored for sesquiterpene identification.
A PC analysis was performed from the results of the SPME analysis by including the detected terpenes showing significant differences
in the ANOVA (Table 2; Fig. 2). The first and second PCs accounted for 69.1% and 14.7% of the variation, respectively. α-Phellandrene, α-pinene, α-gurjunene,
aromadendrene and terpene XVI had the highest scores in the first PC, while the terpene X and XVII did in the second. The
highest loadings on the PC1 were shown by those terpenes not detected in I-fat (detected only in SE-fat). As can be seen in
the lower part of Fig. 2, fat samples from each system were separated using the PC1 at the level of the coordinate value of 1.0 approximately, so
as I-fat samples are located in the left hand, SE-fat samples in the right hand; furthermore, I-fat samples were more dispersed
than SE-fat samples. Regarding the PC2, most of I-fat samples were in the negative part of the PC2 axis, while most SE-fat
samples were in the positive section. Results indicate that the levels of selected terpene obtained by the SPME-GC/MS method
could be considered as potential pasture-feeding biomarkers in Tudanca calves.
|
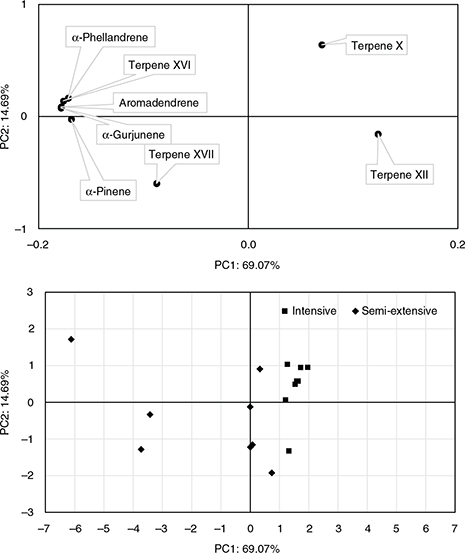 Figure 2. Principal component (PC 1 and PC 2) score plots based on the levels of terpenes showing significant differences between the
semi-extensive and intensive production samples (Table 2): projection of the factor score coefficients for the terpenes used in the analysis (upper) and projection of factor coordinates
for the samples of perirenal fat (lower). Figure 2. Principal component (PC 1 and PC 2) score plots based on the levels of terpenes showing significant differences between the
semi-extensive and intensive production samples (Table 2): projection of the factor score coefficients for the terpenes used in the analysis (upper) and projection of factor coordinates
for the samples of perirenal fat (lower).
|
|
4. CONCLUSIONSTOP
The production system used with Tudanca breed calves affected the volatile composition of their perirenal fat. The main differences
consisted of decreased levels of octanal, 2-octenal and 2,4-decadienal, and increased levels of 2,3-octanedione, skatole,
and the terpenoids α-pinene, aromadendrene, α-phellandrene, eucalyptol and α-gurjunene for semi-extensive (maternal milk,
grass and crushed barley-based) rearing system compared to intensive (concentrate and rye grass silage-based) rearing system.
This study confirms the possibility of using 2,3-octanedione, skatole and several terpenoids of perirenal fat as indicators
of pasture-feeding in calves. The analysis method of sesquiterpenes in perirenal fat using solid phase micro-extraction and
gas-chromatography coupled to mass spectrometry with the detector operating in the selective ion monitoring mode could be
suitable for pasture-feeding discrimination purposes in cattle.
ACKNOWLEDGMENTSTOP
Technical support (C. Cimadevilla from Servicio de Producción Animal-Gobierno de Cantabria and Juan Busqué), field-work support
(Finca Aranda and SERGACAN staff, Guarnizo slaughterhouse veterinary official services and staff), financial support (INIA
RTA 2007-00003-00-00), and individual grants to Sergio Soto (PROMEP-UAEH-156 pre-doctoral fellowship from the Mexican Government)
and to E. Serrano (DOC-INIA-CCAA 2008) are acknowledged.
REFERENCESTOP
| ○ |
Adams RP. 2007. Alphabetical listing of compounds with their retention time and arithmetic retention index on DB-5, in Identification of essential oil components by gas chromatography/mass spectrometry, 4th edition, Allured Publishing Corporation: Illinois, pp. 401.
|
| ○ |
Allen DM, Bougler J, Christensen LG, Jongeling C, Petersen PH, Serventi P. 1982. Cattle. Livest. Prod. Sci. 9, 89–126. http://dx.doi.org/10.1016/0301-6226(82)90068-9.
|
| ○ |
Calkins CR, Hodgen JM. 2007. A fresh look at meat flavor. Meat Sci. 77, 63–80. http://dx.doi.org/10.1016/j.meatsci.2007.04.016.
|
| ○ |
Cornu A, Kondjoyan N, Frencia JP, Berdagué JL. 2001. Deciphering the message from volatile components of fat tissues. Viandes Prod. Carnés 22, 35–38.
|
| ○ |
Descalzo AM, Insani EM, Biolatto A, Sancho AM, García PT, Pensel NA, Josifovich JA. 2005. Influence of pasture or grain-based
diets supplemented with vitamin E on antioxidant/oxidative balance of Argentine beef. Meat Sci. 75, 35–44. http://dx.doi.org/10.1016/j.meatsci.2004.11.018.
|
| ○ |
Elmore JS, Warren HE, Mottram DS, Scollan ND, Enser M, Richardson RI, Wood JD. 2004. A comparison of the aroma volatiles and
fatty acid compositions of grilled beef muscle from Aberdeen Angus and Holstein-Friesian steers fed diets based on silage
or concentrates. Meat Sci. 68, 27–33. http://dx.doi.org/10.1016/j.meatsci.2004.01.010.
|
| ○ |
Frankel EN. 1982. Volatile lipid oxidation products. Prog. Lipid Res. 22, 1–33. http://dx.doi.org/10.1016/0163-7827(83)90002-4.
|
| ○ |
Horrigan L, Lawrence RS, Walker P. 2002. How sustainable agriculture can address the environmental and human health harms
of industrial agriculture. Environ. Health Persp. 110, 445–456.
|
| ○ |
Humada MJ, Sañudo C, Serrano E. 2014. Chemical composition, vitamin E content, lipid oxidation, colour and cooking losses
in meat from Tudanca bulls finished on semi-extensive or intensive systems and slaughtered at 12 or 14 months. Meat Sci. 96, 908–915. http://dx.doi.org/10.1016/j.meatsci.2013.10.004.
|
| ○ |
Humada MJ, Sañudo C, Cimadevilla C, Serrano E. 2013. Production system and slaughter age effects on performance, carcass quality
and profit margin of the production of calves and yearlings from Tudanca breed. ITEA Inf. Tec. Econ. Ag. J. 109, 183–200.
|
| ○ |
Humada MJ, Serrano E, Sañudo C, Rolland DC, Dugan MER. 2012. Production system and slaughter age effects on intramuscular
fatty acids from young Tudanca bulls. Meat Sci. 90, 678–685. http://dx.doi.org/10.1016/j.meatsci.2011.10.013.
|
| ○ |
Insausti K, Goñi V, Petri E, Gorraiz C, Beriain MJ. 2005. Effect of weight at slaughter on the volatile compounds of cooked
beef from Spanish cattle breeds. Meat Sci. 70, 83–90. http://dx.doi.org/10.1016/j.meatsci.2004.12.003.
|
| ○ |
Kondjoyan N, Berdagué JL. 1996. A compilation of relative retention indices for the analysis of aromatic compounds, 1st edition, Laboratoire Flaveur, Institut National de la Reserche Agronomique, Theix, France.
|
| ○ |
Machiels D, Istasse L. 2003. Evaluation of two commercial solid-phase microextraction fibres for the analysis of target aroma
compounds in cooked beef meat. Talanta, 61, 529–537.
|
| ○ |
Moon SY, Li-Chan ECY. 2004. Development of solid-phase microextraction methodology for analysis of headspace volatile compounds
in simulated beef flavour. Food Chem. 88, 141–149. http://dx.doi.org/10.1016/j.foodchem.2004.04.002.
|
| ○ |
Mottram DS. 1998 Flavour formation in meat and meat products: a review. Food Chem. 62, 415–424. http://dx.doi.org/10.1016/S0308-8146(98)00076-4.
|
| ○ |
Narváez-Rivas M, Gallardo E, León-Camacho M. 2012. Analysis of volatile compounds from Iberian hams: a review. Grasas y Aceites 63, 432–454. http://dx.doi.org/10.3989/gya.070112.
|
| ○ |
Narváez-Rivas M, Gallardo E, León-Camacho M. 2014. Chemical changes in volatile aldehydes and ketones from subcutaneous fat
during ripening of Iberian dry-cured ham. Prediction of the curing time. Food Res. Int. 55, 381–390. http://dx.doi.org/10.1016/j.foodres.2013.11.029.
|
| ○ |
Narváez-Rivas M, Pablos F, Jurado JM, León-Camacho M. 2011. Authentication of fattening diet of Iberian pigs according to
their volatile compounds profile from raw subcutaneous fat. Anal. Bioanal. Chem. 399, 2115–2122. http://dx.doi.org/10.1007/s00216-010-4387-z.
|
| ○ |
Narváez-Rivas M, Rios JJ, Artega J, Quilez JF, Barrero AF, León-Camacho M. 2008. Determination of ent-kaurene in subcutaneous
fat of Iberian pigs by gas chromatography multi-stage mass spectrometry with the aim to differentiate between intensive and
extensive fattening systems. Anal. Chim. Acta 624, 107–112. http://dx.doi.org/10.1016/j.aca.2008.06.035.
|
| ○ |
Prache S, Cornu A, Berdagué JL, Priolo A. 2005. Traceability of animal feeding diet in the meat and milk of small ruminants?
Small Ruminant Res. 59, 157–168. http://dx.doi.org/10.1016/j.smallrumres.2005.05.004.
|
| ○ |
Resconi VC, Escudero A, Beltrán JA, Olleta JL, Sañudo C, Campo MM. 2012. Color, lipid oxidation, sensory quality, and aroma
compounds of beef steaks displayed under different levels of oxygen in a modified atmosphere package. J. Food Sci. 77, S10–S18. http://dx.doi.org/10.1111/j.1750-3841.2011.02506.x.
|
| ○ |
Röhrle FT, Moloney AP, Osorio MT, Luciano G, Priolo A, Caplan P, Monahan FJ. 2011. Carotenoid, colour and reflectance measurements
in bovine adipose tissue to discriminate between beef from different feeding systems. Meat Sci. 88, 347–353. http://dx.doi.org/10.1016/j.meatsci.2011.01.005.
|
| ○ |
Serrano E, Cornu A, Kondjoyan N, Agabriel J, Micol D. 2011. Traceability of grass feeding in beef: terpene, 2,3-octanedione
and skatole accumulation in adipose tissue of young bulls. Animal 5, 641–649. http://dx.doi.org/10.1017/S1751731110002296.
|
| ○ |
Shahidi F. 2001. Headspace volatile aldehydes as Indicators of lipid oxidation in foods. Adv. Exp. Med. Biol. 488, 113–123. http://dx.doi.org/10.1007/978-1-4615-1247-9_9.
|
| ○ |
Sheath GW, Coulon JB, Young OA. 2001. Grassland management and animal product quality, in Proceedings of the 42nd International
Grassland Congress, Crop Science Society of America, Sao Paulo, Brazil, pp. 1019–1026.
|
| ○ |
Sivadier G, Ratel J, Engel E. 2010. Persistence of pasture-feeding volatile biomarkers in lamb fats. Food Chem. 118, 418–425. http://dx.doi.org/10.1016/j.foodchem.2009.02.088.
|
| ○ |
Soto S, Fernández-Diez A, Caro I, Humada MJ, Cimadevilla C, Mateo J, Serrano E. 2014. Efecto del sistema de producción sobre
las características de la canal, de la carne y de la grasa de terneros de raza Tudanca, in Proceedings of the 53th Reunión Científica de la Sociedad Española para el Estudio de los Pastos (SEEP), SEEP, Potes, Spain, pp. 437–444.
|
| ○ |
Vasta P, Priolo A. 2006. Ruminant fat volatiles as affected by diet: A review. Meat Sci. 73, 218–228. http://dx.doi.org/10.1016/j.meatsci.2005.11.017.
|
| ○ |
Vasta V, Ventura V, Luciano G, Andronico V, Pagano RI, Scerra M, Biondi L, Avondo M, Priolo A. 2012. The volatile compounds
in lamb fat are affected by the time of grazing. Meat Sci. 90, 451–456. http://dx.doi.org/10.1016/j.meatsci.2011.09.006.
|
| ○ |
Viallon C, Martin B, Verdier-Metz I, Pradel P, Garel JP, Coulon JB, Berdagué JL. 2000. Transfer of monoterpenes and sesquiterpenes
from forages into milk fat. Lait 80, 635–641. http://dx.doi.org/10.1051/lait:2000150.
|
| ○ |
Vieira C, Fernández-Diez A, Mateo J, Bodas R, Soto S, Manso T. 2012. Effects of addition of different vegeTable oils to lactating
dairy ewes’ diet on meat quality characteristics of suckling lambs reared on the ewes’ milk. Meat Sci. 91, 277–283. http://dx.doi.org/10.1016/j.meatsci.2012.02.003.
|
| ○ |
Watanabe A, Ueda M, Higuchi M, Shiba N. 2008. Analysis of volatile compounds in beef fat by dynamic-headspace solid-phase
microextraction combined with gas chromatography–mass spectrometry. J. Food Sci. 73, C420-C425. http://dx.doi.org/10.1111/j.1750-3841.2008.00764.x.
|
| ○ |
Watkins PJ, Rose G, Warner RD, Dunshea FR, Pethick DW. 2012. A comparison of solid-phase microextraction (SPME) with simultaneous
distillation–extraction (SDE) for the analysis of volatile compounds in heated beef and sheep fats. Meat Sci. 91, 99–107. http://dx.doi.org/10.1016/j.meatsci.2011.12.004.
|
| ○ |
Yang A, Brewster MJ, Lanari MC, Tume RK. 2002. Effect of vitamin E supplementation on α-tocopherol and β-carotene concentrations
in tissues from pasture- and grain-fed cattle. Meat Sci. 60, 35–40. http://dx.doi.org/10.1016/S0309-1740(01)00102-4.
|
| ○ |
Young OA, Berdagué JL, Viallon C, Rousset-Akrim S, Thiriez M. 1997. Fat-borne volatiles and sheep meat odour. Meat Sci. 45, 169–181. http://dx.doi.org/10.1016/S0309-1740(96)00100-3.
|
| ○ |
Young OA, Lane GA, Priolo A, Fraser K. 2003. Pastoral and species flavour in lambs raised on pasture, lucerne or maize. J. Sci. Food Agric. 83, 93–104. http://dx.doi.org/10.1002/jsfa.1282.
|