Extra virgin olive oil reduces liver oxidative stress and tissue depletion of long-chain polyunsaturated fatty acids produced
by a high saturated fat diet in mice
R. Valenzuelaa,c,*, M.C. Hernandez-Rodasa, A. Espinosab, M.A. Rincónc, N. Romerod, C. Barreraa, M. Marambioa, J. Viveroa and A. Valenzuelab,e
aNutrition Department, Faculty of Medicine, Universidad de Chile, Santiago, Chile
bMedical Technology Department, Faculty of Medicine, Universidad de Chile
cLipid Center, Institute of Nutrition and Food Technology (INTA), Universidad de Chile
dFaculty of Chemical Sciences and Pharmacy, Department of Food Science and Chemical Technology, Universidad de Chile
eFaculty of Medicine, Universidad de Los Andes, Santiago, Chile
*Corresponding author: rvalenzuelab@med.uchile.cl
| |
SUMMARY
Long-chain polyunsaturated fatty acids (LCPUFA) which are synthesized mainly in the liver have relevant functions in the organism.
A diet high in fat (HFD) generates an increase in the levels of fat and induces oxidative stress (lipo-peroxidation) in the
liver, along with a reduction in tissue n-3 and n-6 LCPUFA. Extra virgin olive oil (EVOO) is rich in anti-oxidants (polyphenols
and tocopherols) which help to prevent the development of oxidative stress. This study evaluated the role of EVOO in preventing
the induction of fat deposition and oxidative stress in the liver and in the depletion of LCPUFA in the liver, erythrocytes
and brain generated by a HFD in C57BL/6J mice. Four experimental groups (n = 10/group) were fed a control diet (CD) or a HFD
for 12 weeks and were respectively supplemented with EVOO (100 mg/day). The group fed HFD showed a significant increase (p
< 0.05) in fat accumulation and oxidative stress in the liver, accompanied by a reduction in the levels of n-3 and n-6 LCPUFA
in the liver, erythrocytes and brain. Supplementation with EVOO mitigated the increase in fat and oxidative stress produced
by HFD in the liver, along with a normalization of LCPUFA levels in the liver, erythrocytes and brain. It is proposed that
EVOO supplementation protects against fat accumulation, and oxidative stress and normalizes n-3 and n-6 LCPUFA depletion induced
in mice fed a HFD.
|
| |
RESUMEN
El aceite de oliva extra virgen reduce el estrés oxidativo hepático y la perdida tisular de ácidos grasos poliinsaturados
de cadena larga en tejidos de ratones alimentados con dieta alta en grasa saturada. Los ácidos grasos poliinsaturados de cadena larga (AGPICL) sintetizados principalmente por el hígado, cumplen funciones
relevantes en el organismo. Una dieta alta en grasa (DAG) genera un incremento en los niveles de grasa y estrés oxidativo
(lipoperoxidación) en hígado y una reducción en los niveles de AGPICL n-3 y n-6 en diferentes tejidos. El aceite de oliva
extra virgen (AOEV) es rico en antioxidantes (polifenoles y tocoferoles) que ayudan a prevenir el desarrollo del estrés oxidativo.
Este trabajo evaluó el rol del AOEV en la prevención del depósito de grasa, estrés oxidativo hepático y reducción de los AGPICL
n-3 y n-6 en diferentes tejidos generado por una DAG en ratones C57BL/6J. Cuatro grupos experimentales (n=10/grupo) fueron
alimentados (12 semanas) con dieta control (DC) o DAG y suplementados con AOEV (100 mg/día). El grupo alimentado con DAG presentó
un incremento (p<0,05) en la acumulación de grasa y estrés oxidativo hepático, acompañado de una reducción en los niveles
de AGPICL n-3 y n-6 en hígado, eritrocitos y cerebro. La suplementación con AOEV logró atenuar el incremento de la grasa y
estrés oxidativo hepático, junto con una normalización en los niveles de AGPICL n-3 y n-6 en los tejidos estudiados. Se propone
que la suplementación con AOEV puede atenuar la acumulación de grasa y el estrés oxidativo hepático, además de normalizar
los niveles de AGPICL, en ratones alimentados con DAG.
|
1. INTRODUCTIONTOP
The physiological and biochemical functions of n-3 and n-6 long-chain polyunsaturated fatty acids (LCPUFA) such as n-3 eicosapentaenoic
acid (C20:5 n-3, EPA) and docosahexaenoic acid (C22:6 n-3, DHA) and n-6 arachidonic acid (C20:4 n-6, AA) are solidly documented
(Valenzuela, 2009; De Caterina, 2011; Bazinet and Layé, 2014). EPA is associated with cardiovascular health, the anti-inflammatory response and the functioning of the immune system (Mozaffarian and Wu, 2012). DHA has a relevant role in the nervous and visual systems (Carlson, 2009). AA is important for the immune system and brain development (Reddy et al., 2015). EPA and DHA are synthesized from the precursor alpha-linolenic acid (C18: 3 n-3, ALA) and AA from linoleic acid (C18:2
n-6, LA). EPA, DHA and AA are formed through elongation and de-saturation of the respective precursor carried out by elongase
and desaturase enzymes (Valenzuela et al., 2012; Valenzuela et al., 2014). The activity of Δ-5 and Δ-6 desaturase enzymes is mainly expressed in the liver and to a lesser extent in other tissues
such as the brain and mammary glands (Nakamura and Nara, 2003; Nakamura and Nara, 2004). The conversion of ALA to EPA and DHA is very low in mammals (rodents and humans) (Valenzuela et al., 2014; Gibson et al., 2011) although it is estimated to be sufficient to obtain the physiological levels of EPA required in erythrocytes and the liver
and of DHA in the brain and visual tissues (Gerster, 1998; Brenna et al., 2009). The formation of AA from LA is not limiting because of the high availability of LA in the typical western diet (Simopoulos, 2011). The activity of desaturases is positively regulated by insulin (Guillou et al., 2010) and is very sensitive to the cellular redox state (Nakamura and Nara, 2004) modified by oxidative stress, which reduces the activity of desaturases (Valenzuela et al., 2015). Oxidative stress produced by reactive oxygen species (free radicals) is associated to lipoperoxidation, which in turn is
associated with the origin and/or progression of many diseases (Videla et al., 2006), being an important component of the deleterious effects of obesity (Videla et al., 2004), and other non-transmissible chronic diseases (Li et al., 2004; Marseglia et al., 2014). A diet high in saturated fat, particularly containing palmitic acid (C16:0), increases liver oxidative stress reducing
n-3 and n-6 LCPUFA (EPA, DHA and AA) in different tissues, such as erythrocytes, brain, heart, liver and adipose tissue (Valenzuela et al., 2015).
Extra virgin olive oil (EVOO) is characterized by health benefits, particularly in cardiovascular health (Visioli et al., 2005). Benefits have been associated to its content of oleic acid (Lim et al., 2013), but also to the content of non-triglyceride substances, such as tocopherols and polyphenols, which have anti-oxidant and
anti-inflammatory effects (Cicerale et al., 2012). This work shows that the induction of oxidative stress and the reduction of the tissue n-3 and n-6 LCPUFA produced by a
HFD in mice can be reversed by supplementing animals with EVOO. The benefit of antioxidants contained in EVOO against the
development of oxidative stress induced by a HFD is discussed.
2. MATERIALS AND METHODSTOP
2.1. Animals, diet and supplementationTOP
Forty male C57BL/6J mice weighing 12–14 g (Central Biotherium, ICBM, Faculty of Medicine, Universidad de Chile) were randomly
assigned into four experimental groups and allowed free access to the specially formulated control or high fat diets.
The composition of the control diet (CD) (expressed as % total calories) was 10% fat, 20% protein, and 70% carbohydrate, with
a caloric value of 3.85 kcal·g–1, free of EPA and DHA, and containing 0.7 g of ALA·100g–1 of diet. The composition of the HFD was 60% fat, 20% protein, and 20% carbohydrate, with a caloric value of 5.24 kcal·g–1, free of EPA and DHA and containing 0.7 g of ALA·100 g–1 of diet. Both diets were obtained from Research Diet INC (Rodent Diet, Product data D12450B and D12492, USA). Table 1 shows the fatty acid composition of the CD and HFD. The CD and HFD animals were separated into four groups (for CD 10+10
animals and for HFD 10+10 animals) and housed in separated cages. One CD group received 100 mg·day–1 of EVOO and the other group an isovolumetric amount of saline. One HFD group also received 100 mg·day–1 of EVOO and the other group isovolumetric saline. EVOO and saline were supplied through oral administration throughout a
period of 12 weeks, thus comprising four experimental groups: (a) CD+saline, (b) CD+EVOO, (c) HDF+ saline, and (d) HFD+EVOO.
Weekly controls of body weight and diet intake were performed throughout the experimental period. At the end of the experimental
period (12th week), the animals were fasted overnight (6–8 h), anesthetized with ketamine and xylazine (150 and 10 mg·kg–1, respectively), and blood, liver and brain samples were extracted and frozen in liquid nitrogen for the assessment of fat
content, oxidative stress parameters and fatty acid composition in the liver and for fatty acid composition in the erythrocytes
and brain. The experimental animal protocols and animal procedures complied with the Guide for the Care and Use of Laboratory
Animals (National Academy of Sciences, NIH Publication 6–23, revised 1985) and were approved by the Bioethics Committee for
Research in Animals, Faculty of Medicine, University of Chile (CBA#580 FMUCH and CBA#0630 FMUCH).
Table 1. Fatty acid composition of the CD and the HFD
|
CD
Fatty acids
(g·100 g–1 diet)
|
HFD
Fatty acids
(g·100 g–1 diet)
|
| C16:0 |
0.64 |
6.47 |
| C18:0 |
0.32 |
3.67 |
| Total SFA |
1.01 |
10.7 |
| C18:1 n-9 |
1.15 |
11.2 |
| Total MUFA |
1.19 |
11.9 |
| 18:2 n-6 (LA) |
1.48 |
7.34 |
| 18:3 n-3 (ALA) |
0.17 |
0.54 |
| 20:4 n-6 (AA) |
0.004 |
0.070 |
| 20:5 n-3 (EPA) |
0.000 |
0.000 |
| 22:6 n-3 (DHA) |
0.000 |
0.000 |
| Total PUFA |
1.66 |
8.30 |
| Fatty acid composition of the CD and the HFD. Values are expressed as g fatty acid per 100 g of diet. Saturated fatty acids
(SFA) correspond to 10:0, 12:0, 14:0, 16:0, 18:0, 20:0 and 22:0. Monounsaturated fatty acids (MUFA) correspond to 14:1 n-7,
16:1 n-7, 18:1 n-9 and 20:1 n-9. Polyunsaturated fatty acids (PUFA) correspond to 18:2 n-6, 18:3 n-3, 20:2 n-6, 20:3 n-3,
20:4 n-6, 20:5 n-3, 22:5 n-3, and 22:6 n-3.
|
2.2. Assays for total fat content and oxidative stress-related parameters in the liverTOP
Once the animals were anesthetized livers were perfused in situ with a cold solution, containing 150 mM KCl and 5 mM Tris
(pH 7.4) to remove blood. The samples were taken for total fat, triacylglycerols, reduced (GSH) and oxidized (GSSG) glutathione,
protein carbonyls, F-2 isoprostanes and thiobarbituric acid reactant (TBARs) assessment. GSH and GSSG were assessed by an
enzymatic recycling method (Rahman et al., 2006). Protein carbonyls, F-2 isoprostanes, TBAR triacylglycerols and free fatty acids were measured using specific kits, according
to the manufacturer’s instructions (Cayman Chemical Company, Ann Arbor, MI, USA, for carbonyls, F-2 isoprostanes and TBARs
and Wiener Lab, Argentina for triacylglycerols).
2.3. Fatty acid profileTOP
The quantitative extraction and separation of total lipids from the liver, erythrocytes and brain was carried out according
to the solvent mixture described by Bligh and Dyer (Bligh and Dyer, 1959) added of butylated hydroxytoluene (BHT) as antioxidant. Erythrocyte and tissue samples were homogenized in ice-cold chloroform/methanol
(2:1 v/v) containing 0.01% BHT in a homogenized Ultraturrax (Janke & Kunkel, Stufen, Germany). Total lipids from erythrocytes
were extracted with chloroform/isopropanol (2:1 v/v). Phospholipids from the liver, erythrocytes and brain were separated
from the total lipid extracts by thin layer chromatography (TLC) on silica gel plates (aluminum sheets 20x20 cm, silica gel
60 F-254; Merck), using the solvent system hexane/diethyl ether/acetic acid (80:20:1 v/v/v). After the development of plates
and solvent evaporation lipid spots were visualized by exposing the plates to a Camag UV (250 nm) lamp designed for TLC. The
solvent system allows for the separation of phospholipids, cholesterol, triacylglycerols and cholesterol esters according
to their relative mobility. Phospholipid spots were removed from the plate with either diethyl ether or chloroform/methanol
(2:1 v/v), according to Ruiz-Gutierrez et al. (1992).
2.4. Preparation and gas chromatographic analysis of fatty acid methyl esters (FAMEs)TOP
FAMEs from the liver, erythrocytes and brain phospholipids were prepared with boron trifluoride (12% methanolic solution)
according to Morrison and Smith (1964), followed by a methanolic sodium hydroxide (0.5N) solution. Phospholipids for FAME synthesis were extracted from the silica
gel spots with 15 mL of chloroform/methanol/water (10:10:1) and evaporated under a nitrogen stream. FAME samples were cooled
and extracted with 0.5 mL of hexane. The FAMEs were separated and quantified by gas-liquid chromatography in an Agilent Hewlett-Packard
equipment (model 7890A, CA, USA) using a capillary column (Agilent HP-88, 100m×0.250 mm; I.D. 0.25 μm) and a flame ionization
detector (FID). The injector temperature was set at 250 °C and the FID temperature at 300 °C. The oven temperature at injection
was initially set at 140 °C and was programmed to increase to 220 °C at a rate of 5 °C per min. Hydrogen was used as the carrier
gas (35 cm per second flow rate) in the column and the inlet split ratio was set at 20:1. The identification and quantification
of FAMEs were achieved by comparing the retention times and the peak area values (%) of the unknown samples with those of
a commercial lipid standard (Nu-Chek Prep Inc). C23:0 was used as internal standard (Nu-Chek Prep Inc, Elysian MN, USA) and
a Hewlett-Packard Chemstation (Palo Alto, CA, USA) data system was used for the peak analysis.
2.5. Statistical analysisTOP
A statistical analysis was performed with GraphPad Prism 6.0 software (GraphPad Prism Software, Inc. San Diego, USA). Values
shown represent the mean±SEM for each experimental group. Evaluations of normality in the data distribution were performed
using the Shapiro Wilk test. Assessment of the statistical significance of differences between mean values was made by the
Newman-Keuls test. A p<0.05 was considered significant. To analyze the association between different variables, the Pearson
correlation coefficient was used.
3. RESULTSTOP
3.1. General and liver physiological parametersTOP
Table 2 shows the general physiological parameters of initial and final body weight, liver weight, visceral adipose weight, and the
liver parameters of total fat, triacylglycerols and free fatty acids obtained from mice fed the CD and HFD and supplemented
with either saline or EVOO. It can be observed that HFD significantly modified the final body weight and the visceral adipose
tissue weight of the animals (Table 2-A). The liver parameters also showed marked differences with respect to total fat, triacylglycerols and free fatty acids
as a result of the HFD ingestion. EVOO supplementation (CD+EVOO) did not modify the general physiological parameters compared
to the CD+saline group. The HFD significantly increased total fat (217%), triacylglycerols (229%), and free fatty acids
(174%) when compared to the CD groups. HFD+EVOO substantially reduced total fat (26%), triacylglycerols (26%) and free fatty
acids (16%) when compared to the HFD+saline group. However, values for the HFD+EVOO were far from those obtained for the
CD+EVOO supplementation, showing that EVOO improved the modification of liver parameters induced by the HFD, but did not
restore these parameters to the levels observed for the CD groups (Table 2-B).
Table 2. General and liver parameters of mice fed the control diet (CD) and the high fat diet (HFD) which received saline
or EVOO supplementation
|
Groups |
|
Control Diet (CD) |
High Fat Diet (HFD) |
|
Saline (a) |
EVOO (b) |
Saline (c) |
EVOO (d) |
| A. General Parameters |
|
|
|
|
| Initial body weight (g) |
14.5±2.2 |
14.5±2.5 |
14.6±1.9 |
14.4±2.6 |
| Final body weight (g) |
33.1±2.8c,d |
34.2±2.9c,d |
42.2±3.9a,b |
43.4±3.5a,b |
| Liver weight (g) |
0.98±0.09 |
0.97±0.7 |
1.21±0.2 |
1.17±0.3 |
| Visceral adipose tissue (g) |
1.08±0.4c,d |
1.09±0.5c,d |
3.94±0.5a,b |
3.68±0.4a,b |
| |
| B. Liver parameters |
|
|
|
|
| Total fat (mg·g–1 liver)
|
34.5±4.9c,d |
30.1±2.9c,d |
109.5±10.5a,b,d |
80.3±8.6a,b,c |
| Triacylglycerols (mg·g–1 liver)
|
31.0±2.5c,d |
26.4±2.2c,d |
102±9.6a,b,d |
75.6±7.8a,b,c |
| Free fatty acid (μM·g–1 liver)
|
276.8±23.5c,d, |
255.6±27.8c,d, |
756.4±50.2a,b,d |
632.2±38.9a,b,c |
| Values represent means±SEM for 7–10 mice per experimental group. Significant differences between the groups are indicated
by the letter identifying each group (p<0.05; one-way ANOVA and the Newman-Keuls´ test).
|
3.2. Liver parameters of oxidative stressTOP
The liver parameters of oxidative stress evaluated from the mice of the CD and HFD groups are presented in Table 3. All parameters of oxidative stress, with the exception of GSSG, were modified by the HFD. GSH levels were significantly
reduced in the HFD+saline compared to the CD groups but were partially restored by EVOO (HFD+EVOO). The other oxidative
parameters (GSH/GSSG, protein carbonyls, F2-isoprostanes, TBARs, and the respective ratios with total GSH, were significantly
increased by the HFD compared with the CD groups. EVOO (HFD+EVOO) reduced these values although they did not reach the levels
observed for the CD+saline or CH+EVOO, with the exemption of the protein carbonyl values which were normalized by EVOO
supplementation. The results showed that oxidative stress induced by a HFD can be mitigated but not avoided by EVOO supplementation
in the doses and time of supplementation applied in this experimental protocol.
Table 3. Parameters of liver oxidative stress of mice fed the control diet (CD) and the high fat diet (HFD) and receiving
EVOO supplementation
|
Groups |
|
Control Diet (CD) |
High Fat Diet (HFD) |
| Liver oxidative stress parameters |
Saline (a) |
EVOO (b) |
Saline (c) |
EVOO (d) |
| GSH (μmol·g–1 liver)
|
5.95±0.5c,d |
6.8±0.5c,d |
3.76±0.3a,b,d |
4.80±0.3a,b,c |
| GSSG (μmol·g–1 liver)
|
0.48±0.04 |
0.43±0.03 |
0.45±0.02 |
0.48±0.03 |
| Total GSH equivalents (μmol·g–1 liver)
|
6.44±0.7c,d |
7.24±0.8c,d |
4.21±0.4a,b,d |
5.28±0.3a,b,c |
| GSH/GSSG ratio |
12.4±1.8c,d |
15.8±2.0c,d |
8.40±0.8a,b,d |
10.1±0.6a,b,c |
| Protein carbonyls (nmol·mg–1 protein)
|
2.3±0.4c |
2.08±0.3c |
4.12±0.6a,b,d |
2.78±0.2c |
| F2-isoprostanes (pg·mg–1 protein)
|
9.08±1.0c,d |
8.94±1.1c,d |
16.5±1.9a,b,d |
12.8±1.3a,b,c |
| TBARs (nmol·mg–1 protein)
|
0.08±0.02c,d |
0.06±0.01c,d |
0.15±0.01a,b,d |
0.10±0.02a,b,c |
| Protein carbonyl/total GSH ratio (arbitrary units) |
0.38±0.01b,c,d |
0.31±0.02a,c,d |
1.10±0.3a,b,d |
0.58±0.02a,b,c |
| F2-isoprostane/total GSH ratio (arbitrary units) |
1.52±0.04b,c,d |
1.31±0.03a,b,c |
4.39±0.5a,b,d |
2.67±0.3a,b,c |
| TBAR/total GSH ratio (arbitrary units) |
0.01±0.001c,d |
0.01±0.001c,d |
0.04±0.01a,b,d |
0.02±0.005a,b,c |
| Values represent means±SEM for 7–10 mice per experimental group. Significant differences between the groups are indicated
by the letter identifying each group (p<0.05; one-way ANOVA and the Newman-Keuls’ test). Total GSH equivalents=GSH+2GSSG.
|
3.3. Fatty acid composition of liver phospholipidsTOP
Table 4 shows the fatty acid composition of phospholipids extracted from the liver of mice from the CD and HFD groups. The EVOO supplementation
of the CD group did not produce any modification in the fatty acid composition compared to the CD+saline. The HFD significantly
reduced the most relevant n-6 (AA) and n-3 (ALA, EPA, DHA) fatty acids and other minor fatty acids as well (18:4 n-3; 20:3
n-6; 20:4 n-3; 22:5 n-6 DPA n-6; 22:5 n-3 DPA n-3). The HFD also reduced total PUFA, total LCPUFA, total n-6 LCPUFA and total
n-3 LCPUFA. The total SFA and n-6 LCPUFA/n-3 LCPUFA ratio were increased and only total MUFA was not modified by the HFD.
These results show that the HFD produced a substantial modification in the fatty acid composition of liver phospholipids.
However, the HFD+EVOO showed a significant difference compared to the HFD+saline group. Supplementation of the HFD group
with EVOO avoided the reduction in ALA, AA, EPA and DHA, and of the other minor fatty acids, showing values similar to those
obtained for the CD groups. The same behavior was observed for total PUFA, total LCPUFA, total n-6 and n-3 LCPUFA and for
the n-6 LCPUFA/n3 LCPUFA ratio. Interestingly, some fatty acids, such as 16:0, LA and 18:3 n-6, and total MUFA, were not modified
by the supplementation of the HFD group with EVOO compared to the CD groups.
Table 4. Fatty acid composition of liver phospholipids obtained from mice fed the control diet (CD) and the high fat diet
(HFD) and receiving EVOO supplementation
|
Fatty acid composition (g·100 g–1 FAME)
|
|
Groups |
|
Control Diet (CD) |
High Fat Diet (HFD) |
| Fatty acid |
Saline (a) |
EVOO (b) |
Saline (c) |
EVOO (d) |
| 16:0 |
36.8±2.3c |
35.7±2.1c |
45.2±3.4a,b,d |
35.9±2.2c |
| 18:1 n-9 |
22.9±1.9b,d |
29.7±2.3a,c |
24.6±2.8b,d |
29.1±2.0a,c |
| 18:2 n-6 (LA) |
13.2±1.3 |
12.4±1.2 |
11.1±1.3 |
14.6±1.0 |
| 18:3 n-6 |
1.05±0.1 |
0.92±0.04 |
0.88±0.05 |
1.03±0.02 |
| 18:3 n-3 (ALA) |
1.14±0.2c |
1.12±0.1c |
0.89±0.1a,b,d |
1.09±0.1c |
| 18:4 n-3 |
0.25±0.06c |
0.24±0.03 c |
0.13±0.01a,b,d |
0.23±0.05c |
| 20:3 n-6 |
0.20±0.03c |
0.21±0.04 c |
0.08±0.04a,b,d |
0.18±0.02c |
| 20:4 n-6 (AA) |
11.8±1.0c |
10.1±0.8c |
7.18±0.7a,b,d |
10.9±0.8c |
| 20:4 n-3 |
0.15±0.0c |
0.14±0.02c |
0.06±0.02a,b,d |
0.12±0.02c |
| 20:5 n-3 (EPA) |
1.06±0.2c |
1.01±0.1c |
0.40±0.02a,b,d |
0.95±0.1c |
| 22:5 n-6 (DPAn-6) |
0.08±0.01c |
0.07±0.02c |
0.03±0.01a,b,d |
0.07±0.03c |
| 22:5 n-6 (DPAn-3) |
0.10±0.01c |
0.09±0.02c |
0.05±0.01a,b,d |
0.08±0.02c |
| 22:6 n-3 (DHA) |
4.19±0.5c |
3.89±0.3c |
2.19±0.2a,b,d |
3.85±0.2c |
| Total SFA |
38.3±3.4c |
33.9±2.3c |
47.2±3.6a,b,d |
37.8±2.7c |
| Total MUFA |
26.9±2.7 |
32.2±2.6 |
29.5±2.1 |
30.8±2.5 |
| Total PUFA |
34.8±3.2c |
33.9±2.1c |
23.3±1.7a,b,d |
31.4±1.8c |
| Total LCPUFA |
18.2±0.9b,c |
15.9±0.5a,c |
10.2±0.8a,b,d |
16.4±1.1c |
| Total n-6 LCPUFA |
12.6±0.8b,c |
10.7±0.6a,c |
7.40±0.1a,b,d |
11.2±0.8c |
| Total n-3 LCPUFA |
5.60±0.3c |
5.21±0.2c |
2.80±0.05a,b,d |
5.20±0.3c |
| n-6 LCPUFA/n-3 LCPUFA ratio |
2.25±0.1c |
2.10±0.1c |
2.60±0.2a,b,d |
2.18±0.1c |
| Values are expressed as g fatty acid per 100 g FAME and represent the mean ± SEM for n=8 mice per experimental group. Significant
differences between the groups are indicated by the letter identifying each group (p<0.05; one-way ANOVA and the Newman-Keuls’
test). Saturated fatty acids (SFA) correspond to 14:0, 16:0 and 18:0. Monounsaturated fatty acids (MUFA) correspond to 14:1
n-7, 16:1 n-7 and 18:1 n-9. Polyunsaturated fatty acids (PUFA) correspond to 18:2 n-6, 18:3 n-3, 20:4 n-6, 20:5 n-3, 22:5
n-3, and 22:6 n-3; n-6 long-chain polyunsaturated fatty acids (LCPUFA) are 20:4 n-6; n-3 LCPUFA are 20:5 n-3, 22:5 n-3, and
22:6 n-3; n-6/n-3 ratio: 20:4 n-6/ (20:5 n-3 + 22:5 n-3 + 22:6 n-3).
|
3.4. Fatty acid composition of erythrocyte phospholipidsTOP
Table 5 shows the fatty acid composition of phospholipids extracted from erythrocytes from the mice of the CD and HFD groups. The
CD+EVOO group did not show differences, when compared to the CD+saline, for 16:0, LA, ALA, AA, 22:5, n-6 DPA n-6, DHA,
total PUFA, total LCPUFA, total n-6 LCPUFA and the n-6 LCPUFA/n-3 LCPUFA ratio. However the CD+EVOO produced a reduction
in EPA and 22:5 n-3 DPA n-3 and increased 18:1 n-9 and total MUFA. HFD+saline produced the greatest reduction in EPA and
22:5 n-3 DPA n-3 were observed for the CD+EVOO, which also reduced DHA, total MUFA, total PUFA, total LCPUFA and total n-3
LCPUFA, increasing by 16:0, the total SFA and n-6 LCPUFA/n-3 LCPUFA ratio. EVOO supplementation to the HFD group restored
the values for EPA, 22:5 n-6 DPA n-6; 22:5 n-3 DPA n-3 and DHA to levels close to the CD+saline and the CD+EVOO. The effect
of EVOO supplementation on mice fed the HFD in erythrocyte phospholipid fatty acids was not as relevant as was observed for
liver phospholipid fatty acids.
Table 5. Fatty acid composition of erythrocyte phospholipids from mice fed the control diet (CD) and the high fat diet (HFD)
and receiving EVOO supplementation
|
Fatty acid composition (g·100 g–1 FAME)
|
|
Groups |
|
Control Diet (CD) |
High Fat Diet (HFD) |
| Fatty acid |
Saline (a) |
EVOO (b) |
Saline (c) |
EVOO (d) |
| 16:0 |
22.4±1.9c,d |
21.1±1.6c,d |
42.1±1.9a,b,d |
38.5±2.6a,c |
| 18:1 n-9 |
21.8±1.5b,d |
26.4±1.8a,c |
19.4±1.6b,d |
25.6±1.6a,c |
| 18:2 n-6 (LA) |
12.4±0.8 |
11.0±0.7 |
10.3±0.8 |
10.9±0.8 |
| 18:3 n-3 (ALA) |
1.16±0.2 |
1.10±0.1 |
0.97±0.06 |
0.99±0.05 |
| 20:4 n-6 (AA) |
14.1±0.8 |
12.7±0.6 |
13.7±0.6 |
13.2±0.5 |
| 20:5 n-3 (EPA) |
2.01±0.3b,c,d |
1.62±0.04a,c |
0.81±0.03a,b,d |
1.57±0.05a,c |
| 22:5 n-6 (DPAn-6) |
0.14±0.02c |
0.10±0.02 |
0.06±0.01a,b,d |
0.11±0.02c |
| 22:5 n-3 (DPAn-3) |
0.80±0.05b,c,d |
0.60±0.04a,c |
0.04±0.01a,b,d |
0.60±0.03a,c |
| 22:6 n-3 (DHA) |
4.03±0.3c,d |
3.80±0.2c |
2.15±0.03a,b,d |
3.60±0.1a,c |
| Total SFA |
39.3±3.3c |
37.3±3.0c |
47.2±2.6a,b,d |
41.8±2.4c |
| Total MUFA |
25.7±1.7b |
30.1±2.1a,c |
23.4±1.8b,d |
27.8±1.9c |
| Total PUFA |
35.0±3.9c |
32.6±2.1 |
29.4±2.0a |
30.4±2.9 |
| Total LCPUFA |
21.1±1.8c |
19.0±1.2 |
16.9±0.9a |
19.1±1.6 |
| Total n-6 LCPUFA |
14.3±0.8 |
12.9±0.4 |
13.8±0.8 |
13.3± |
| Total n-3 LCPUFA |
6.80±0.3b,c,d |
6.10±0.2a,c |
3.10±0.04a,b,d |
5.70±0.2a,c |
| n-6 LCPUFA/n-3 LCPUFA ratio |
2.10±0.4c |
2.11±0.4c |
4.45±0.02a,b,d |
2.33±0.3c |
| Values are expressed as g fatty acid per 100 g FAME and represent the mean ± SEM for n=8 mice per experimental group. Significant
differences between the groups are indicated by the letter identifying each group (p<0.05; one-way ANOVA and the Newman-Keuls’
test). Identification of saturated and unsaturated fatty acids and their relationships are shown in table 4.
|
3.5. Fatty acid composition of brain phospholipidsTOP
Table 6 shows the fatty acid composition of phospholipids extracted from the brain of mice fed the CD and HFD. EVOO supplementation
to the CD group did not produce any modification in the fatty acid composition of the brain showing the high reluctance of
this tissue to this dietary modification. However, the HFD produced a general deterioration in the n-6 and n-3 fatty acid
contents of brain phospholipids because ALA, AA, 22:5 n-6 DPA n-6, 22:5 n-3 DPA n-3, DHA, total PUFA, total LCPUFA, total
n-6 LCPUFA, and total n-3 LCPUFA were reduced to lower levels than observed in the CD groups (saline and EVOO). The HFD also
raised 16:0 and SFA, showing the potential dangerous effect of this diet to this highly sensitive tissue. EVOO supplementation
to the HFD group restored the levels of the main n-6 and n-3 fatty acids to levels similar to the CD groups with the exception
of 22:5 n-6 DPA n-6 and 22:5 n-3 DPA n-3 fatty acids. This protective action was also observed for total n-6 LCPUFA, total
n-3 LCPUFA and the n-6 LCPUFA/n-3 LCPUFA ratio.
Table 6. Fatty acid composition of brain phospholipids from mice fed the control diet (CD) and the high fat diet (HFD) and
receiving EVOO supplementation
|
Fatty acid composition (g·100 g–1 FAME)
|
|
Groups |
|
Control Diet (CD) |
High Fat Diet (HFD) |
| Fatty acid |
Saline (a) |
EVOO (b) |
Saline (c) |
EVOO (d) |
| 16:0 |
38.6±2.4c,d |
37.5±2.1c,d |
46.2±3.4a,b |
43.2±2.6a,b |
| 18:1 n-9 |
21.7±1.9 |
23.4±2.1 |
21.4±1.6 |
24.2±2.0 |
| 18:2 n-6 (LA) |
4.01±0.3 |
3.91±0.2 |
3.88±0.2 |
3.94±0.3 |
| 18:3 n-3 (ALA) |
1.20±0.2c |
1.16±0.3c |
0.63±0.1a,b,d |
1.04±0.2c |
| 20:4 n-6 (AA) |
16.8±1.3c |
16.4±1.1c |
11.9±0.6a,b,d |
15.1±0.8c |
| 20:5 n-3 (EPA) |
0.52±0.03c |
0.49±0.04c |
0.23±0.01a,b,d |
0.49±0.02c |
| 22:5 n-6 (DPAn-6) |
0.22±0.02c,d |
0.23±0.02c,d |
0.84±0.04a,b,d |
0.42±0.01a,b,c |
| 22:5 n-6 (DPAn-3) |
0.50±0.04c,d |
0.48±0.05c,d |
0.25±0.06a,b,d |
0.38±0.02a,b,c |
| 22:6 n-3 (DHA) |
10.2±0.9c |
10.0±0.7c |
7.19±0.6a,b,d |
9.81±0.5c |
| Total SFA |
41.2±3.2c |
40.8±2.8c |
50.6±3.6a,b,d |
45.2±3.7c |
| Total MUFA |
24.3±1.7 |
25.3±1.6 |
22.6±2.0 |
26.1±2.1 |
| Total PUFA |
34.5±2.4c,d |
33.9±2.2c,d |
26.8±1.7a,b |
28.7±1.9a,b |
| Total LCPUFA |
28.3±2.2c |
27.9±1.9c |
20.5±1.8a,b,d |
26.3±1.6c |
| Total n-6 LCPUFA |
17.1±1.1c |
16.8±1.0c |
12.8±1.1a,b,d |
15.6±1.3 |
| Total n-3 LCPUFA |
11.2±0.6c |
11.1±0.8c |
7.70±0.1a,b,d |
10.7±0.8c |
| n-6 LCPUFA/n-3 LCPUFA ratio |
1.53±0.05c |
1.51±0.06c |
1.66±0.05a,b,d |
1.46±0.03c |
| Values are expressed as g fatty acid per 100 g FAME and represent the mean ± SEM for n=8 mice per experimental group. Significant
differences between the groups are indicated by the letter identifying each group (p<0.05; one-way ANOVA and the Newman-Keuls’
test). Identification of saturated and unsaturated fatty acids and their relationships are shown in table 4.
|
3.6. Liver product/precursor ratio for n-3 and n-6 LCPUFATOP
Figure 1 shows the liver product/precursor ratio for n-3 LCPUFA ((EPA+DHA)/ALA) (Figure 1-A) and n-6 LCPUFA (AA/LA) (Figure 1-B) for the different experimental groups. It can be observed that both ratios were strongly modified by the HFD and that
EVOO supplementation to this group restored the ratio to similar values of the ratios observed in the CD groups.
|
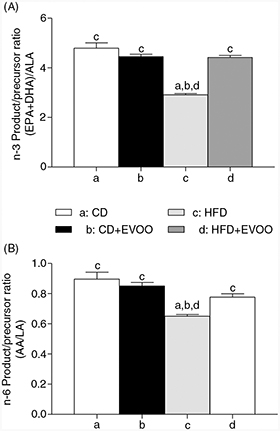 Figure 1. Liver product/precursor ratio for n-3 and n-6 LCPUFA from mice fed the control diet (CD) and the high fat diet (HFD) and receiving
EVOO supplementation. Significant differences between groups are indicated by the letter identifying each group (p<0.05;
one-way ANOVA and the Newman-Keuls’test). Figure 1. Liver product/precursor ratio for n-3 and n-6 LCPUFA from mice fed the control diet (CD) and the high fat diet (HFD) and receiving
EVOO supplementation. Significant differences between groups are indicated by the letter identifying each group (p<0.05;
one-way ANOVA and the Newman-Keuls’test).
|
|
3.7. Correlation of liver oxidative stress parameters (lipoperoxidation) with individual n-6 and n-3 LCPUFATOP
Figure 2 shows the correlation of each parameter of liver oxidative stress with the tissue levels of each n-6 and n-3 LCPUFA. It can
be observed (Figure 2 A to E) that low levels of individual n-6 and n-3 LCPUFA and of total n-6 and n-3 LCPUFA show a high correlation with high
levels of all oxidative stress parameters evaluated in liver tissue.
|
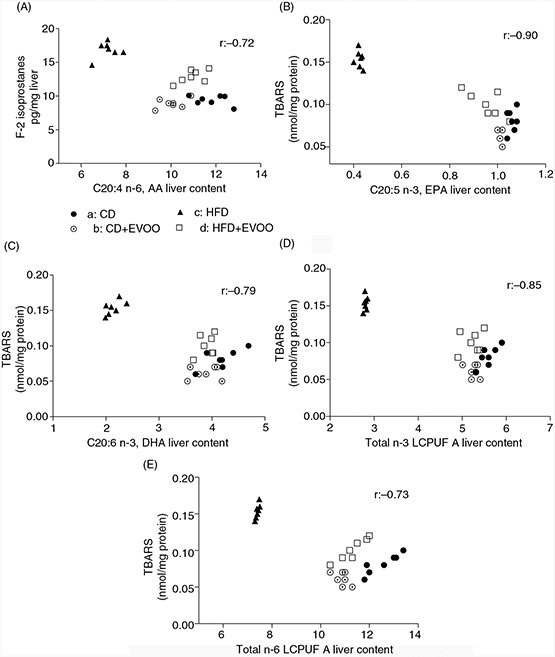 Figure 2. Correlation between liver oxidative stress (lipoperoxidation) and n-3 and n-6 LCPUFA from mice fed the control diet (CD) and
the high fat diet (HFD) and receiving EVOO supplementation. Figure 2. Correlation between liver oxidative stress (lipoperoxidation) and n-3 and n-6 LCPUFA from mice fed the control diet (CD) and
the high fat diet (HFD) and receiving EVOO supplementation.
|
|
4. DISCUSSIONTOP
Feeding animals a HFD produced a significant increase in the final body weight and in the weight of visceral adipose tissue.
In addition, hepatic parameters such as total fat, triacylglycerides and free fatty acids were also increased (Table 2 A-B). These effects reflect a pro-lipogenic (greater activity of fatty acid synthesis) and pro-steatotic (greater fat deposition)
actions of the HFD that are linked to the increase in the liver oxidative stress parameters assayed (Table 3). In this regard, an excess of fat in the liver, and especially free fatty acids, creates a phenomenon of intracellular toxicity
(lipotoxicity) that significantly alters cellular metabolism (Pardo et al., 2015). The HFD also produced an increase in reticular stress in mice which can cause alterations in the folding of hepatic proteins
(Lu et al., 2015), potentially modifying many enzymatic functions (Li et al., 2014). Liver fat accumulation and oxidative stress would be linked to the reduction of the n-3 and n-6 LCPUFA observed in the
liver, erythrocytes and the brain (Tables 4 to 6), effects that may be directly linked to the increase in systemic and hepatic oxidative stress parameters previously observed
in the mice fed the HFD (Valenzuela et al., 2015). It has been described that the accumulation of fat in the liver (from over load of saturated fat and refined carbohydrates
of nutritional origin) generates a decrease in the activity of the nuclear peroxisome proliferator-activated receptor transcription
factor alpha (PPAR-α) as a direct consequence of the reduction in tissue levels of n-3 LCPUFA and, in addition, an increase
in the activity of the sterol regulatory element binding protein transcription factor - 1 c (SREBP-1 c) (Pawlak et al., 2015), thus promoting a pro-lipogenic state, particularly expressed as greater synthesis of 16:0, as shown in tables 4, 5 and 6, and a reduction in the oxidation of fatty acids as a source of energy (Cheng et al., 2015). The fall of the liver levels of n-3 LCPUFA, especially EPA and DHA, also severely affects the development of pro-oxidative
and pro-inflammatory states (Valenzuela et al., 2012) as a result of the reduction in the erythroid nuclear transcription-related factor 2 (Nrf-2) (Kwan et al., 2015) and a strengthening of a hepatic pro-inflammatory state because an increase in the activity of the nuclear transcription
factor kappa-B (NF-κB) (Videla et al., 2009). Regarding these effects it has been shown in HFD-fed mice that dietary supplementation with n-3 LCPUFA for 12 weeks can
prevent the accumulation of fat in the liver, and that the activation of PPAR-α transcription factor and the inactivation
of the hepatic NF-κB transcription factor are relevant participants in this effect (Tapia et al., 2014).
EVOO supplementation during the time and the dose provided in our experimental protocol partially protects liver oxidative
stress and the accumulation of hepatic fat induced by a HFD. EVOO contains a significant amount of anti-oxidants (tocopherols
and polyphenols) (Cicerale et al., 2012) that may protect liver tissue from oxidative stress. Within the polyphenols of EVOO, hydroxytyrosol has been shown to have
the ability to activate the Nrf2, a transcription factor that stimulates the expression of antioxidant enzymes, such as heme
oxigenase-1, glutamate cysteine ligase, glutathione peroxidase, glutathione reductase and catalase (Zhu et al., 2010; Zrelli et al., 2011), thus promoting a better antioxidant response at the intracellular level, which may protects against the oxidation of proteins
(Table 3) and preserve the activity of redox-sensitive enzymes, such as desaturases (Nakamura and Nara, 2004; Valenzuela et al., 2015). Another interesting aspect of EVOO is its high content of 18:1 n-9, which, although it is more stable to lipo-oxidation
compared to PUFAs, can be also oxidized in low quantity, which could generate a protective response as an increase in cellular
antioxidant defenses (Haeiwa et al., 2014). The decrease in n-3 and n-6 LCPUFA observed in the three tissues studied may be a consequence of the oxidative stress induced
by the HFD, which has an impact on the reduction in the activity of desaturase enzymes (Δ-5 and Δ-6 desaturases), as previously
shown (Valenzuela et al., 2015). In this way, the antioxidant components of EVOO would protect the effect of a HFD on the activity of desaturase enzymes
in the liver, on the tissue levels of n-3 and n-6 LCPUFA, on lipo-peroxidation as measured through F2-isoprostanes and TBARS
(Table 3), and on the negative correlation of lipoperoxidation parameters and liver levels of n-3 and n-6 LCPUFA (Figure 2 A to E). The protective effect of EVOO on n-3 and n-6 LCPUFA in the liver may explain the higher levels of these fatty acids
measured in this tissue after EVOO supplementation (Table 4 and Figure 2), thus allowing for a reduction in the increase in fat in the liver, particularly of saturated fatty acids such as palmitic
acid (C16:0), (Tables 4–5). It is interesting to note that the HFD significantly reduced the levels of AA and DHA in the brain, which could be the
result of a lower liver synthesis and/or transport of these fatty acids to the brain and/or to a lower brain activity of AA
and DHA synthesis from their precursors (Valenzuela et al., 2015; Lin et al., 2015). Also palmitic acid, the main fatty acid in the HFD (table 1), induces cellular lipotoxicity, thus altering lipid metabolism in liver cells (Nissar et al., 2015). In this regard, this is a fact of no minor importance, particularly if it is considered that the physiological conversion
of AA and DHA from their 18 carbon atom precursors (LA and ALA) is essential to ensure a proper functioning of the brain (Domenichiello et al., 2014; Domenichiello et al., 2015). In the case of DHA its reduction in membrane phospholipids might reflect the cytoprotective action of neuroprotectins generated
by the release of this fatty acid from phospholipids and subsequent enzymatic metabolism to be transformed into docosanoids
with neuroprotective actions, such as neuroprotectin D-1 (Orr et al., 2013). The restoring of AA and DHA levels observed in the HFD+EVOO group would reflect a normalization of these fatty acids
in the brain, which in turn may result in improved neural functioning. However this is a statement that requires major studies.
The reduction in the n-6 LCPUFA/n-3 LCPUFA ratio by EVOO in the HFD-fed mice (Tables 4 to 6) is another noteworthy aspect because the increase in this ratio favors the development of cardiovascular disease, non-alcoholic
fatty liver disease and other chronic diseases (Simopoulos, 2008; Valenzuela and Videla, 2011). EVOO consumption may be highly advisable for the protection or prevention of these disabling diseases. Results of the present
research open an interesting challenge to study the protective effect of EVOO in HFD at the molecular level, aiming to better
understand the beneficial effect of this noble natural product in the protection of the accumulation of fat and the development
of oxidative stress in the liver and of the depletion of n-6 and n-3 LCPUFA levels in this and other tissues, such as the
brain, induced by a HFD.
5. CONCLUSIONSTOP
Dietary supplementation of mice fed a HFD with EVOO allowed the liver to: i) reduce fat deposition; ii) reduce oxidative stress
and; iii) normalize the loss of n-3 and n-6 LCPUFA. The protective effect of EVOO on n-3 and n-6 LCPUFA was also observed
in phospholipids obtained from erythrocytes and the brain. The results demonstrate the protective action of EVOO against the
physio-pathological effects of a HFD. However, it is necessary to extend these studies on the effect of HFD and the protective
action of EVOO at a molecular level, evaluating the effects of the dietary intervention and of the supplementation with EVOO
on the activity and expression of desaturase enzymes, the changes in the expression of genes involved in the maintenance of
a cellular redox state and the protection against oxidative stress, and in the metabolism of fatty acids. We are currently
working on these issues.
ACKNOWLEDGMENTSTOP
The authors are grateful to the Chilean Endocrinology and Diabetes Society (Soched 2013–04 PROYECT); Vicerrectoria de Investigación,
Universidad de Chile (U-Inicia project) for supporting this study, and to Enlaza-Mundos Program of the Mayor of Medellin (Colombia)-
Agency for Higher Education of Medellin-SAPIENCIA, for the support to co-finance postgraduate study abroad (M.C. Hernandez-Rodas).
REFERENCESTOP
| ○ |
Bazinet RP and Layé S. 2014. Polyunsaturated fatty acids and their metabolites in brain function and disease. Nat. Rev. Neurosci. 15, 771–785.
|
| ○ |
Brenna JT, Salem N Jr., Sinclair AJ, Cunnane SC; International Society for the Study of Fatty Acids and Lipids, ISSFAL. 2009.
alpha-Linolenic acid supplementation and conversion to n-3 long-chain polyunsaturated fatty acids in humans. Prostaglandins Leukot Essent Fatty Acids. 80, 85–91. http://dx.doi.org/10.1016/j.plefa.2009.01.004.
|
| ○ |
Bligh EG and Dyer WJ. 1959. A rapid method of total lipid extraction and purification. Can. J. Biochem. Physiol. 37, 911–917.
|
| ○ |
Carlson SE. 2009. Docosahexaenoic acid supplementation in pregnancy and lactation. Am. J. Clin. Nutr. 89, 678S-684S. http://dx.doi.org/10.3945/ajcn.2008.26811e.
|
| ○ |
Cheng L, Yu Y, Szabo A, Wu Y, Wang H, Camer D, Huang XF. 2015. Palmitic acid induces central leptin resistance and impairs
hepatic glucose and lipid metabolism in male mice. J. Nutr. Biochem. 26, 541–548. http://dx.doi.org/10.1016/j.jnutbio.2014.12.011.
|
| ○ |
Cicerale S, Lucas LJ, Keast RS. 2012. Antimicrobial, antioxidant and anti-inflammatory phenolic activities in extra virgin
olive oil. Curr. Opin. Biotechnol. 23, 129–135. http://dx.doi.org/10.1016/j.copbio.2011.09.006.
|
| ○ |
De Caterina R. 2011. n-3 fatty acids in cardiovascular disease. N. Engl. J. Med. 364, 2439–2450. http://dx.doi.org/10.1056/nejmra1008153.
|
| ○ |
Mozaffarian D and Wu J. 2012. (n-3) fatty acids and cardiovascular health: are effects of EPA and DHA shared or complementary?
J. Nutr. 142, 614S-625S. http://dx.doi.org/10.3945/jn.111.149633.
|
| ○ |
Domenichiello AF, Kitson AP, Bazinet RP. 2015. Is docosahexaenoic acid synthesis from α-linolenic acid sufficient to supply
the adult brain?. Prog. Lipid Res. 59, 54–66. http://dx.doi.org/10.1016/j.plipres.2015.04.002.
|
| ○ |
Domenichiello AF, Chen CT, Trepanier MO, Stavro PM, Bazinet RP. 2014. Whole body synthesis rates of DHA from α-linolenic acid
are greater than brain DHA accretion and uptake rates in adult rats. J. Lipid Res. 55, 62–74. http://dx.doi.org/10.1194/jlr.m042275.
|
| ○ |
Gerster H. 1998. Can adults adequately convert alpha-linolenic acid (18:3n-3) to eicosapentaenoic acid (20:5n-3) and docosahexaenoic
acid (22:6n-3)? Int. J. Vitam. Nutr. 68, 159–173.
|
| ○ |
Gibson RA, Muhlhausler B, Makrides M. 2011. Conversion of linoleic acid and alpha-linolenic acid to long-chain polyunsaturated
fatty acids (LCPUFAs), with a focus on pregnancy, lactation and the first 2 years of life. Matern Child Nutr. 7, 17–26. http://dx.doi.org/10.1111/j.1740-8709.2011.00299.x.
|
| ○ |
Guillou H, Zadravec D, Martin PG, Jacobsson A. 2010. The key roles of elongases and desaturases in mammalian fatty acid metabolism:
Insights from transgenic mice. Prog. Lipid Res. 49, 186–199. http://dx.doi.org/10.1016/j.plipres.2009.12.002.
|
| ○ |
Haeiwa H, Fujita T, Saitoh Y, Miwa N. 2014. Oleic acid promotes adaptability against oxidative stress in 3T3-L1 cells through
lipohormesis. Mol Cell Biochem. 386, 73–83. http://dx.doi.org/10.1007/s11010-013-1846-9.
|
| ○ |
Kwan HY, Niu X, Dai W, Tong T, Chao X, Su T, Chan CL, Lee KC, Fu X, Yi H, Yu H, Li T, Tse AK, Fong WF, Pan SY, Lu A, Yu ZL.
2015. Lipidomic-based investigation into the regulatory effect of Schisandrin B on palmitic acid level in non-alcoholic steatotic
livers. Sci. Rep. 5, 9114. http://dx.doi.org/10.1038/srep09114.
|
| ○ |
Li J, Huang M, Shen X. 2014. The association of oxidative stress and pro-inflammatory cytokines in diabetic patients with
hyperglycemic crisis. J. Diabetes Complications. 28, 662–666. http://dx.doi.org/10.1016/j.jdiacomp.2014.06.008.
|
| ○ |
Li H, Min Q, Ouyang C, Lee J, He C, Zou MH, Xie Z. 2014. AMPK activation prevents excess nutrient-induced hepatic lipid accumulation
by inhibiting mTORC1 signaling and endoplasmic reticulum stress response. Biochim. Biophys. Acta. 1842, 1844–1854. http://dx.doi.org/10.1016/j.bbadis.2014.07.002.
|
| ○ |
Lim JH, Gerhart-Hines Z, Dominy JE, Lee Y, Kim S, Tabata M, Xiang YK, Puigserver P. 2013. Oleic acid stimulates complete oxidation
of fatty acids through protein kinase A-dependent activation of SIRT1-PGC1α complex. J. Biol. Chem. 288, 7117–7126. http://dx.doi.org/10.1074/jbc.m112.415729.
|
| ○ |
Lin LE, Chen CT, Hildebrand KD, Liu Z, Hopperton KE, Bazinet RP. 2015. Chronic dietary n-6 PUFA deprivation leads to conservation
of arachidonic acid and more rapid loss of DHA in rat brain phospholipids. J. Lipid Res. 56, 390–402. http://dx.doi.org/10.1194/jlr.m055590.
|
| ○ |
Lu Y, Cheng J, Chen L, Li C, Chen G, Gui L, Shen B, Zhang Q. Endoplasmic reticulum stress involved in high-fat diet and palmitic
acid-induced vascular damages and fenofibrate intervention. Biochem. Biophys. Res. Commun. 458, 1–7. http://dx.doi.org/10.1016/j.bbrc.2014.12.123.
|
| ○ |
Marseglia L, Manti S, D’Angelo G, Nicotera A, Parisi E, Di Rosa G, Gitto E, Arrigo T. 2014. Oxidative stress in obesity: a
critical component in human diseases. Int. J. Mol Sci. 16, 378–400. http://dx.doi.org/10.3390/ijms16010378.
|
| ○ |
Morrison WR and Smith LM. 1964. Preparation of fatty acid methyl esters and dimethylacetals from lipids with boron fluoride-methanol.
J. Lipid Res. 5, 600–608.
|
| ○ |
Nakamura MT and Nara TY. 2003. Essential fatty acid synthesis and its regulation in mammals. Prostaglandins Leukot Essent Fatty Acids. 68, 145–150. http://dx.doi.org/10.1016/s0952-3278(02)00264-8.
|
| ○ |
Nakamura MT and Nara TY. 2004. Structure, function, and dietary regulation of delta 6, delta 5, and delta9 desaturases. Annu. Rev. Nutr. 24, 345–376. http://dx.doi.org/10.1146/annurev.nutr.24.121803.063211.
|
| ○ |
Nissar AU, Sharma A, Tasduq SA. 2015. Palmitic acid induced lipotoxicity is associated with altered lipid metabolism, enhanced
CYP450 2E1 and intracellular calcium mediated ER stress in human hepatoma cells. Toxicol. Res. 4, 1344–1358. http://dx.doi.org/10.1039/c5tx00101c.
|
| ○ |
Orr SK, Palumbo S, Bosetti F, Mount HT, Kang JX, Greenwood CE, Ma DW, Serhan CN, Bazinet RP. 2013. Unesterified docosahexaenoic
acid is protective in neuroinflammation. J. Neurochem. 127, 78–93. http://dx.doi.org/10.1111/jnc.12392.
|
| ○ |
Pardo V, González-Rodríguez Á, Muntané J, Kozma SC, Valverde ÁM. 2015. Role of hepatocyte S6K1 in palmitic acid-induced endoplasmic
reticulum stress, lipotoxicity, insulin resistance and in oleic acid-induced protection. Food Chem. Toxicol. 80, 298–309. http://dx.doi.org/10.1016/j.fct.2015.03.029.
|
| ○ |
Pawlak M, Lefebvre P, Staels B. 2015. Molecular mechanism of PPARα action and its impact on lipid metabolism, inflammation
and fibrosis in non-alcoholic fatty liver disease. J. Hepatol. 62, 720–33. http://dx.doi.org/10.1016/j.jhep.2014.10.039.
|
| ○ |
Rahman I, Kode A, Biswas SK. 2006. Assay for quantitative determination of glutathione and glutathione disulfide levels using
enzymatic recycling method. Nat. Protoc. 1, 3159–3165. http://dx.doi.org/10.1038/nprot.2006.378.
|
| ○ |
Reddy KK, Vidya Rajan VK, Gupta A, Aparoy P, Reddanna P. 2015. Exploration of binding site pattern in arachidonic acid metabolizing
enzymes, Cyclooxygenases and Lipoxygenases. BMC Res. Notes. 8, 152–162. http://dx.doi.org/10.1186/s13104-015-1101-4.
|
| ○ |
Ruiz-Gutierrez V, Cert A, Rios JJ. 1992. Determination of phospholipid fatty acid and triacylglycerol composition of rat caecal
mucosa. J. Chromatogr. 575, 1–6. http://dx.doi.org/10.1016/0378-4347(92)80497-e.
|
| ○ |
Simopoulos AP. 2008. The importance of the omega-6/omega-3 fatty acid ratio in cardiovascular disease and other chronic diseases.
Exp. Biol. Med. (Maywood). 233, 674–688. http://dx.doi.org/10.3181/0711-mr-311.
|
| ○ |
Simopoulos AP. 2011. Importance of the omega-6/omega-3 balance in health and disease: evolutionary aspects of diet. World Rev. Nutr. Diet. 102, 10–21. http://dx.doi.org/10.1159/000327785.
|
| ○ |
Tapia G, Valenzuela R, Espinosa A, Romanque P, Dossi C, Gonzalez-Mañán D, Videla LA, D’Espessailles A. 2014. N-3 long-chain
PUFA supplementation prevents high fat diet induced mouse liver steatosis and inflammation in relation to PPAR-α upregulation
and NF-κB DNA binding abrogation. Mol. Nutr. Food Res. 58, 1333–1341. http://dx.doi.org/10.1002/mnfr.201300458.
|
| ○ |
Valenzuela A. 2009. Docosahexaenoic acid (DHA), an essential fatty acid for the proper functioning of neuronal cells: Their
role in mood disorders. Grasas Aceites. 60, 203–212. http://dx.doi.org/10.3989/gya.085208.
|
| ○ |
Valenzuela R and Videla LA. 2011. The importance of the long-chain polyunsaturated fatty acid n-6/n-3 ratio in development
of non-alcoholic fatty liver associated with obesity. Food Funct. 2, 644–8. http://dx.doi.org/10.1039/c1fo10133a.
|
| ○ |
Valenzuela R, Espinosa A, González-Mañán D, D’Espessailles A, Fernández V, Videla LA, Tapia G. 2012. N-3 long-chain polyunsaturated
fatty acid supplementation significantly reduces liver oxidative stress in high fat induced steatosis. PLoS One. 7, e46400. http://dx.doi.org/10.1371/journal.pone.0046400.
|
| ○ |
Valenzuela R, Gormáz JG, Masson L, Vizcarra M, Cornejo P, Valenzuela A, Tapia G. 2012. Evaluation of the hepatic bioconversion
of α-linoleic acid (ALA) to eicosapentaenoic acid (EPA) and docosahexahenoic acid (DHA) in rats fed with oils from chia (Salvia hispanica) or rosa mosqueta (Rosa rubiginosa). Grasas Aceites. 63, 61–69. http://dx.doi.org/10.3989/gya.057111.
|
| ○ |
Valenzuela B R, Barrera R C, González-Astorga M, Sanhueza C J, Valenzuela B A. 2014. Alpha linolenic acid (ALA) from Rosa
canina, sacha inchi and chia oils may increase ALA accretion and its conversion into n-3 LCPUFA in diverse tissues of the
rat. Food Funct. 5, 1564–1572. http://dx.doi.org/10.1039/c3fo60688k.
|
| ○ |
Valenzuela R, Barrera C, Espinosa A, Llanos P, Orellana P, Videla LA. 2015. Reduction in the desaturation capacity of the
liver in mice subjected to high fat diet: Relation to LCPUFA depletion in liver and extrahepatic tissues. Prostaglandins Leukot Essent Fatty Acids. 98, 7–14. http://dx.doi.org/10.1016/j.plefa.2015.04.002.
|
| ○ |
Videla LA, Rodrigo R, Orellana M, Fernandez V, Tapia G, Quiñones L, Varela N, Contreras J, Lazarte R, Csendes A, Rojas J,
Maluenda F, Burdiles P, Diaz JC, Smok G, Thielemann L, Poniachik J. 2004. Oxidative stress-related parameters in the liver
of non-alcoholic fatty liver disease patients. Clin. Sci. (Lond). 106, 261–268. http://dx.doi.org/10.1042/cs20030285.
|
| ○ |
Videla LA, Rodrigo R, Araya J, Poniachik J. 2006. Insulin resistance and oxidative stress interdependency in non-alcoholic
fatty liver disease. Trends Mol. Med. 12, 555–558. http://dx.doi.org/10.1016/j.molmed.2006.10.001.
|
| ○ |
Videla LA, Tapia G, Rodrigo R, Pettinelli P, Haim D, Santibañez C, Araya AV, Smok G, Csendes A, Gutierrez L, Rojas J, Castillo
J, Korn O, Maluenda F, Díaz JC, Rencoret G, Poniachik J. 2009. Liver NF-kappaB and AP-1 DNA binding in obese patients. Obesity (Silver Spring). 17, 973–979. http://dx.doi.org/10.1038/oby.2008.601.
|
| ○ |
Visioli F, Caruso D, Grande S, Bosisio R, Villa M, Galli G, Sirtori C, Galli C. 2005. Virgin Olive Oil Study (VOLOS): vasoprotective
potential of extra virgin olive oil in mildly dyslipidemic patients. Eur. J. Nutr. 44, 121–127. http://dx.doi.org/10.1007/s00394-004-0504-0.
|
| ○ |
Zhu L, Liu Z, Feng Z, Hao J, Shen W, Li X, Sun L, Sharman E, Wang Y, Wertz K, Weber P, Shi X, Liu J. 2010. Hydroxytyrosol
protects against oxidative damage by simultaneous activation of mitochondrial biogenesis and phase II detoxifying enzyme systems
in retinal pigment epithelial cells. J. Nutr. Biochem. 21, 1089–1098. http://dx.doi.org/10.1016/j.jnutbio.2009.09.006.
|
| ○ |
Zrelli H, Matsuoka M, Kitazaki S, Zarrouk M, Miyazaki H. 2011. Hydroxytyrosol reduces intracellular reactive oxygen species
levels in vascular endothelial cells by upregulating catalase expression through the AMPK-FOXO3a pathway. Eur J Pharmacol. 660, 275–282. http://dx.doi.org/10.1016/j.ejphar.2011.03.045.
|