Multivariate analysis of seasonal variation in the composition and thermal properties of butterfat with an emphasis on authenticity assessment
J. Tomaszewska-Gras*
Faculty of Food Science and Nutrition, Poznań University of Life Sciences, ul. Wojska Polskiego 31/33, 60-637 Poznań, Poland
*Corresponding author: gras@up.poznan.pl
| |
SUMMARY
The aim of this study was to analyze the seasonal variation in the composition and thermal properties of butterfat (BF) in
order to evaluate the applicability of differential scanning calorimetry (DSC) for the authenticity assessment of butter.
The composition of fatty acids (FA) and triacylglycerols (TAG) and the thermal properties of genuine BF purchased in the summer
and in the winter from six producers were determined. Principal component analysis (PCA) was used to recognize variation and
as a result, all BF samples were classified into two groups: one composed of mixed samples from the summer and winter and
the other comprising only summer BF samples. DSC and GC analysis revealed that the group of only summer BF samples was characterized
by lower melting temperatures and peak heights of low- and medium melting fractions and the highest proportions of unsaturated
FAs (ΣC18:1, ΣC18:2, ΣC18:3). The results indicated that most of the variation in the composition and thermal properties was affected by summer BF samples, which may result from the alternative animal feeding systems employed in the summer season,
i.e., pasture vs. indoor. Therefore, seasonal variation should be taken into consideration during the elaboration of the analytical
method of authenticity assessment.
KEYWORDS: Butter;
DSC;
Fatty acids;
Melting properties;
PCA;
Triacylglycerols
|
| |
RESUMEN
Análisis multifactorial de la variable estacional sobre la composición y las propiedades térmicas de la grasa de mantequilla, con énfasis en la evaluación de la autenticidad. El objetivo de este estudio fue analizar la variable estacional sobre la composición y las propiedades térmicas de grasa
de mantequilla (GM) con el fin de evaluar la aplicabilidad de la calorimetría diferencial de barrido (CDB) en la evaluación
de la autenticidad de la mantequilla. Se determinó la composición de ácidos grasos (AG) y triglicéridos (TG) y las propiedades
térmicas de GM genuina de seis productores en verano e invierno. Se utilizó el análisis de componentes (ACP) principales para
reconocer la variación y, como resultado, todas las muestras de GM se clasificaron en dos grupos: uno compuesto de muestras
mixtas de verano e invierno y los otro que comprende muestras BF solamente de verano. El análisis mediante CDB y cromatografía
gaseosa, mostró que el grupo de la GM de verano se caracteriza por temperaturas de fusión más bajas y alturas de los picos
de las fracciones de bajo y medio punto de fusión y mayores proporciones de AG insaturado (ΣC18:1, ΣC18:2, ΣC18:3). Los resultados
indicaron que la mayor parte de la variación en la composición y las propiedades térmicas se deben a las muestras de GM de
verano, que puede ser debido al sistema de alimentación alternativo utilizado en la temporada de verano: es decir, pasto vs
cobertura. Por lo tanto, la variación estacional se debe tomar en cuenta durante la elaboración del método de análisis para
la evaluación de la autenticidad.
PALABRAS CLAVE: Ácidos grasos;
ACP;
CDB;
Mantequilla;
Propiedades de fusión;
Triglicéridos
|
1. INTRODUCTIONTOP
Butter, next to olive oil, is the most frequently adulterated edible fat (Moore et al., 2012). In recent years, much effort has been put into testing various instrumental methods for the assessment of product authenticity.
These methods include gas chromatography to assay fatty acids (Molkentin and Precht, 1987; Glaeser, 2002) and triacylglycerols, which are presently determined according to the Official method (EC Regulation No. 273/2008), liquid
chromatography (Nogala-Kałucka et al., 2008; Derewiaka et al., 2011), near infrared spectroscopy (Heussen et al., 2007), and differential scanning calorimetry, which is commonly used in studies of milk fat from various animals (Sbihi et al., 2015; Tomaszewska-Gras, 2016b). Authenticity assessment of butter is still a big challenge for analytics. The DSC technique offers a rapid and reproducible
fingerprint method for the detection of adulterants in edible oils and fats (Tan and Che Man, 2002). For the evaluation of DSC applicability, it is crucial to identify the factors affecting measurement repeatability. The
factors connected with sample preparation and conditions of DSC analysis (heating and cooling rates) were analyzed by Tomaszewska-Gras (2013). Heterogeneous organic substances with a complex composition such as food are characterized by the natural variability of
raw material, which should also be considered. All recently published papers concerned variability in the composition and
thermal properties of butter, produced from the milk of cows fed specifically fixed feed enriched with, for example, linseed
(Hurtaud et al., 2010). It was also established that at grazing, milk from dairy cows contains higher levels of unsaturated fatty acids (UFA),
resulting in a more spreadable butter, when compared with milk from cows fed indoors with a corn silage diet (Cullinane et al., 1984; Hurtaud et al., 2002; Schroeder et al., 2003; Couvreur et al., 2006). Ortiz-Gonzalez et al. (2007) evaluated the functional properties of butter obtained from milk with the fat composition modified by altering the profile
of long-chain fatty acids. Relatively few studies concern the composition and thermal properties of commercially available
butters obtained from various producers and different seasons of the year. Shi et al. (2001) found that for anhydrous milk fat originating from the United States and from the same milk supply through a period of 14
months, no significant changes in either composition or crystallization behavior were observed. They concluded that seasonal
variability in milk fat is currently reduced in the United States by feeding strategies. In order to verify these findings,
the aim of this study was to analyze the seasonal variability in the composition and thermal properties of butters from Poland
and Finland.
2. MATERIALS AND METHODSTOP
2.1. MaterialsTOP
The experimental material consisted of commercially available genuine butter samples purchased four times throughout the year:
in the summer (samples from July and September) and in the winter (January and March). Samples of butter designated with numbers
from 1 to 6 originated from various provinces of Poland: Greater Poland (Gostyń - No. 1, Środa Wielkopolska - No. 6, Kościan
- No. 2), Podlaskie (Grajewo - No. 3, Siemiatycze - No. 5), and one from Finland (Helsinki - No. 4).
2.2. Determination of fatty acid methyl esters (FAME) by gas chromatography (GC)TOP
FAME samples were prepared by dissolving 10 mg of liquid butterfat in 1 mL of hexane and adding a 1 mL portion of 1 M sodium
methoxide in a 5 mL sample vial according to Christie and Han (2012). Fatty acid composition was determined by gas chromatography (GC) using a VARIAN 450 chromatograph fitted with an FID detector
and a Supelco SP-2560 capillary highly polar column (75 m × 0.18 mm id × 0.14 μm length). The oven temperature was programmed
to 50 °C and maintained for 1 min, then programmed to increase to 200 °C at 8 °C∙min−1 and held for 10 min. The temperatures of the injector and flame-ionization detector were maintained at 200 °C throughout
the analysis. The carrier gas was helium with a flow rate of 1.0 mL∙min−1 and a split ratio of 58:1. The sample peaks were identified by comparison with peaks of a known standard mixture of FAME
Supelco 37 Comp FAME MIX (Supelco, Bellefonte, PA). The percentage of fatty acids was calculated as the ratio of the partial
area to the total peak area. The data used were the average values of the two replicates of the butterfat sample.
2.3. Determination of triacylglycerols by GCTOP
Triacylglycerols (TAG) were determined in accordance with the Official method as described in annex XX of EC Regulation No.
273/2008. The analysis of TAG was performed in a VARIAN CP 3800 gas chromatograph equipped with an FID detector, using an
Agilent Technologies CP 7521 column (10 m × 0.32 mm × 0.1 μm). Samples of dehydrated butterfat were dissolved with n-heptane
(Merck). The initial oven temperature was set at 80 °C and maintained for 0.5 min. Then the temperature was programmed to
increase to 190 °C at a rate of 50 °C∙min−1, then at a rate of 6 °C∙min−1 to 350 °C, before being maintained at that final temperature for 5 min. The volume of the injected sample was 1 μL. Helium
was used as the carrier gas at a flow rate of 5 mL∙min−1. The temperature of the detector was maintained at 350 °C. The reference material of butterfat BCR-519 was used as the standard
(anhydrous milk fat), as obtained from the Institute for Reference Materials and Measurements (IRMM), Geel, Belgium. Peak
identification was conducted by comparing relative retention times. The peak areas were determined and the TAG percentage
was calculated as the ratio of the partial area to the total area. The data used were the average values of the two replicates
of the butterfat sample.
2.4. Determination of thermal properties by differential scanning calorimetry (DSC)TOP
A Perkin Elmer DSC-7 differential scanning calorimeter (Perkin Elmer, Norwalk, CN, USA) equipped with an Intracooler II and
running under Pyris software was used to examine the melting properties of butterfat. Nitrogen (99.999% purity) was the purge
gas. The DSC calorimeter was calibrated using indium (m.p. 156.6 °C, ΔHf = 28.45 J∙g−1) and n-dodecane (m.p. –9.65 °C, ΔHf = 216.73 J∙g−1). Samples of butterfat (9–10 mg) were weighed into aluminum pans of 20 μL (Perkin Elmer, No. 0219–0062) and hermetically
sealed. The reference was an empty, hermetically sealed aluminum pan. The calibration of the calorimeter was controlled with
capric acid melting (m.p. 31.6 °C). The thermal history of the butterfat was erased by heating the sample to 60 °C in the
calorimeter and holding it for 5 min. Then the sample was cooled to –40 °C at a rate of 5 °C·min−1 and held at –40 °C for 3 min. After this time, the analysis was carried out by heating the sample at 5 °C·min−1 to 60 °C. Three replicates were analyzed for each sample. The following DSC parameters were analyzed from the melting curve
as previously described (Tomaszewska-Gras, 2016a): T1 – melting point of the first peak (melting of the low melting fraction, LMF), T2 – temperature of the second melting peak
of the medium melting fraction (MMF), Tonset was taken as the onset point of the transition, that is, the point at which the baseline intersects the extrapolated slope
of peak T2, Tend – final melting temperature (clarification temperature), and enthalpy ΔH (J∙g−1), determined as the area limited by the melting curve and the baseline, and peak heights h1, h2, and h3 (mW∙g−1) were calculated.
2.5. Statistical analysisTOP
To investigate significant differences (P<0.05) between group means, one-way ANOVA of data was conducted using Statistica 10.0 (StatSoft. Inc., Tulsa, OK., USA). Tukey’s
test was carried out as a post hoc analysis to create statistically homogeneous groups. Multivariate principal component analysis
(PCA) was applied to detect the structure in the relationships among variables and to classify the objects. The data matrix
consisting of variables (DSC parameters, FA, TAG) and objects (type of season and producer) was constructed.
3. RESULTSTOP
3.1. Fatty acid compositionTOP
GC was used to determine the percentage of individual fatty acids in butterfat samples. Principal component analysis (PCA)
was conducted in order to identify the structure of variability in the fatty acid composition depending on the producer and
season of the year. The percentages of individual fatty acids were the analyzed variables. The classification of all samples
was presented as a plot of the first (PC1) versus second (PC2) principal components, which both explain 85% of the initial
variability (Figure 1A). It can be observed that all BF samples were classified into two separate groups. Group I comprises butters only from the
summer originating from producers 3, 4, and 5, whereas group II consists of samples 1, 2, and 6 from the summer and all of
those from the winter (January and March from producers 1–6). In Figure 1A, it can also be observed that the second component PC2 differentiates summer samples (group I) in terms of the type of producer.
The data on fatty acid composition is presented in Table 1 with classification into three groups according to the PCA results. The percentage contribution of the most important fatty
acids found in BF was calculated: saturated fatty acids from C4:0 to C18:0, monounsaturated fatty acid species C14:1 and C16:1,
and total fatty acids of C18:1, C18:2, and C18:3 species. The main differences in composition among the three groups concerned
the proportion of such acids such as saturated fatty acids (C16:0 and C18:0), monounsaturated fatty acids (total C18:1) and
two polyunsaturated fatty acids (C18:2 and C18:3). Statistical analysis of variance showed that the greatest differences among
groups were found in the proportion of palmitic acid (C16:0) and total C18:1 species, which included mainly oleic acid. It
was observed that group II butters from the summer and the whole group from the winter showed considerable similarity in saturated
fatty acid composition, whereas for the percentages of unsaturated acids (ΣC18:1, ΣC18:2, ΣC18:3), significant differences
were shown. Butters from the summer in groups I and II did not differ in percentage of unsaturated fatty acids, whereas significant
differences were observed in the content of C16:0 and C18:0 fatty acids. Group I and II from the summer were characterized
by the greatest proportion of polyunsaturated fatty acids, 3.3% and 3.15%, respectively, in relation to butters from the winter
(1.9%). The higher proportion of unsaturated fatty acids was probably a result of the greater use of grass products. The results
obtained were consistent with previously published data concerning the composition of fatty acids in butter depending on the
season (Palmquist et al., 1993; Larsen et al., 2014; Capuano et al., 2015).
Table 1. Fatty acid composition of summer and winter butterfat (%).
| Saturated fatty acids |
Group I c |
Group II d
|
| Summer |
Summer |
Winter |
| 4:0 |
4.19±0.37 |
3.69±0.42 |
4.06±0.09 |
| 6:0 |
2.14±0.19 |
1.99±0.16 |
2.08±0.05 |
| 8:0 |
1.02±0.09 |
1.01±0.05 |
1.04±0.02 |
| 10:0 |
2.44±0.24 |
2.52±0.09 |
2.47±0.05 |
| 12:0 |
3.10±0.28 |
3.28±0.08 |
3.06±0.06 |
| 14:0 |
11.29±0.62 |
11.56±0.20 |
11.13±0.07 |
| 15:0 |
1.20±0.16 |
1.29±0.06 |
1.14±0.03 |
| 16:0 |
31.45±0.31b
|
34.35±0.70a
|
33.58±0.74a
|
| 17:0 |
0.80±0.15 |
0.74±0.02 |
0.70±0.01 |
| 18:0 |
11.21±0.64a
|
9.72±0.60b
|
9.55±0.10b
|
| monounsaturated |
|
|
|
| 14:1 |
1.04±0.08 |
1.10±0.08 |
1.03±0.04 |
| 16:1 |
2.15±0.31 |
2.40±0.14 |
2.15±0.04 |
| Σ18:1 |
27.64±1.53a
|
26.08±0.60a
|
24.29±0.21b
|
| polyunsaturated |
|
|
|
| Σ18:2 |
2.57±0.10a
|
2.61±0.20a
|
1.57±0.23b
|
| Σ18:3 |
0.73±0.10a
|
0.54±0.03b
|
0.33±0.02c
|
| values presented as mean ± standard deviation. |
| a,bGroup means with different superscripts differ significantly within columns (P<0.05).
|
| cGroup I: samples from the summer (producers 3, 4, and 5).
|
| dGroup II: samples from the summer (producers 1, 2, and 6) and all samples from the winter.
|
|
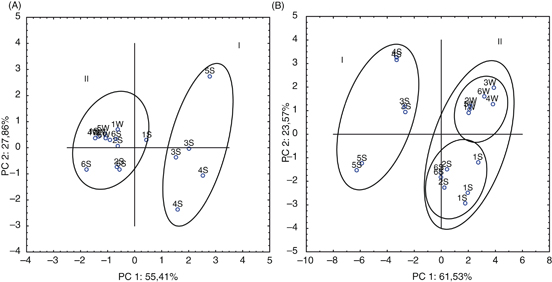 Figure 1. A. The score plot for PC1 and PC2 analysis of the fatty acid composition of butterfat. Percentages of various fatty acids were
variables for PCA. B. The score plot for PC1 and PC2 analysis of TAG composition of butterfat. Percentages of various TAGs (from C24 to C54) were
variables for PCA. W- winter; S - summer. Group I: samples from summer (producers 3, 4, and 5); Group II: samples from summer
(producers 1, 2, and 6) and all from winter. Figure 1. A. The score plot for PC1 and PC2 analysis of the fatty acid composition of butterfat. Percentages of various fatty acids were
variables for PCA. B. The score plot for PC1 and PC2 analysis of TAG composition of butterfat. Percentages of various TAGs (from C24 to C54) were
variables for PCA. W- winter; S - summer. Group I: samples from summer (producers 3, 4, and 5); Group II: samples from summer
(producers 1, 2, and 6) and all from winter.
|
|
3.2. Triacylglycerol compositionTOP
The composition of TAG in the butterfat samples was determined by gas chromatography based on the number of carbon atoms.
Butterfat was found to contain triacylglycerols with carbon numbers ranging from C24 to C54. To show the variability in TAG
proportions, principal component analysis was carried out in which the percentages of individual triacylglycerols were used
as independent variables. The results of PCA are presented in Figure 1B. It was observed that the butterfat samples were classified analogously to the case of fatty acid composition (Figure 1A). Samples from producers 3, 4, and 5 from the summer constituted one group, whereas mixed samples (producers 1, 2, and 6)
from the summer and all samples from the winter were classified into the second group. Both groups were located on the opposite
sides of the PC1 axis (the first principal component). In turn, the second component (PC2) made it possible to distinguish
samples from group I in terms of the type of producer and to distinguish summer from winter samples in group II. Table 2 gives all results with classification of triacylglycerol composition into three groups (I – summer 3, 4, 5; II – summer 1,
2, 6; and III – winter - all samples), analogously as it was presented for fatty acid composition in Table 1. The main differences in TAG composition between groups I and II included significantly (P<0.05) lower percentages of TAG C32 and C44 to C48, and the highest TAG C54 in group I. Compared to the summer groups (I and
II), the highest percentages of C34, C36, and C42 were found in the winter samples. These differences could be related to
lower proportions of palmitic acid (C16:0) and higher proportions of unsaturated fatty acids in group I of the summer samples
(Table 1). It is worth noticing that the percentage of C52 and C54 TAGs is the smallest in the group of winter butters, which is probably
connected with the lowest content of C18:1, C18:2, C18:3, and C18:0 acids in this group. A strong correlation was found for
the three unsaturated acids (C18:1, C18:2, and C18:3) and C52 and C54 TAGs in the three analyzed groups of butter. Pearson’s
correlation coefficients between percentages of unsaturated fatty acids and the percentage of TAG of C52 amounted to 0.99,
0.80, and 0.99, respectively, and for C54, they were 0.94, 0.65, and 0.95, respectively. Other studies reported positive correlations
between C18:0 FA and C50 to C54 TAG, as well as between C4:0 to C14:0 FA and C32 to C38 TAG (Ortiz-Gonzalez et al., 2007; Shi et al., 2001).
Table 2. Triacylglycerol composition of summer and winter butterfat (%).
| |
Group Ic |
Group IId
|
| Summer |
Summer |
Winter |
| C24 |
0.04±0.00 |
0.03±0.01 |
0.04±0.00 |
| C26 |
0.19±0.02 |
0.19±0.02 |
0.20±0.01 |
| C28 |
0.53±0.05 |
0.51±0.01 |
0.57±0.01 |
| C30 |
1.00±0.07 |
1.01±0.01 |
1.11±0.03 |
| C32 |
2.06±0.12b
|
2.36±0.16a
|
2.37±0.07a
|
| C34 |
5.54±0.13b
|
5.94±0.06b
|
6.26±0.23a
|
| C36 |
10.52±0.02b
|
10.92±0.10b
|
11.34±0.18a
|
| C38 |
12.82±0.15 |
12.41±0.06 |
12.57±0.10 |
| C40 |
10.08±0.23 |
9.42±0.08 |
9.54±0.04 |
| C42 |
6.52±0.19b
|
6.80±0.03b
|
7.12±0.10a
|
| C44 |
5.87±0.16b
|
6.50±0.07a
|
6.77±0.10a
|
| C46 |
6.48±0.15b
|
7.24±0.13a
|
7.42±0.12a
|
| C48 |
8.16±0.18b
|
9.02±0.17a
|
8.94±0.22a
|
| C50 |
11.21±0.34 |
11.49±0.10 |
11.06±0.26 |
| C52 |
11.89±0.55a
|
10.67±0.21a
|
9.79±0.30b
|
| C54 |
6.80±0.12a
|
5.15±0.31b
|
4.65±0.21c
|
| values presented as mean ± standard deviation. |
| a,bGroup means with different superscripts differ significantly within columns (P<0.05).
|
| cGroup I: samples from the summer (producers 3, 4, and 5).
|
| dGroup II: samples from the summer (producers 1, 2, and 6) and all samples from the winter.
|
3.3. Thermal propertiesTOP
Figure 2 presents DSC melting curves for samples of butterfat from the summer and winter originating from different producers. It
may be observed that the DSC melting curves of samples from summer differ from those from the winter in terms of temperatures
and peak heights for low-melting fractions (LMF) and medium-melting fractions (MMF). Table 3 presents the results of thermodynamic parameters determined from DSC melting profiles for all butter samples. The group I
of summer butters differs significantly (P<0.05) from group II (summer and winter butters) in terms of temperatures (T1, T2, Tonset), enthalpy of melting (ΔH) and peak height (h2, h3). Buldo et al. (2015) reported that the melting point of the MMF (T2, h2) is positively correlated with the concentration of palmitic acid (C16:0) and negatively correlated with the concentration
of oleic acid (C18:1 cis-9) in butterfat. This statement is in agreement with the results presented here because the first
group of summer BF samples was characterized by the lowest T1, T2, Tonset temperatures and peak heights h1, h2 (Table 3), and the lowest percentage of 16:0, as well as the highest percentage of unsaturated fatty acids (Table 1). Ortiz-Gonzalez et al. (2007) stated that C16:0 is the most relevant in determining the functional properties, e.g., hardness, thermal behavior, and solid
fat content of milk fat. In turn, comparing the summer and winter butterfat samples located in group II, it can be observed
that those two groups differ significantly only in terms of the peak height parameter for the medium melting fraction h2,
which may indicate that TAGs C52 and C54 and unsaturated fatty acids had the greatest effect on these differences. The set
of all thermodynamic data (eight DSC variables) was subjected to PCA, similarly to how it was done in the case of data on
FA and TAG. Figure 3 presents the distribution of all analyzed samples in the plot of two principal components PC1 and PC2, describing 77.1 %
of the total variation. All samples were divided into two groups. Group I of the butterfat samples was created for producers
3, 4, and 5 from summer and was located on the positive side of the PC1 axis, while the remaining samples (summer 1, 2, and
6 and all winter) shown as group II, were found on the negative side of PC1. The classification into two groups in the case
of DSC parameters was similar as for FAs and TAGs based on PCA (Figure 1 A and B).
Table 3. Thermodynamic properties of butterfat samples from summer and winter
| |
|
Temperature (°C) |
Enthalpy (J∙g−1)
|
Peak height (mW∙g−1)
|
| T1 |
Tonset |
T2 |
Tend |
ΔH |
h1 |
h2 |
h3 |
| Group Ic
|
Summer |
3.22a ±0.69
|
7.85a ±0.63
|
13.16a ±0.49
|
34.53a ±0.31
|
66.62a ±1.81
|
128.90a ±4.15
|
318.03a ±12.71
|
133.46a ±1.29
|
| Group IId
|
Summer |
3.71b ±0.51
|
9.25b ±0.39
|
13.57b ±0.18
|
34.82a ±0.19
|
70.46b ±1.49
|
133.64b ±3.30
|
341.23b ±5.19
|
151.52b ±1.56
|
| Winter |
3.85b ±0.42
|
9.66b ±0.33
|
13.83b ±0.34
|
34.84a ±0.27
|
72.02b ±1.45
|
135.53b ±8.39
|
366.14c ±15.78
|
155.18b ±6.80
|
| Values presented as mean ± standard deviation. |
| a,bGroup means with different superscripts differ significantly within columns (P < 0.05).
|
| cGroup I: samples from the summer (producers 3, 4, and 5).
|
| dGroup II: samples from the summer: producers 1, 2, and 6 and all samples from the winter.
|
|
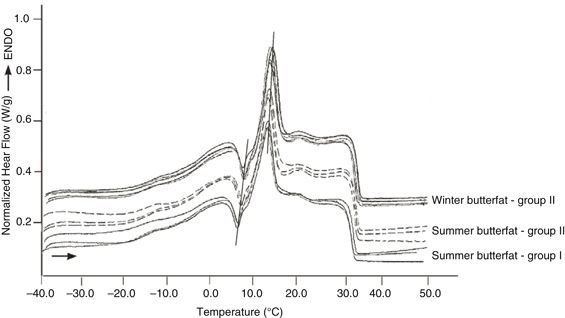 Figure 2. DSC melting curves of BF samples purchased in summer and winter from six various producers. Figure 2. DSC melting curves of BF samples purchased in summer and winter from six various producers.
|
|
|
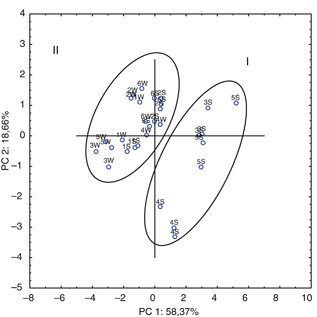 Figure 3. The score plot for PC1 and PC2 analysis of DSC thermodynamic parameters of butterfat melting. Parameters of temperatures,
enthalpies, and peak heights were variables for PCA. W - winter; S - summer. Group I: samples from summer (producers 3, 4,
and 5); Group II: samples from summer (producers 1, 2, and 6) and all from winter. Figure 3. The score plot for PC1 and PC2 analysis of DSC thermodynamic parameters of butterfat melting. Parameters of temperatures,
enthalpies, and peak heights were variables for PCA. W - winter; S - summer. Group I: samples from summer (producers 3, 4,
and 5); Group II: samples from summer (producers 1, 2, and 6) and all from winter.
|
|
4. DISCUSSIONTOP
To summarize, the current study has shown a seasonal effect on FA and TAG composition and thermal properties. PCA was used
to recognize the structure of the variation. The first principal component PC1 obtained for FAs, TAGs, and DSC data distinguished
BF samples in terms of the season, while the second component PC2 provided the distinction in terms of producers, but only
in the case of some BF samples collected in the summer. This indicates that most of the variation in composition and thermal
properties is caused by summer BF samples. The results presented here provide important information for developing new instrumental
methods of authenticity assessment, including chromatography or differential scanning calorimetry. In this study, it was shown
that peak height values from DSC curves ranged from 128.9 to 135.5 mW∙g−1 for h1 and from 318.0 to 366.1 mW∙g−1 for h2. As it was shown by Tomaszewska-Gras (2016a), the thermal parameters, which show a linear dependence on the concentration of added palm oil to butterfat, are peak heights
of LMF (h1) and MMF (h2). It was presented that the addition of 5% palm oil caused an increase in the peak height parameter h1 to a value of 163.2 mW∙g−1, whereas for h2 it was decreased to 283.1 mW∙g−1. This indicates that the range of seasonal variation in the tested butterfat samples was smaller than the one caused by the
addition of 5% of palm oil. This confirms the applicability of the DSC technique for the authenticity assessment of butter.
5. CONCLUSIONSTOP
In conclusion, the results obtained in this study confirm that for winter samples of BF, the variation in FA and TAG composition,
as well as in the thermodynamic parameters, was smaller than in the case of BF from the summer season. In that group, significant
differences among various producers for all tested parameters were found, which may result from the alternative animal feeding
systems in the summer season, i.e., pasture vs. indoor. However, the range of seasonal variation of all tested BF samples
is smaller than after the addition of 5% palm oil.
ACKNOWLEDGMENTSTOP
This research was financially supported by the National Science Centre, by Grant No. NN 312 260538.
REFERENCESTOP
| ○ |
Buldo P, Larsen MK, Wiking L. 2013. Multivariate data analysis for finding the relevant fatty acids contributing to the melting fractions of cream. J. Sci. Food Agric. 93, 1620–1625. http://dx.doi.org/10.1002/jsfa.5934
|
| ○ |
Capuano E, Gravink R, Boerrigter-Eenling R, van Ruth SM. 2015. Fatty acid and triglycerides profiling of retail organic, conventional and pasture milk: Implications for health and authenticity. Int. Dairy J. 42, 58–63. http://dx.doi.org/10.1016/j.idairyj.2014.11.002
|
| ○ |
Christie WW, Han X. 2012. Lipid Analysis. Oily Press Lipid Library Series, Woodhead Publishing. http://dx.doi.org/10.1533/9780857097866.145
|
| ○ |
Couvreur S, Hurtaud C, Lopez C, Delaby L, Peyraud JL. 2006. The linear relationship between the proportion of fresh grass in the cow diet, milk fatty acid composition, and butter properties. J. Dairy Sci. 89, 1956–1969. http://dx.doi.org/10.3168/jds.S0022-0302(06)72263-9
|
| ○ |
Cullinane N, Aherne S, Connolly JF, Phelan JA. 1984.Seasonal variation in the triglyceride and fatty acid composition of Irish butter. Irish J. Food Sci. Technol. 8, 1–12.
|
| ○ |
Glaeser H. 2002. Determination of the milk fat content of fat mixtures. Grasas Aceites 53, 357–358. http://dx.doi.org/10.3989/gya.2002.v53.i3.329
|
| ○ |
Derewiaka D, Sosińska E, Obiedziński M, Krogulec A, Czaplicki S. 2011. Determination of the adulteration of butter. Eur. J. Lipid Sci. Tech. 113, 1005–1011. http://dx.doi.org/10.1002/ejlt.201100006
|
| ○ |
EC REGULATION No. 273/2008 of 5 March 2008 laying down detailed rules for the application of Council Regulation (EC) No. 1255/1999
as regards methods for the analysis and quality evaluation of milk and milk products.
|
| ○ |
Heussen PCM, Janssen H-G, Samwel IBM, van Duynhoven JPM. 2007. The use of multivariate modelling of near infra-red spectra
to predict the butter fat content of spreads. Anal. Chim. Acta 595, 176–181. http://dx.doi.org/10.1016/j.aca.2007.01.048
|
| ○ |
Hurtaud C, Delaby L, Peyraud JL. 2002. Evolution of milk composition and butter properties during the transition between winter-feeding
and pasture. Grassl. Sci. Eur. 7, 574–575.
|
| ○ |
Hurtaud C, Faucon F, Couvreur S, Peyrault JL. 2010. Linear relationship between increasing amounts of extruded linseed in
dairy cow diet and milk fatty acid composition and butter properties. J. Dairy Sci. 93, 1429–1443. http://dx.doi.org/10.3168/jds.2009-2839
|
| ○ |
Larsen K, Andersen KK, Kaufmann N, Wiking L. 2014. Seasonal variation in the composition and melting behavior of milk fat.
J. Dairy Sci. 97, 4703–4712. http://dx.doi.org/10.3168/jds.2013-7858
|
| ○ |
Molkentin J, Precht D. 1987. Representative determination of the butyric acid content in European milk fats. Milchwissenschaft 52, 82–85.
|
| ○ |
Moore JC, Spink J, Lipp M. 2012. Development and application of a database of food ingredient fraud and economically motivated
adulteration from 1980 to 2010. J. Food Sci. 77, 118–126. http://dx.doi.org/10.1111/j.1750-3841.2012.02657.x
|
| ○ |
Nogala-Kałucka M, Pikul J, Siger A. 2008. Applying liquid chromatography (HPLC) to study the genuineness of butter. Zywn.-Nauk. Technol. Ja 58, 47–56.
|
| ○ |
Ortíz-González G, Jiménez-Flores R, Bremmer DR, Clark JH, De Peters EJ, Schmidt SJ, Drackley JK. 2007. Functional properties
of butter oil made from bovine milk with experimentally altered fat composition. J. Dairy Sci. 90, 5018–5031. http://dx.doi.org/10.3168/jds.2007-0137
|
| ○ |
Palmquist DL, Beaulieu AD, Barbano DM. 1993. Feed and animal factors influencing milk fat composition. J. Dairy Sci. 76, 1753–1771. http://dx.doi.org/10.3168/jds.S0022-0302(93)77508-6
|
| ○ |
Schroeder GF, Delahoy JE, Vidaurreta I, Bargo F, Gagliostro GA, Muller LD. 2003. Milk fatty acid composition of cows fed a
total mixed ration or pasture plus concentrate replacing corn with fat. J. Dairy Sci. 86, 3237–3248. http://dx.doi.org/10.3168/jds.S0022-0302(03)73927-7
|
| ○ |
Shi Y, Smith CM, Hartel RWJ. 2001. Compositional Effects on Milk Fat Crystallization. Dairy Sci. 84, 2392–2401. http://dx.doi.org/10.3168/jds.S0022-0302(01)74688-7
|
| ○ |
Sbihi HM, Nehdi IA, Tan CP, Al-Resayes SI. 2015. Characteristics and fatty acid composition of milk fat from Saudi Aradi goat.
Grasas Aceites 66, e101. http://dx.doi.org/10.3989/gya.0233151
|
| ○ |
Tan CP, Che Man YB. 2002. Comparative differential scanning calorimetric analysis of vegetable oils: I. Effects of heating
rate variation. Phytochem. Anal. 13, 129–141. http://dx.doi.org/10.1002/pca.633
|
| ○ |
Tomaszewska-Gras J. 2013. Melting and crystallization DSC profiles of milk fat depending on selected factors. J. Therm. Anal. Calorim. 113, 199–208. http://dx.doi.org/10.1007/s10973-013-3087-2
|
| ○ |
Tomaszewska-Gras J. 2016a. Rapid quantitative determination of butter adulteration with palm oil using the DSC technique.
Food Control. 60, 629–635. http://dx.doi.org/10.1016/j.foodcont.2015.09.001
|
| ○ |
Tomaszewska-Gras J. 2016b. DSC coupled with PCA analysis as a tool for butter authenticity assessment. J. Therm. Anal. Calorim. 126, 61–68. http://dx.doi.org/10.1007/s10973-016-5346-5
|