Physiochemical characteristics, fatty acid profile and tocopherol composition of the oil from Camellia oleifera Abel cultivated in Henan, China
J.B. Hua and G.L. Yangb,*
aSchool of Chemical Science and Engineering, Henan University of Technology, Zhengzhou 450001, Henan, P R China
bLipid Chemistry and Engineering, School of Food Science and Engineering, Henan University of Technology, Zhengzhou 450001, Henan, P R China
*Corresponding author: glyanghaut@hotmail.com
| |
SUMMARY
As a unique woody oil tree, Camellia oleifera Abel originates from southern China and is now being cultivated in central China, such as the southern Henan province. The aim of this work is to determine some physiochemical parameters, fatty acid profile and tocopherol composition of the Camellia oleifera seed oils harvested in southern Henan in the 2016 season. The lipid contents of the kernel are in the range of 28.39-56.94% on dry matter. The acid value (AV), saponification value (SV), iodine value (IV), and refractive index of the oils are in the ranges: 0.22-5.17 mg KOH/g, 178.90-196.91 mg KOH/g, 82.0-87.1 g I2/100g, and 1.4667-1.4720  , respectively. The main fatty acids are: palmitic 7.07-9.52%, palmitoleic 0.09-0.22%, stearic 1.45-2.94%, oleic 77.02-84.33%, linoleic 5.19-11.23%, linolenic 0.53-0.70% and arachidic 0.22-0.70%. The sn-2 fatty acid composition is: 84.36-91.33% oleic, 7.14-14.22% linoleic, and 0.89-1.96% others. The tocopherol content is in the range of 39.55-75.94 mg/100g oil, including mainly α-tocopherol (33.98-67.82 mg/100g) and γ-tocopherol (5.57-8.27 mg/100g) when the oils are extracted with hexane; and 14.91-44.36 mg/100g, including mainly α-tocopherol (9.42-37.08 mg/100g) and γ-tocopherol (5.50-7.33 mg/100g) when the oils are extracted by ethyl ether. The physiochemical properties C. oleifera seed oils from southern Henan are similar to those from other districts of China. , respectively. The main fatty acids are: palmitic 7.07-9.52%, palmitoleic 0.09-0.22%, stearic 1.45-2.94%, oleic 77.02-84.33%, linoleic 5.19-11.23%, linolenic 0.53-0.70% and arachidic 0.22-0.70%. The sn-2 fatty acid composition is: 84.36-91.33% oleic, 7.14-14.22% linoleic, and 0.89-1.96% others. The tocopherol content is in the range of 39.55-75.94 mg/100g oil, including mainly α-tocopherol (33.98-67.82 mg/100g) and γ-tocopherol (5.57-8.27 mg/100g) when the oils are extracted with hexane; and 14.91-44.36 mg/100g, including mainly α-tocopherol (9.42-37.08 mg/100g) and γ-tocopherol (5.50-7.33 mg/100g) when the oils are extracted by ethyl ether. The physiochemical properties C. oleifera seed oils from southern Henan are similar to those from other districts of China.
|
| |
RESUMEN
Características fisicoquímicas, perfil de ácidos grasos y composición de tocoferoles de aceites de Camellia oleifera Abel cultivadas en Henan, China. Camellia oleifera Abel es una planta leñosa única, proveniente del sur de China que ahora es cultivada también en el centro del país, en la provincia de Henan. El objetivo de este trabajo es determinar las propiedades fisicoquímicas, el perfil de ácidos grasos y la composición de tocoferoles de aceites de semillas de Camellia oleífera de semillas recogidas en el sur de esta provincia en la temporada 2016. El contenido de lípidos del grano está en el rango de 28.39-56.94% sobre materia seca. La acidez, índice de saponificación, índice de yodo e índice de refracción se encuentran en los rangos: 0.22-5.17 mg KOH/g, 178.90-196.91 mg KOH/g, 82.0-87.1 g I2/100g y 1.4667-1.4720 , respectivamente. La composición en ácidos grasos fue: 7.07-9.52% palmítico, 0.09-0.22% palmitoleico, 1.45-2.94% esteárico, 77.02-84.33% oleico, 5.19-11.23% linoleico, 0.53-0.70% linolénico y 0.22-0.70% araquídico. La composición en ácido graso en sn-2: 84,36-91,33% de ácido oleico, 7,14-14,22% de linoleico y 0,89-1,96% de otros. El contenido de tocoferoles está en el rango: 39.55-75.94 mg/100 g, y se componen principalmente de α-tocoferol (33,98-67,82 mg/100 g) y γ-tocoferol (5,57-8,27 mg/100 g) cuando los aceites se extraen con hexano y 14,91-44,36 mg/100 g, formados por α-tocoferol (9,42-37,08 mg/100 g) y γ-tocoferol (5,50-7,33 mg/100 g) en aceites extraídos con éter etílico. Las propiedades fisicoquímicas de los aceites de semillas de C. oleifera del sur de Henan son similares a los de otros distritos de China.
|
1. INTRODUCTIONTOP
The seeds of the camellia (Camellia oleifera Abel, Theaceae) have been utilized in China for more than 1000 years (Shanan and Ying, 1982). Camellia oleifera oil is a popular cooking oil in south China, with a unique flavor and health benefits, especially in the Huan and Jiangxi provinces, where more than 50% of the vegetable cooking oil is from C. oleifera seeds (Tang et al., 1993). Because some characteristics of the C. oleifera oil are distinctly similar to those of olive oil, it is also called oriental olive oil (Tang et al., 1993). Numerous studies have shown that C. oleifera oil have many physiological functions (Akihisa et al., 1997; Cheng et al., 2014; Lee and Yen, 2006; Li et al., 2011; Miura et al., 2007; Sahari and Amooi, 2013; Tu et al., 2017), which improve the economic value and broaden the utilization of C. oleifera oil. The C. oleifera is cultivated mainly in Hunan, Jiangxi, Guangxi, followed by Guizhou, Fujian, Guangdong, Zhejiang, Chongqing, Hubei, Sichuan and Yunnan in China (He and He, 2002). Recently, C. oleifera Abel has been cultivated widely in southern Henan of China (Yao et al., 2011; Wang et al., 2008).
The kernel of C. oleifera seed is rich in oil/lipid and polysaccharide (Yu et al., 2013). The oil/lipid content of the C. oleifera seed and fatty acid composition of its oil are affected by the variety, cultivated soil and surrounding climate (Guo et al., 2013; Yao et al., 2011; Yu et al., 1999). The research is mainly focused on the oil content of C. oleifera seeds, the iodine value, saponification value and refractive index and the fatty acid composition of the oils from these seeds cultivated in Hunan, Jiangxi, Guangxi, Zhejiang, Yunnan, Sichuan, Guizhou, Guangdong and Hubei of China have been evaluated (Chen, et al., 2011; Chen et al., 2012; Cheng et al., 2010; Dong et al., 2012; Guo et al., 2008; Guo et al., 2013; Ma et al., 2011; Xi et al., 2006; Yao et al., 2011; Yu et al., 2013; Yuan et al., 2013). Few reports on the minor components (such as Vitamin E and carotene) in C. oleifera oil are available. Li et al. (2009) analyzed the lipo-soluble vitamin, β-carotene in the seed, oil and shell of C. oleifera cultivated in Guizhou (China) by HPLC. The results showed that α- and γ-tocopherol existed in the C. oleifera seed, oil and shell, and a very small amount of the β-carotene existed in the crude oil, seed and shell of C. oleifera.
However, little information on the physicochemical characterization of the oil obtained from the seeds of C. oleifera Abel cultivated in southern Henan of China is available. Yao et al. and Wang et al. analyzed the lipid content of the C. oleifera seeds cultivated in southern Henan of China and the fatty acid composition of the oils from these seeds (Yao et al., 2011; Wang et al., 2008). This investigation was undertaken to determine the physicochemical properties, fatty acid compositions, stereospecific positional distribution of the fatty acids and the tocopherol composition of the oils extracted from C. oleifera Abel grown in south Henan of China, and to compare these results with those of the C. oleifera oil and the seed oils from other camellia species shown in previous work.
2. MATERIALS AND METHODSTOP
2.1. MaterialsTOP
Twenty-two samples of C. oleifera Abel seeds were collected from South Henan (China), harvested on November 2016. Each sample consisted of about 1.5 kg. These samples were divided into four groups based on the cultivation districts: (1) Guangshan (Gs, n=7; YuGuang variety), (2) Shangcheng (Sc, n=5; YuShang variety), (3) Xinxian (Xx, n=5; YuXin variety), (4) Luoshan (Ls, n=5; YuLuo variety). The detailed information is shown in Figure 1, which describes the places of origin. The standard fatty acid methyl esters (palmitic, stearic, oleic, linoleic, linolenic, and arachidic) and tocopherols (α-, β-, δ-, and γ), pancreatic lipase for the sn-2 position analysis were purchased from Sigma-Aldrich (Shanghai) Trading Co. Ltd (Shanghai, China). Silica gel used for TLC plate preparation was obtained from Qingdao Ocean Chemical Factory (Qingdao, China). The hexane for the fatty acid composition analysis was chromatographic grade, and the other reagents and solvents from local sources were of analytical grade and purified before use.
|
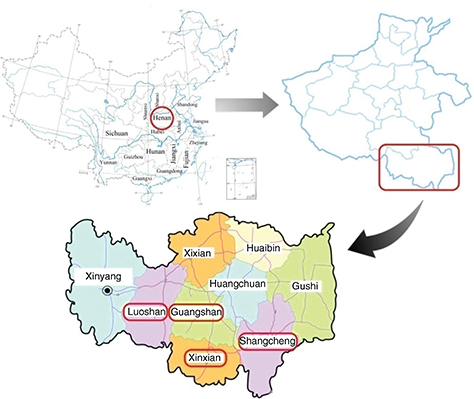 Figure 1. Geographical location of the four Camellia oleifera Abel cultivation zones in south Henan, China Figure 1. Geographical location of the four Camellia oleifera Abel cultivation zones in south Henan, China
|
|
2.2. Extraction of oil from C. oleifera seedTOP
After removal of the hull, the seed was ground into a fine paste using a laboratory grinder. The paste was subjected to Soxhlet extraction with petroleum ether (boiling point, 60-90 °C) or ethyl ester for 8h. Briefly, ground seed (about 50g) was packed in a cellulose thimble, and the open end of the thimble was plugged with cotton to avoid spillage of the seed paste into the miscella. After extraction, a clear miscella was obtained and hence the crude C. oleifera oil was obtained after the removal of solvent from the miscella under vacuum.
2.3. Analysis methodsTOP
The lipid content of C. oleifera seed was analyzed according to the IUPAC method (1.122) (Paquot and Hauntfenne, 1987). The important physicochemical properties of the crude C. oleifera oils concerning acid value (AV), saponification value (SV), iodine value (IV), and refractive index were characterized according to the IUPAC Methods 2.201, 2.202, 2.205, and 2.102, respectively (Paquot and Hauntfenne, 1987).
2.3.1. Fatty acid composition of the crude C. oleifera oilTOP
The fatty acid composition of C. oleifera oil was analyzed according to the IUPAC method 2.302 (Paquot and Hauntfenne, 1987). The analysis of fatty acid methyl esters was performed on a gas chromatograph (GC) (Agilent 6890N) equipped with a flame ionization detector (FID) and a BPX-70 capillary column (30 m × 0.25 mm, 0.25 μm of film thickness) (SGE Technologies Co. Ltd., Australia). The column, injector, and detector temperatures were set at 180, 230, and 300 °C, respectively. The flow rate of the carrier gas N2 with a split ratio of 1:20 was set at 70 mL/min. The fatty acids were identified with reference to the retention times of standard fatty acid methyl esters determined under the same conditions.
2.3.2. sn-2 fatty acid distribution of the triacylglycerols in the crude C. oleifera oilTOP
The triacylglycerol content was separated from crude C. oleifera oil by thin layer chromatography (TLC) using the mixture of hexane:diethyl ether:acetic acid (70:30:1, v/v/v) as developing solvent. The TLC plate was visualized under UV light after spraying with a 0.2% ethanolic solution of 2’,7’-dichlorofluorescein sodium salt. Then the triacylglycerol band was collected and extracted with diethyl ether, the obtained triacylglycerol was used for the sn-2 fatty acid composition analysis according to the IUPAC method 2.210 (Paquot and Hauntfenne, 1987). 1,3-Specific pancreatic lipase was employed for the chromatography purified triacylglycerol hydrolyzation. The hydrolyzate of the C. oleifera oil oil was separated on TLC using a mixture of n-hexane:diethyl ether:acetic acid (70:30:1, v/v/v) as developing solvent. The TLC bands of the hydrolyzate were visualized under UV light after spraying with a 0.2% ethanolic solution of 2’,7’-dichlorofluorescein sodium salt. Then the band containing monoacylglycerol (MAG) was collected and extracted with diethyl ether. The obtained MAG was methylated, and the resulting fatty acid methyl ester was subjected to GC analysis.
2.3.3. Tocopherol content assay of the crude C. oleifera oilTOP
The tocopherol (α-, β-, δ-, and γ) contents of the crude C. oleifera oil were determined according to our previous report (Liang et al., 2010) with minor modifications. The samples were analyzed by HPLC using a Waters Alliance 2695 system with a silica column (250
× 4.6 mm, 5 μm) (Waters, Singapore) and a Waters 2475 fluorescence detector (Waters, Milford, USA). The column temperature was maintained at 40 °C. The excitation and emission wavelengths were 298 nm and 325 nm, respectively. The oil samples were dissolved in hexane at 100 mg/mL. A 5 μL volume of the loaded sample was isocratically eluted with n-hexane/isopropyl ether (90/10, v/v) at 1.5 mL/min. The absolute contents of tocopherols were determined according to the calibrated standard curves.
2.4. Statistical analysisTOP
All analyses and measurements in this work were performed in at least duplicate. Data were analyzed by one-way analysis of variance (ANOVA) and Tukey’s multiple comparison method at p = 0.05 using IBM SPSS Statistics for windows version 20.0.
3. RESULTS AND DISCUSSIONTOP
3.1. Lipid content of C. oleifera seedsTOP
The lipid contents of these 22 seeds in our research were in the range of 28.39-56.94% with an average value of 41.05% on a moisture free basis (Table 1). The lipid contents of the seeds cultivated in Shangcheng were 41.73-56.94% with a mean value of 49.66% (Table 1), and significantly higher than those of the seeds cultivated in GuangShan, Xinxian and Luoshan. The values in our study are comparable to the report (Yao et al., 2011) on the lipid content (46%) of the C. oleifera seed from Shangcheng (Henan, China), higher than those (27.21-37.37% with a mean value of 31.31%) of the C. oleifera seeds (Xianglin variety cultivated in Henan) as reported by Wang et al. (2008). As a comparison, the oil contents of C. sasanqua seeds (Gunstone et al., 1994), C. sinensis seed (Sahari et al., 2004) and C. reticulate Lindl seeds (Li et al., 2013) were 56-70%, 30-33% and 49.4-51.4%, respectively.
Table 1. Fat content of the kernels of Camellia oleifera Abel and some characteristics of crude C. oleifera oils
| Sample |
|
Lipid content*(g/100g) |
Acid value (mg KOH/g) |
Saponification value (mg KOH/g) |
Iodine value (g I2/100g) |
Refraction index |
| Gs n = 7 |
Range |
28.39 - 45.38 |
1.04 - 2.71 |
189.69 - 196.91 |
82.0 - 85.5 |
1.4697 - 1.4713 |
| Mean |
36.65 ± 5.18b |
2.01 ± 0.57a |
193.44 ± 2.52a |
84.6 ± 1.2 |
1.4706 ± 0.0005 |
| Sc n = 5 |
Range |
41.73 - 56.94 |
0.22 - 0.44 |
178.90 - 192.81 |
82.0 - 85.0 |
1.4684 - 1.4720 |
| Mean |
49.66 ± 6.57a |
0.33 ± 0.10c |
187.68 ± 5.33c |
83.2 ± 1.4 |
1.4703 ± 0.0013 |
| Xx n = 5 |
Range |
32.58 - 42.47 |
0.35 - 5.17 |
183.17 - 192.39 |
82.1 - 87.1 |
1.4667 - 1.4715 |
| Mean |
37.25 ± 3.90b |
1.71 ± 0.97ab |
188.88 ± 3.75bc |
84.6 ± 2.1 |
1.4701 ± 0.0019 |
| Ls n = 5 |
Range |
33.54 - 45.75 |
0.48 - 0.83 |
191.53 - 194.72 |
84.1 - 85.5 |
1.4706 - 1.4712 |
| Mean |
42.41 ± 5.11b |
0.62 ± 0.13bc |
192.60 ± 1.28ab |
84.8 ± 0.5 |
1.4710 ± 0.0002 |
| Total n = 22 |
Range |
28.39 - 56.94 |
0.22 - 5.17 |
178.90 - 196.91 |
82.0 - 87.1 |
1.4667 - 1.4720 |
| Mean |
41.05 ± 7.19 |
1.24 ± 1.17 |
190.91 ± 4.06 |
84.3 ± 1.5 |
1.4705 ± 0.0011 |
| *, lipid content of the kernel of Camellia oleifera seed, on moisture free basis. Gs, seeds from Guangshang, Henan; Sc, seeds from Shangcheng, Henan; Xx, seeds from Xinxian, Henan; Xx, seeds from Luoshan, Henan. a,b,c, means within a column with different superscripts differ significantly at p < 0.05. |
3.2. Some physiochemical properties of C. oleifera oilTOP
The acid values (AVs) of the C. oleifera oils in our study ranged from 0.22 to 5.17 mg KOH/g with an average value of 1.24±1.17 mg KOH/g (Table 1). The AVs of C. oleifera oils from the seeds harvested from Guangshan were 2.01±0.57 mg KOH/g, and similar to those of the oils from the seeds harvested from Xinxian (1.71±0.97 mg KOH/g), however higher than those of the oils from the seeds harvested from Shangcheng (0.33±0.10
mg KOH/g) and Luoshan (0.62±0.13 mg KOH/g) (Table 1).
The saponification values (SVs) of the C. oleifera oils in our study ranged from 178.90 to 196.91 mg KOH/mg with an average value of 190.91±4.06 mg KOH/g (Table 1). The SVs of C. oleifera oils from the seeds obtained from Guangshan were in the range of 189.69 to 196.91 with an average of 193.44±2.52 mg KOH/g, similar to those of the oils from the seeds harvested from Luoshan (in the range of 191.53 to 194.72 with an average of 192.60±1.28 mg KOH/g), however higher than those of the oils from the seeds harvested from Xinxian (in the range of 183.17 to 192.39 with an average of 188.88±3.85 mg KOH/g) and Shangcheng (in the range of 178.90-192.81 with an average of 187.68±5.33) (Table 1).
The iodine values (IVs) of the C. oleifera oils in our study ranged from 82.0 to 87.1 g I2/100g with an average value of 84.3±1.5 g I2/100g (Table 1). The IVs of C. oleifera oils among the seeds from Guangshang, Shangcheng, Xinxian, and Luoshan showed no significant differences (Table 1). The refraction index (n25) of C. oleifera oils in our study ranged from 1.4667 to 1.4720 with an average of 1.4705±0.0011 (Table 1).
The SVs and IVs of the C. oleifera oils in our research are similar to those the C. oleifera oils from other province of China. The SV and IV of C. oleifera Abel. oil from the seed cultivated in Hunan (China) were 180.5 mg KOH/g and 81.5 g I2/100g, respectively (Yun et al., 2011). The IV and SV of the C. oleifera oil from the seed cultivated in Fujian (China) were 85±2 g I2/100g and 195±1 mg KOH/g, respectively (Yu et al., 2013).
As a comparison, the refractive index (n25), SV, and IV of Camellia sasanqua oil were 1.467-1.469, 193-196 mg KOH/g, and 83-89 g I2/100g, respectively (Gunstone et al., 1994). The IV and SV of the oils from tea seeds (Lahijan variety of Iranian tea seed, Southern Indian tea seed, and Turkish tea seed) were in the range of 85-91 g I2/100g and 192-194 mg KOH/g, respectively (Sahari et al., 2004). The refractive index (n40) of Camellia reticulate f. simpex seed oil was 1.4711-1.4736 (Huang et al., 2010). The SV and IV of Camellia sinensis O.Ktze oil were 189.7 mg KOH/g and 88.5 g I2/100g, respectively (Yun et al., 2011). The IV, SV and refractive index (n40) of C. reticulate Lindl seed oil were 72.1-79.8 g I2/100g, 174.1-185.0 mg KOH/g and 1.4727, respectively (Li et al., 2013).
3.3. Fatty acids composition and positional distribution of C. oleifera OilTOP
The fatty acid composition of the C. oleifera oils in our research was 7.07-9.52% palmitic, 0.09-0.22% palmitoleic, 1.45-2.94% stearic, 77.02-84.33% oleic, 5.19-11.23%
linoleic 0.53-0.70% linolinic, and 0.22-0.70% arachidic acid (Table 2). The proportion of unsaturated fatty acids (UFAs) and saturated fatty acids (SFAs) were 87.80-90.30% and 9.69-12.19%, respectively. And the ratios of UFAs/SFAs were in the range of 7.20-9.32.
Table 2. Fatty acid composition of C. oleifera oils
| Fatty acids |
Gs, n = 7 |
Sc, n = 5 |
Xx, n = 5 |
Ls, n = 5 |
Total, n = 22 |
| Range |
Mean |
Range |
Mean |
Range |
Mean |
Range |
Mean |
Range |
Mean |
| C16:0 |
8.61 - 9.13 |
8.92 ± 0.18a |
7.07 - 9.52 |
8.24 ± 0.84c |
7.84 - 8.89 |
8.45 ± 0.46bc |
8.43 - 9.01 |
8.83 ± 0.19ab |
7.07 - 9.52 |
8.64 ± 0.54 |
| C16:1 |
0.14 - 0.19 |
0.17 ± 0.02a |
0.09 - 0.15 |
0.11 ± 0.02b |
0.11 - 0.22 |
0.16 ± 0.04a |
0.11 - 0.14 |
0.12 ± 0.01b |
0.09 - 0.22 |
0.14 ± 0.03 |
| C18:0 |
1.90 - 2.14 |
2.01 ± 0.09b |
2.08 - 2.71 |
2.34 ± 0.24a |
1.45 - 2.94 |
2.16 ± 0.60ab |
2.03 - 2.37 |
2.20 ± 0.12ab |
1.45 - 2.94 |
2.16 ± 0.33 |
| C18:1 |
77.14 - 79.47 |
78.14 ± 0.75b |
77.38 - 84.33 |
81.09 ± 2.58a |
77.02 - 81.73 |
79.41 ± 1.76b |
78.00 - 78.70 |
78.41 ± 0.20b |
77.02 - 84.33 |
79.16 ± 1.89 |
| C18:2 |
8.72 - 10.54 |
9.76 ± 0.61a |
5.19 - 9.91 |
7.32 ± 1.96b |
6.68 - 11.23 |
8.75 ± 1.85a |
8.92 - 9.98 |
9.49 ± 0.34a |
5.19 - 11.23 |
8.91 ± 1.60 |
| C18:3 |
0.57 - 0.66 |
0.61 ± 0.03b |
0.53 - 0.70 |
0.62 ± 0.05ab |
0.58 - 0.70 |
0.65 ± 0.04a |
0.60 - 0.69 |
0.65 ± 0.03a |
0.53 - 0.70 |
0.63 ± 0.04 |
| C20:0 |
0.30 - 0.48 |
0.40 ± 0.05a |
0.22 - 0.39 |
0.29 ± 0.05b |
0.27 - 0.70 |
0.42 ± 0.15a |
0.23 - 0.42 |
0.30 ± 0.05b |
0.22 - 0.70 |
0.36 ± 0.10 |
| SFAs |
11.08 - 11.53 |
11.33 ± 0.16a |
9.69 - 11.99 |
10.86 ± 0.75b |
10.30 - 12.19 |
11.03 ± 0.65ab |
10.86 - 11.68 |
11.33 ± 0.26a |
9.69 - 12.19 |
11.15 ± 0.52 |
| UFAs |
88.46 - 88.92 |
88.67 ± 0.16b |
88.00 - 90.30 |
89.14 ± 0.75a |
87.80 - 89.70 |
88.97 ± 0.65ab |
88.31 - 89.14 |
88.67 ± 0.26b |
87.80 - 90.30 |
88.84 ± 0.52 |
| UFAs/SFAs |
7.67 - 8.03 |
7.83 ± 0.12b |
7.34 - 9.32 |
8.25 ± 0.65a |
7.20 - 8.71 |
8.10 ± 0.51ab |
7.56 - 8.21 |
7.83 ± 0.20b |
7.20 - 9.32 |
7.99 ± 0.43 |
| Gs, seeds from Guangshang, Henan; Sc, seeds from Shangcheng, Henan; Xx, seeds from Xinxian, Henan; Ls, seeds from Luoshan, Henan. C16:0, palmitic acid; C16:1, palmitoleic acid; C18:0, stearic acid; C18:1, oleic acid; C18:2, linoleic acid; C18:3, linolenic; C20:0, arachidic. SFA, saturated fatty acid; UFA, unsaturated fatty acid.. a,b,c, means within a row with different superscripts differ significantly at p < 0.05. |
The palmitic contents of the oils from C. oleifera seeds obtained from Guangshan and Luoshang were higher than those of the oils from C. oleifera seeds cultivated in Shangcheng and Xinxian (Table 2). The oleic contents of the oils from C. oleifera seeds obtained from Guangshan, Xinxian and Luoshang were similar, and lower than that of the C. oleifera seeds obtained from Shangcheng (Table 2). Linoleic contents of the oils from C. oleifera seeds obtained from Guangshan, Xinxian and Luoshang were similar, and higher than that of the C. oleifera seeds obtained from Shangcheng (Table 2). The geographic differences among the seeds from different districts could be attributed to the differences in the fatty acid composition of the oils.
The fatty acid composition of the C. oleifera oils in our study was comparable to those of the oils from the C. oleifera seeds cultivated in the other provinces of China reported by previous researchers (p<0.05) (Cao et al., 2017; Cheng et al., 2010; Jiang et al., 2010; Xi et al., 2002; Yang, 2010; Yao et al., 2011; Yu et al., 2013; Yuan et al., 2013). The oils from the C. oleifera seeds cultivated in Jinhua (Zhejiang, China) consisted of 8.10% palmitic, 0.10% palmitoleic, 1.90% stearic, 80.90% oleic, 8.10% linoleic acid, 0.30% linolenic, 0.60% eicosenoic acid, and UFAs were 90.00% (Cao et al., 2017). The fatty acid composition of the oil from C. oleifera seeds cultivated in Hangzhou (Zhejiang, China) was 8.60% palmitic, 0.10% palmitoleic, 1.80% stearic, 78.55% oleic, 9.90% linoleic acid, 0.30% linolenic, 0.70% eicosenoic acid, and UFAs were 89.55% (Cao et al., 2017). The fatty acid composition of the oils from the C. oleifera seeds cultivated in Hubei were 6.61-11.01% palmitic, 0.72-2.00% stearic acid, 65.70-84.48% oleic, and 6.14-13.37% linoleic (Cheng et al., 2010). The fatty acid composition of the oils from 35 C. oleifera seeds cultivated in Guangxi was 6.68-12.23% palmitic, 1.24-3.21% stearic, 74.49-86.16% oleic, and 1.94-12.97% linoleic acid (Jiang et al., 2010). The oils from C. oleifera seeds cultivated in the Jiangxi province consisted of 6.70-1.57% palmitic, 0.49-0.65% stearic, 72.1-90.1% oleic, 2.1-16.6% linoleic acid, and the UFAs were about 90% (Xi et al., 2002). Yang (Yang, 2012) analyzed the fatty acid composition of the oils from 38 C. oleifera seeds cultivated in the Jiangxi province in the 2011 season, and the oils consisted of 7.19-9.17% palmitic, 1.50-3.46% stearic, 78.34-82.79% oleic, 6.37-10.05% linoleic acid, and the UFAs were over 88.76%. Yao et al. (2011), analyzed the fatty acid composition of the C. oleifera oils from several provinces (such as Guangxi, Jiangxi, Hunan, Hubei, Guangdong, Zhengjiang, Anhui, Fujian, and Guizhou) of China. These oils consisted of 7.16-8.87% palmitic, 1.42-2.78% stearic, 76.72-83.18% oleic, 6.59-9.71% linoleic, 0-1.18% linolenic, and 0-0.79% arachidic (Yao et al., 2011). The fatty acid composition of the oil from the C. oleifera seeds cultivated in Fujian (China) was 10.20% palmitic, 1.70% stearic, 77.84% oleic, 8.30% linoleic, 0.37% linolenic, 0.59% arachidic (Yu et al., 2013). Yuan et al. (2013) evaluated the fatty acid composition of 132 C. oleifera oils from the seeds collected from several provinces of China in 2009. The fatty acid composition of these oils was 7.03-13.85% palmitic, 1.35-5.49% stearic, 70.33-86.21% oleic, and 3.25-17.18% linoleic acid.
The fatty acid composition of the C. oleifera oils in our study was different from the results of Chen et al. (1996) and Ma et al. (2011). Chen et al. (1996) reported the major fatty acid composition of the oils from the C. oleifera seeds cultivated in Hunan province to be 11.32-16.40% palmitic, 63.51-75.08 oleic, and 9.91-19.76% linoleic acid. The study of Ma et al. (2011) showed that the fatty acid composition of the oil from C. oleifera obtained from Guangxi was 68-77% monounsaturated fatty acids, 7-14% polyunsaturated acids, and 16-18% saturated fatty acids, including 4.4-4.7% nonadecanoic acid (C19:0). The differences in the fatty acid compositions might be attributed to geographic and varietal differences.
The chemical, physical and biological characteristics of lipids are largely dependent on the amount and positional distribution of fatty acids on the glycerol backbone, and therefore, the stereospecific analysis of fatty acids in the triacylglycerol is considered very important when using the lipids for dietary and industrial purposes (Hunter, 2001). The major fatty acids in the sn-2 position of the triacylglycerols in the C. oleifera oils in our study were oleic (84.36-91.33% with an average value of 86.74±2.06%), followed by linoleic (7.14-14.22% with an average value of 12.01±2.03%) (Table 3). The palmitic, stearic and arachidic acid contents were lower than 1%, while palmitoleic and linolenic acids were not detected (Table 3). Oleic in the sn-2 position of the oils from the C. oleifera seeds obtained from Shangcheng were in the range of 94.65-91.33% with an average of 88.56±2.88%, similar to those of the oils from C. oleifera seeds obtained from Xinxian, and higher than those of the oils from C. oleifera seeds obtained from Guangshan and Luoshan. Linoleic in the sn-2 position of the oils from the C. oleifera seeds obtained from Luoshan were in the range of 13.27-13.85% with an average of 13.62±0.24%, about the same as those of the oils from the C. oleifera seeds obtained from Guangshan and Xinxian, and higher than those of the oils from the C. oleifera seeds obtained from Shangcheng. The SFAs content in the sn-2 position of C. oleifera oils in our research was in the range of 0.89-1.96% with an average of 1.25±0.25%, and UFA content in the sn-2 position of these oils was in the range of 98.04-99.11% with an average of 98.75±0.26% (Table 3). These differences might be caused by geographic differences.
Table 3. sn-2 fatty acid composition of C. oleifera oils
| Fatty acids |
Gs, n = 7 |
Sc, n = 5 |
Xx, n = 5 |
Ls, n = 5 |
Total, n = 22 |
| Range |
Mean |
Range |
Mean |
Range |
Mean |
Range |
Mean |
Range |
Mean |
| C16:0 |
0.55 - 0.87 |
0.66 ± 0.11a |
0.42 - 0.80 |
0.53 ± 0.16ab |
0.38 - 0.87 |
0.54 ± 0.19ab |
0.38 - 0.58 |
0.47 ± 0.08b |
0.38 - 0.87 |
0.56 ± 0.15 |
| C18:0 |
0.24 - 0.31 |
0.29 ± 0.03a |
0.20 - 0.38 |
0.31 ± 0.07a |
0.26 - 0.35 |
0.30 ± 0.04a |
0.08 - 0.28 |
0.19 ± 0.09b |
0.08 - 0.38 |
0.27 ± 0.07 |
| C18:1 |
85.38 - 87.44 |
86.30 ± 0.63b |
84.65 - 91.33 |
88.56 ± 2.88a |
84.36 - 90.52 |
86.94 ± 2.49ab |
85.04 - 85.81 |
85.33 ± 0.37b |
84.36 - 91.33 |
86.74 ± 2.06 |
| C18:2 |
11.34 - 12.96 |
12.31 ± 0.51a,b |
7.14 - 14.22 |
10.24 ± 3.00b |
8.51 - 13.68 |
11.74 ± 2.20a,b |
13.27 - 13.85 |
13.62 ± 0.24a |
7.14 - 14.22 |
12.01 ± 2.03 |
| C20:0 |
0.37 - 0.47 |
0.44 ± 0.03a,b |
0.28 - 0.46 |
0.35 ± 0.07b |
0.33 - 0.74 |
0.49 ± 0.17 |
0.34 - 0.43a |
0.39 ± 0.04a,b |
0.28 - 0.74 |
0.42 ± 0.10 |
| SFAs |
1.22 - 1.65 |
1.39 ± 0.14a |
1.01 - 1.53 |
1.20 ± 0.22ab |
0.97 - 1.96 |
1.32 ± 0.39ab |
0.89 - 1.20 |
1.06 ± 0.14b |
0.89 - 1.96 |
1.25 ± 0.25 |
| UFAs |
98.34 - 98.78 |
98.61 ± 0.15b |
98.47 - 98.99 |
98.80 ± 0.22ab |
98.04 - 99.03 |
98.68 ± 0.39ab |
98.80 - 99.11 |
98.94 ± 0.14a |
98.04 - 99.11 |
98.75 ± 0.26 |
| a,b,c, means within a row with different superscripts differ significantly at p < 0.05. |
In compliance with the general law for the fatty acid distribution of natural triacylglycerols in vegetable oils, UFAs occupied over 98% of the sn-2 position of the glycerol backbone, in which only a very small amount of thermodynamically unfavorable palmitic, stearic and arachidic acid were detected. As a comparison, the oleic acid in the sn-1, 2, and 3 positions of C. japonica L. oil were 66.0%, 93.6% and 94.7%, respectively (Noh and Yoon, 2012). For other high-oleic acid vegetable oils, such as Chufa tuber oil, the major fatty acid composition of the oil was 15.4% palmitic, 65.5% oleic, and 16.2% linoleic, while the major fatty acid composition on its sn-2 position was 75.1% oleic and 23.1% linoleic (Kim et al., 2007). For olive oil, the major fatty acid composition of the oil was 12.1-16.3% palmitic and 74.3-77.5% oleic, while the major fatty acid composition on its sn-2 position was 82.2-88.4% oleic (Vichi et al., 2007).
3.4. Tocopherols in crude C. oleifera OilTOP
The total tocopherol contents in the C. oleifera oils extracted by petroleum ether were in the range of 39.55-75.94 mg/100g with an average of 58.21±10.54 mg/100g, and the α-tocopherol and γ-tocopherol in these oils were 33.98-67.82 mg/100g with an average of 51.66±10.19 mg/100g and 5.57-8.27 mg/100g with an average of 6.55-8.27 mg/100g with an average of 6.55±0.76 mg/100g, respectively (Table 4). However, the total tocopherol contents in the C. oleifera oils extracted by ethyl ether were 14.91-44.36 mg/100g with an average of 30.35±7.77 mg/100g, the α-tocopherol and the γ-tocopherol contents in these oils were 9.42-37.08 mg/100g with an average of 23.74±7.44 mg/100g and 5.50-7.33 mg/100g with an average of 6.60±0.53 mg/100g, respectively (Table 4). β-tocopherol and δ-tocopherol were not detected in the C. oleifera oils extracted by petroleum ether or ethyl ether, which is consistent with the report of Li et al. (2009). The α-tocopherol contents in the oils extracted with petroleum ether (33.98-67.82 mg/100g with an average of 51.66±10.19
mg/100g were dramatically higher than those in the oils extracted with ethyl ether (9.42-37.08 mg/100g with an average of 23.74±7.44 mg/100g) (p<0.05) (Table 4). The γ-tocopherol contents in the oils from C. oleifera seeds obtained from different locations extracted by the same solvent showed no difference. Moreover, there was no difference between the γ-tocopherol contents in the oils obtained from the same seed extracted with different solvents (petroleum ether and ethyl ether) (Table 4).
Table 4. Tocopherol composition of C. oleifera oils (mg/100g oil)
| Sample |
|
Tocopherol in oils extracted by petroleum ether |
Tocopherol in oils extracted by ethyl ether |
| α |
β |
γ |
δ |
Total |
α |
β |
γ |
δ |
Total |
|
| Gs n = 7 |
Range |
54.84 - 62.56 |
- |
5.95 - 8.27 |
- |
61.3 - 70.81 |
17.03 - 33.27 |
- |
5.84 - 7.33 |
- |
22.87 - 40.46 |
| Mean |
59.16 ± 2.68a |
- |
6.85 ± 0.99a |
- |
66.01 ± 3.25a |
24.99 ± 6.38a |
- |
6.61 ± 0.57a |
- |
31.60 ± 6.85a |
| Sc n = 5 |
Range |
36.26 - 61.60 |
- |
6.01 - 6.96 |
- |
42.70 - 67.61 |
15.30 - 31.90 |
- |
5.75 - 7.13 |
- |
22.21 - 39.03 |
| Mean |
50.76 ± 9.67b |
- |
6.42 ± 0.34a |
- |
57.17 ± 9.57b |
23.97 ± 6.39ab |
- |
6.76 ± 0.57a |
- |
30.72 ± 6.64a |
| Xx n = 5 |
Range |
50.93 - 67.82 |
- |
6.04 - 8.12 |
- |
56.98 - 75.94 |
20.27 - 37.08 |
- |
6.30 - 7.27 |
- |
27.25 - 44.36 |
| Mean |
56.40 ± 6.84ab |
- |
6.64 ± 0.88a |
- |
63.05 ± 7.70ab |
29.59 ± 6.60a |
- |
6.83 ± 0.39a |
- |
36.43 ± 6.65a |
| Ls n = 5 |
Range |
33.98 - 41.78 |
- |
5.57 - 7.08 |
- |
39.55 - 48.03 |
9.42 - 20.32 |
- |
5.50 - 6.85 |
- |
14.91 - 26.54 |
| Mean |
37.32 ± 3.12c |
- |
6.19 ± 0.57a |
- |
43.51 ± 3.16c |
15.92 ± 4.81b |
- |
6.22 ± 0.49a |
- |
22.14 ± 4.97b |
| Total n = 22 |
Range |
33.98 - 67.82 |
- |
5.57 - 8.27 |
- |
39.55 – 75.94 |
9.42 - 37.08 |
- |
5.50 - 7.33 |
- |
14.91 - 44.36 |
| Mean |
51.66 ± 10.19 |
- |
6.55 ± 0.76 |
- |
58.21 ± 10.54 |
23.74 ± 7.44 |
- |
6.60 ± 0.53 |
- |
30.35 ± 7.77 |
Gs, seeds from Guangshang, Henan; Sc, seeds from Shangcheng, Henan; Xx, seeds from Xinxian, Henan; Ls, seeds from Luoshan, Henan.
-, not detected. a,b,c, means within a column followed by the different superscripts represent a significant difference at p < 0.05. |
Li et al. (2009) reported that the α- and γ-tocopherols in the C. oleifera oil were 1.5-187.7mg/100g and 0.66-1.32mg/100g, respectively. The study by Zhu et al., (2011) showed that α-, γ-, and δ-tocopherols in tea seed (seed of C. sinensis O. Ktze) oil were 24.91-55.31mg/100g, 1.68-3.55 mg/100g, and 0.08-1.32 mg/100g, respectively, and β-tocopherol was not detected. In the report of Zhu et al. (Zhu et al., 2013), total tocopherol was 29.78-58.63 mg/100g. In tea seed oils (seeds of C. sinensis O. Ktze), total tocopherols were 23.2-47.0 mg/100g, with the the major component being α-tocopherol with 22.6-45.0 mg/100g; and β-, γ-, and δ-tocopherol were lower than 2 mg/100g. In the research of Dong et al. (Dong et al., 2012), the tocopherol content of tea seed oils (C. sinensis L. seed) extracted by press was 24.71 mg/100g with 24.15 mg/100g of α-tocopherol in the oils extracted by the soxhlet method with petroleum ether, the α-tocopherol content was 21.80 mg/100g, and β-, γ- and δ-tocopherols were not detected. In the oils extracted by supercritical CO2 (15MPa, 35°C), the tocopherol content was 70.11 mg/100g, including 68.90 mg/100g α-tocopherol. According to the three methods, supercritical CO2 extraction might be the best one. Fazel et al. (Fazel et al., 2008) evaluated the β-carotene, vitamin E (8 compounds) and polyphenols (8 compounds) in oils obtained from C. sinensis seeds, and the results showed that the total content of tocopherols and tocotrienols were 376.0 ± 3.0 mg/kg and 13.4 ± 0.34 mg/kg, respectively, and in vitamin E; the α-tocopherol content (210.0 ± 2.3 mg/kg) was higher than the others.
In conclusion, this work has presented the general properties of the oils from C. oleifera seeds cultivated in south Henan of China along with their fatty acid profile. It turns out that physiochemical properties of the oils from the C. oleifera seeds cultivated in south Henan of China are similar to those of the oils from the C. oleifera seeds cultivated in other districts of China, and could be a good source of natural oil rich in oleic acid and tocopherols.
ACKNOLEDGMENTTOP
The authors thank the financial support of the Funds of China Agriculture Research System (No. CARS14-1-29).
REFERENCESTOP
| ○ |
Akihisa T, Yasukawa K, Kimura Y, Takase S, Yamanouchi S, Tamura T. 1997. Triterpene alcohols from camellia and sasanqua oils and their anti-inflammatory effects. Chem. Pharm. Bull, 45, 2016-2023. https://doi.org/10.1248/cpb.45.2016 |
| ○ |
Cao YQ, Yao XH, Ren HD, Wang KL. 2017. Determination of fatty acid composition and metallic element content of four Camellia species used for edible oil extraction in China. J. Consum. Food Saf. 12, 165-169. https://doi.org/10.1007/s00003-017-1104-2 |
| ○ |
Chen YZ, Wang DB, Su YQ, Wang B. 1996. Camellia oleifera: selective breeding of “cold dew seed” type of cultivar clones and analysis of their fatty acid composition. Econ. For. Res. 14, 1-5. |
| ○ |
Chen YJ, Wang LL, Chen XP, Li Y. 2011. Oil content and fatty acid composition of Camellia oleifera seed in Guangxi. Food Sci. 32, 172-176. |
| ○ |
Chen ZH, Xiao RX, Shen JF, Chen QP. 2012. Physicochemical property and oxidative stability of seven kinds of cold pressed oil-tea camellia seed oil. China Oils Fats 37, 34-38. |
| ○ |
Cheng JY, Li L, Zhou XH, Luo ZJ, Tu BK. 2010. Compositions of fatty acids and its correlation among superior trees of Camellia oleifera Abel. Forestry Technol. Develop. 24, 41-43. |
| ○ |
Cheng YT, Wu SL, Ho CY, Huang SM, Cheng CL. 2014. Beneficial effects of camellia oil (Camellia oleifera Abel.) on ketoprofen-induced gastroinal mucosal damage through upregulation of HO-1 and VEGF. J. Agric. Food Chem. 62, 642-650. https://doi.org/10.1021/jf404614k |
| ○ |
Dong HS, Zang P, Sun JC, Jin L, Zhang SJ, Chen B. 2012. Comparison of the fatty acid composition and vitamin E of tea seed oil prepared by different extraction methods. China Oils Fats 37, 11-14. |
| ○ |
Fazel M, Sahari M, Barzegar M. 2008. Determination of main tea seed oil antioxidants and their effects on common kilka oil. Int. Food Res. J. 15, 209-217. |
| ○ |
Gunstone FD, Harwood JL, Padley FB. 1994. The lipid handbook (2nd ed). London: chapman & Hall, (pp. 103). |
| ○ |
Guo H, Zhou JP, Luo JW, Tan HY, Liu DM. 2008. Fatty acid composition analysis of tea seeds oil. China Oils Fats 33, 71-73. |
| ○ |
Guo XL, Xiao P, Du SG, Luo LP, Fu YX. 2013. Fatty acid composition of Camellia oleifera Abel. Seeds with different strains. J. Nanchang Univ. (Nat. Sci. Ed.) 37, 43-46. |
| ○ |
He F, He B. 2002. Cultural distribution and site classification for Camellia oleifera. Scientia Silvae Sinicae 38, 64-72. |
| ○ |
Huang JC, Lu B, Kan H, Liu Y. 2010. Analysis on the main physical and chemical composition of Camellia reticulate f. simpex seed oil. J. Southwest Forestry Univ. 30, 29-33. |
| ○ |
Hunter JE. 2001. Studies on effects of dietary fatty acids as related to their position on triglycerides. Lipids 36, 655-668. https://doi.org/10.1007/s11745-001-0770-0 |
| ○ |
Jiang ZP, Zhang, NY, Zeng XY, Chen GC, Wang DX. 2010. Study on the fatty acid composition of the oils from major Camellia oleifera strains in Guangxi. Guangxi Forestry Science 39, 201-204. |
| ○ |
Kim M, No S, Yoon SH. 2007. Stereospecific analysis of fatty acid composition of chufa (Cyperus esculentus L.) tuber oil. J. Am. Oil Chem. Soc. 84, 1079-1080. https://doi.org/10.1007/s11746-007-1131-8 |
| ○ |
Lee CP, Yen GC. 2006. Antioxidant activity and bioactive compounds of tea seed (Camellia oleifera Abel.) oil. J. Agric. Food Chem. 54, 779-784. https://doi.org/10.1021/jf052325a |
| ○ |
Li N, Zhao YL, Liao J. 2009. Determination of lipsoluble vitamin, β carotene in tea-seed, tea-seed and shell by HPLC. Modern Scientific Instruments 26, 92-94. |
| ○ |
Li H, Zhou GY, Zhang HY, Liu JA. 2011. Research progress on the health function of tea oil. J. Med. Plants Res. 5, 485-489. |
| ○ |
Li K, Wang BY, Zhang H, Zheng H, Liu SP, Zhang WW. 2013. Study on physicochemical properties and main constituents of Camellia reticulate Lindl. seed oil. J. Yunnan Agric. Univ. 28, 102-106. |
| ○ |
Liang SH, Yang GL, Ma YX. 2010. Chemical characteristics and fatty acid profile of foxtail millet bran oil. J. Am. Oil Chem. Soc. 87, 63-67. https://doi.org/10.1007/s11746-009-1475-3 |
| ○ |
Ma JJ, Ye H, Rui YK, Chen GC, Zhang NY. 2011. Fatty acid composition of Camellia oleifera oil. J. Verbrauch. Lebensm. 6, 9-12. https://doi.org/10.1007/s00003-010-0581-3 |
| ○ |
Miura D, Kida Y, Nojima H. 2007. Camellia oil and its distillate fractions effectively inhibit the spontaneous metastasis of mouse melanoma BL6 cells. FEBS Lett. 581, 2541-2548. https://doi.org/10.1016/j.febslet.2007.04.080 |
| ○ |
Noh S, Yoon SH. 2012. Stereospecific positional distribution of fatty acids of camellia (Camellia japonica L.) seed oil. J. Food Sci. 77, C1055-C1057. https://doi.org/10.1111/j.1750-3841.2012.02854.x |
| ○ |
Paquot C, Hauntfenne A. 1987. IUPAC Standard Methods for the Analysis of Oils, Fats and Derivatives. London: Blackwell Scientific Publications Ltd. |
| ○ |
Sahari MA, Ataii D, Hamedi M. 2004. Characteristics of tea seed oil in comparison with sunflower and olive oils and its effect as a natural antioxidant. J. Am. Oil Chem. Soc. 81, 585-588. https://doi.org/10.1007/s11746-006-0945-0 |
| ○ |
Sahari MA, Amooi M. 2013. Tea seed oil: extraction, compositions, applications, functional and antioxidant properties. Acad. J. Med. Plants 1, 68-79. https://doi.org/10.13140/RG.2.1.3147.8644 |
| ○ |
Shanan H, Ying G. 1982. The comprehensive utilization of camellia fruits. American Camellia Yearbook 37,104-107. |
| ○ |
Tang L, Bayer E, Zhuang R. 1993. Obtain, properties and utilization of Chinese tea seed oil. Fett Wiss. Technol.-Fat Sci. Technol. 95, 23–27. |
| ○ |
Tu PS, Tung YT., Lee WT, Yen GC. 2017. Protective effect of camellia oil (Camellia oleifera Abel.) against ethanol-induced acute oxidative injury of the gastric mucosa in mice. J. Agric. Food Chem. 65, 4932-4941. https://doi.org/10.1021/acs.jafc.7b01135 |
| ○ |
Vichi S, Pizzale L, Conte LS. 2007. Stereospecific distribution of fatty acids in triacylglycerols of olive oils. Eur. J. Lipid Sci. Technol. 109, 72-78. https://doi.org/10.1002/ejlt.200600199 |
| ○ |
Wang XN, Chen YZ, Wu LQ, Liu RK, Yang XH, Wang R, Yu KW. 2008. Oil content and fatty acid composition of Camellia oleifera seed. Journal of Central South University of Forestry & Technology 28, 11-17. |
| ○ |
Xi RC, Deng XM, Gong C, Liu S, Ao WC. 2006. Studies on selecting and breeding of high linoleic acid content and high oil yield oil tea camellia clones. For. Res. 19, 158-164. |
| ○ |
Yang XW. 2012. Oil content and fatty acid composition analysis of Camellia oleifera seeds in Jiang-xi. Jiangxi Food Industry 25, 31-33. |
| ○ |
Yao XH, Wang YP, Wang KL, Ren HD. 2011. Effects of geographic latitude and longitude on fat and its fatty acid composition of oil-tea camellia seeds. China Oils and Fats 36, 31-34. |
| ○ |
Yu YS, Ren SX, Tan KY. 1999. Study on climatic regionalization and layer and belt distribution of oil tea camellia quality in China. J. Nat. Res. 14, 123-127. |
| ○ |
Yu X, Li Q, Du S, Zhang R, Xu C. 2013. A novel process for the aqueous extraction of oil from Camellia oleifera seeds and its antioxidant activity. Grasas Aceites 64, 407-414. https://doi.org/10.3989/gya.106412 |
| ○ |
Yuan JJ, Wang CZ, Chen HX, Zhou H, Ye JZ. 2013. Prediction of fatty acid composition in Camellia oleifera oil by infrared transmittance spectroscopy (NITS). Food Chem. 138, 1657-1662. https://doi.org/10.1016/j.foodchem.2012.11.096 |
| ○ |
Yun ZT, Liao XY, Weng XC. 2011. Comparison of physicochemical properties and fatty acids composition of tea seed oil and Camellia oleifera seed oil. Sci. Technol. Food Ind. 32, 136-138. |
| ○ |
Zhu JX, Zhu YJ, Zhang SK, Liu GY, Jin QZ. 2011. Preliminary component analysis of fat concomitant in tea seed oil. China Tea Proc. 25, 47-50. |
| ○ |
Zhu JX, Zhu YJ, Liu GY, Zhang SK, Jin QZ. 2013. Analysis of lipid accompaniments in teas seed oils from thirteen provinces. China Oils Fats 38, 84-88. |