Approaches to improve the growth of the starter lactic acid bacterium OM13 during the early stages of green Spanish-style table olive production
A. Alfonzoa, A. Martoranaa, L. Settannia, M. Matraxiaa, O. Coronaa, P. Vagnolic, T. Carusoa, G. Moschettia and N. Francescaa,*
aDipartimento Scienze Agrarie e Forestali, Università degli Studi di Palermo, Viale delle Scienze 4, 90128 Palermo, Italy
cLallemand Italia, Via Rossini 14/B 37060 Castel D’Azzano (VR) Italy
*Corresponding author: nicola.francesca@unipa.it
| |
SUMMARY
The present research aimed at determining the optimal conditions for the lactic acid fermentation of green Spanish-style table
olives. The work is a follow-up, and focuses on the performance of the commercial starter strain Lactobacillus pentosus OM13 by applying an acclimatization step and the addition of nutrients, and concentrations of lactic acid that were previously
investigated. The acclimatization of the cells warranted the dominance of the starter culture even at an inoculation level
of 2 Log cycles lower than that commonly used in standard fermentation. A significant effect was found in terms of acidification
kinetics within the first week of fermentation, with the highest decrease in pH, at ~2.5 units, which occurred in the trial
and after inoculation with 106 CFU/mL of starter after acclimatation (EO3) that showed values similar to control C obtained with Lactobacillus pentosus OM13 at a concentration of 107 CFU/mL. After day 3, further decreases in pH of up to 4.30 were observed until day 30, and then these values remained almost
constant until the end of process (day 190) when lower pH values were reached for trial EO3 and control C. The results of
microbiological dynamics, the changes in VOCs and finally the effect of the processes on the sensory analysis of the fermented
product were investigated by multivariate analysis. The acclimatization process and the initial inoculation level influenced
the bacterial microflora, aromatic compounds and organoleptic characteristics of the final product. Finally, the trials C,
EO2 and EO3 showed higher values (60-80%) of preferences and satisfaction compared to other experimental productions.
|
| |
RESUMEN
Aproximaciones para mejorar el crecimiento de bacterias lácticas iniciadoras OM13 durante las primeras etapas de producción
de aceitunas verdes de mesa estilo español. La presente investigación tuvo como objetivo establecer las condiciones óptimas para la fermentación láctica de aceitunas
verdes de mesa estilo español. El trabajo se centra en el seguimiento del rendimiento de la cepa iniciadora comercial Lactobacillus pentosus OM13 aplicando una etapa de aclimatación, adición de nutrientes y concentraciones de ácido láctico que fueron previamente
investigadas. La aclimatación de las células garantizó la dominancia del cultivo iniciador, incluso a un nivel de inoculación
2 ciclos Log menor que el utilizado habitualmente en una fermentación estándar. Se encontró un efecto significativo en términos
de cinéticas de acidificación en la primera semana de fermentación, donde el mayor descenso de pH de ~2,5 unidades ocurrió
en el ensayo inoculado con 106 CFU/mL del iniciador después de la aclimatación (EO3), que mostró valores similares al control C obtenido con Lactobacillus pentosus OM13 a la concentración de 107 CFU/mL. Después del día 3, hasta el 30 se observaron descensos adicionales de pH hasta 4,30, manteniéndose casi constantes
hasta el final del proceso (día 190) donde se alcanzaron los menores valores en el ensayo EO3 y el control. Los resultados
de dinámicas microbiológicas, cambios en COVs y el efecto de los procesos en el análisis sensorial del producto fermentado
se estudiaron mediante análisis multivariante. El proceso de aclimatación y el nivel de inoculación inicial influenciaron
la microflora bacteriana, los compuestos aromáticos y las características organolépticas del producto final. Por último, los
ensayos C, EO2 y EO3 mostraron un valor mayor (60-80%) de preferencias y satisfacción comparada con otras producciones experimentales.
|
1. INTRODUCTIONTOP
The use of starter cultures to ferment foods and especially for table olives (De Castro et al., 2002; Francesca et al., 2016; Servili et al., 2006) is very important, as it reduces the probability of spoilage and makes fermentation a predictable and controllable process
(Martorana et al., 2015, 2017a; Panagou et al., 2003).
Holzapfel (2002) defined the starter culture as a preparation containing a high number of viable cells that can be used to improve a given
fermentation process. Generally, in the production of table olives it is important that the starter culture has rapid growth,
a homofermentant metabolism, ability to acidify, NaCl tolerance, ability to grow at low temperatures, and ability to dominate
the indigenous microbial populations. Moreover, the starter culture must show a high ability to withstand freezing or freeze-drying
in order to facilitate the marketing and distribution of the strain (Garrido-Fernández et al., 1997).
Starter strains might affect the aroma and flavor of the olives and inhibit the growth of spoilage microorganisms by competing
with them, or by producing compounds such as bacteriocins, thus promoting a greater shelf-life of the products (Holzapfel, 2002).
For the fermentation of table olives, it is possible to use as a starter both lactic acid bacteria (LAB), among which the
most widely used are Lactobacillus plantarum and Lactobacillus pentosus (Hurtado et al., 2012), and yeasts which include Wickerhamomyces anomalus, Saccharomyces cerevisiae and Pichia membranifaciens (Oliveira et al., 2017).
Starter strains are usually purchased in lyophilized form as their storage at low temperature is not required. However, the
conditions of rehydration and the solution adopted to reactivate them can affect their concentration and therefore their fermentation
capacity. In particular, it was observed as in Lactobacillus bulgaricus, if the speed of rehydration is slow, you get a greater vitality of the microorganism (Teixeira et al., 1995).
The creation of an ideal environment for the development of a microorganism, or its acclimatization, is a widespread practice,
particularly in the wine industry. An example is given by S. cerevisiae that, when acclimatized, it achieves a higher viable cell count and shows a greater ability to dominate the fermentation
(Kontkanen et al., 2004).
The optimal growth of starter strains is facilitated by the presence of nutrients that contain sugars, vitamins and amino
acids, mainly used in the wine industry to encourage the growth of yeasts in an adverse environment caused by a low pH, high
sulfur dioxide and alcohol content (Chasseriaud et al., 2015).
During grape juice fermentation, it is possible to observe how the addition of nutrients, previously inoculated with a commercial
culture of S. cerevisiae reduce the fermentation time, at the same time favoring a rapid strain growth compared to a grape juice not supplemented
with the nutrient (Kontkanen et al., 2004). Similarly, olives inoculated with L. pentosus and with glucose show a rapid development of lactic acid bacteria in the first month of fermentation, resulting in a pH decrease
and limiting the number of detectable spoilage microorganisms, compared to similar olives deprived of the nutrient (Panagou et al., 2003). To further facilitate the development of the starter, the nutrient should be added to the brine immediately after inoculation
of the strain. Previous studies reported the technological performance of the L. pentosus OM13 both on pilot (Aponte et al., 2012; Martorana et al., 2015) and industrial scales (Martorana et al., 2017a).
The present research is a follow-up of a recently study concerning the evaluation of different conditions for the industrial
production of table olives with the L. pentosus OM13 strain. In order to improve the stage of fermentation by LAB during the production of green-style table olives (cultivar
Nocellara del Belice), the work was focused on the ability of the L. pentosus OM13 strain to dominate microbial populations and to acidify brine rapidly when the concentration of OM13 starter, just after
the inoculum, was lower than those commonly expected. With these aims, a total of seven different experimental fermentations
of table olives were investigated in a microbiological, physic-chemical and sensory analysis. The experimental fermentation
was carried out by using the acclimatization of starter cells and the addition of nutrients and lactic acid.
2. MATERIALS AND METHODSTOP
2.1. Experimental fermentation of table olives and sample collectionTOP
The fermentation of table olives was carried out using drupes from the cultivar “Nocellara del Belice” and according to the
Spanish-style method. The experimental design was made up of three different trials (Figure 1). Trials EO1, EO2 and EO3 were subjected to an addition of lactic acid (90% w/v, Merck Millipore, Vimodrone, Italy) until
the pH of the brine was 7.0 plus 2 g/kg of the nutrient LBO2014 (Lallemand, Inc., Montreal, Canada), consisting of glucose,
fructose and yeast autolysates for LAB nutritional requirements. Subsequently, trials EO1, EO2 and EO3 were inoculated with
Lal’Olive Crispy Lactobacillus pentosus OM13 at concentrations of 104, 105 and 106 CFU/mL, respectively. The starter culture was used in freeze-dried form (Lallemand, Inc., Montreal, Canada), containing approximately
1.1 × 10⁹ Colony-Forming Units (CFU/g) and food-grade maltodextrin as carrier. For all experimental trials, the starter cultures, before
inoculation, were subjected to an acclimatization phase in brine (6% w/v NaCl) for 12 h at room temperature. Following the
manufacturer’s protocol, in order to reach a concentration of 107 CFU/mL of the starter in brine, a dose of 0.15 g/kg of olives was used. The lowest dilutions (106, 105, 104 CFU/mL) were obtained by serial dilutions in the ratio of 1:10.
|
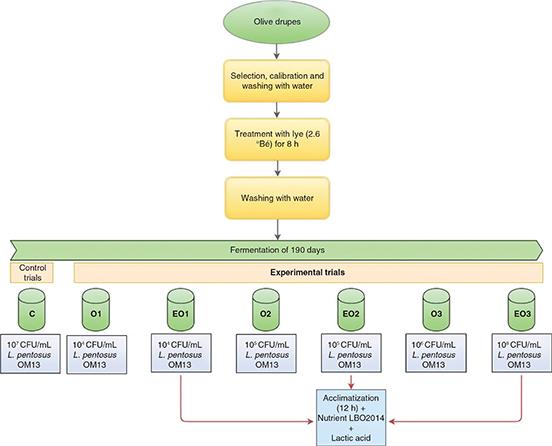 Figure 1. Experimental design for manufacturing of green table olives. Figure 1. Experimental design for manufacturing of green table olives.
Abbreviation: °Bé. Grade Baumé; L., Lactobacillus; C, control trial; O1, L. pentosus OM13 at 104 CFU/mL; EO1, L. pentosus OM13 at 104 CFU/mL + Acclimatization + Nutrient LBO2014+ Lactic acid; O2, L. pentosus OM13 at 105 CFU/mL; EO2, L. pentosus OM13 at 105 CFU/mL + Acclimatization + Nutrient LBO2014+ Lactic acid; O3, L. pentosus OM13 at 106 CFU/mL; EO3, L. pentosus OM13 at 106 CFU/mL + Acclimatization + Nutrient LBO2014+ Lactic acid.
All experimental trials were set up in triplicate and two independent fermentations were performed in two consecutive weeks.
|
|
The experimental design also included three untreated trials O1, O2 and O3. These trials did not receive any supplement and
the starter culture L. pentosus OM13 was inoculated without acclimatization at 104 (trial O1), 105 (trial O2) and 106 (trial O3) CFU/mL.
The control test (C) was fermented only with L. pentosus OM13 at a concentration of 107 CFU/mL.
All trials were fermented at room temperature in plastic vats containing 140 kg of drupes and 60 L of brine (10% w/v NaCl).
Samples of brines (approximately 50 mL) were collected before the addition of starter cultures, soon after their addition
and after 3, 6, 9, 15, 30, 60, 140 and 190 d of fermentation. All experimental trials were set up in triplicate and two independent
fermentations were performed in two consecutive weeks during October 2014 at the Geolive SAS company located in Castelvetrano
(Trapani province, Sicily, Italy) (37° 36′ 46″ N/12°50′ 52″ E).
2.2. Analysis of pH and microbiological countsTOP
The monitoring of pH values and analysis of mesophilic rod LAB, yeasts, Enterobacteriaceae, pseudomonads, staphylococci and coagulase-positive staphylococci (CPS) were performed as reported by Martorana et al., (2017a). All analyses were performed in triplicate.
2.3. Isolation, grouping and identification of lactic acid bacteriaTOP
During the processing of fermentation at different time intervals (3, 6, 9, 15, 30, 60, 140 and 190 d) at least five colonies,
all with different morphologies of presumptive LAB sharing color, shape, edge, surface, and elevation, originating from the
highest plated dilutions of microbial suspensions were collected. The presumptive identification and grouping according to
phenotype were performed as reported by Martorana et al., (2017a). The pure cultures were stored in broth containing 20% (v/v) glycerol at −80 °C.
The LAB Gram positive and catalase negative were subjected to molecular analyses. In particular the DNA from LAB overnight
cultures was extracted from colonies by the InstaGene Matrix kit (Bio-Rad Laboratories, Hercules, CA, USA) and stored at −20
°C. The strains were grouped initially by random amplification of the polymorphic DNA-PCR (RAPD-PCR) analysis using single
primers M13, AB111 and AB106 as previously described by Gaglio et al., (2017).
The strains were identified at species level by multiplex PCR of the recA gene with species-specific primers for L. pentosus, L. plantarum and Lactobacillus paraplantarum, according to Torriani et al., (2001). One representative culture for each multiplex cluster and all strains that did not show amplification by multiplex PCR analysis
were analyzed by 16S rRNA gene sequencing as described by Weisburg et al., (1991).
2.4. Determination of volatile organic compounds (VOCs)TOP
The analysis of VOCs was undertaken at the end of fermentation (day 190). The table olives were subjected to GC/MS analysis
in order to identify the volatile organic compounds (VOCs). 0.5 g of drupes were homogenized and transferred to 2 mL vials
with pierceable silicone rubber septa coated with polytetrafluoroethylene (PTFE) film. One g of NaCl was added to increase
the extraction rate of volatile compounds. The extractions of VOCs were carried out using a SPME fiber of divinylbenzene/carboxen/polydimethylsiloxane
(Supelco, Bellefonte, PA) to analyze the SPME fiber as reported by Corona et al., (2016). The GC-MS system and chromatographic conditions described by Gaglio et al., (2014) were used for analysis. The detection was carried out by electron impact mass spectrometry in total ion current (TIC) mode
using an ionization energy of 70 eV. The mass acquisition range was m/z 30 to 330. The identification of volatiles was done
by injection of commercial standards and by comparing their mass spectra with those within the NIST/EPA/NIH Mass Spectral
Library database (Version 2.0d, build 2005). VOCs were expressed as relative peak areas (peak area of each compound/total
area) × l00. Determinations were carried out in triplicate for each sample.
2.5. Sensory evaluationTOP
At end of fermentation (day 190) the table olives were evaluated by 12 judges (6 female and 6 male, aged 20-35 years) using
the method UNI 10957 (2003), which is based on the use of 16 descriptors (green color intensity, brightness, green olive aroma,
complexity (odor), off-odors, crispness, easy stone detachment from the flesh, juicy, sweet, sour, bitter, salt, bitter and
complexity (taste), astringent, off-flavors and overall acceptability. The scale of values ranged from 1.00 (absence of sensation)
to 9.00 (extremely intense). For each trial, two panel sessions were performed. Before assessing the experimental samples,
the judges were trained using commercial table olives belonging to the Nocellara del Belice cultivar. The methodology has
been described in detail by Martorana et al., (2016, 2017a).
2.6. Statistical and explorative multivariate analysesTOP
Data obtained from the monitoring of pH, microbial population, VOCs and sensory analysis were subjected to statistical analysis
using a generalized linear model (GLM) based on an ANOVA model that included effects of trials and week (1st and 2nd) of production, as well as the interaction between trials and week of production. The post-hoc Tukey method was applied for
pair-wise comparison. Statistical significance was attributed to p values of < 0.05.
The resulting scores from the sensory analysis were averaged and compared. The ANOVA test was applied to identify significant
differences among olive attributes.
The values of pH and microbial population were also analyzed by an explorative multivariate analysis. The connection among
samples was determined with the agglomerative hierarchical clustering (AHC) based on level of dissimilarity (Euclidean distance)
among samples. The same data set from the pH and microbial analysis was subjected to canonical analysis (CA) using only the
variables that clustered samples into classes which resulted statistically significantly different.
The different VOCs of the table olives from different experimental trials were displayed by a heat map clustered analysis
(HMCA) as reported in Martorana et al., (2017a).
The multivariate statistical analysis was concluded using the data from the sensory analysis of fermented olives which were
subjected to preferences and satisfaction analyses (Jervis et al., 2016). In this analysis, in order to evaluate scores of preferences, judges were clustered into classes for the global appreciation
variable which was obtained and associated with the sensory attributes of table olives. Furthermore, an AHC and a PCA of sensory
scores were used to construct the external preference mapping (EPM) vector model. External preference mapping contour plots
were obtained using PREFMAP within XLSTAT Addinsoft (New York, NY).
All statistical data processing and graphical constructions were carried out using XLStat software version 2014.5.03 (Addinsoft,
New York, USA) for excel.
3. RESULTS AND DISCUSSIONSTOP
3.1. Monitoring of pHTOP
Data concerning the pH changes in brines during the entire period of olive production are shown in Figure 2A. Since the manufacturing process of olives followed the Spanish style, at the beginning of the process the pH value was about
8.5 in trials O1, O2, O3 and control C, which were not subjected to acidification by lactic acid addition. On the contrary,
the experimental trials EO1, EO2 and EO3 were added with lactic up to pH 7.5. A rapid decrease in pH within the first week
of olive manufacturing might inhibit the growth of spoilage populations thus reducing the risk of organoleptic alteration
of the final product. pH values higher than 5 might promote the growth of several spoilage microorganisms such as enterobacteria,
pseudomonads and staphylococci, which are usually hosted by olive drupes and responsible for organoleptic alterations (Martorana et al., 2017a). In addition, at high concentrations, yeasts might be responsible for the production of off-flavor (Arroyo-López et al., 2008).
|
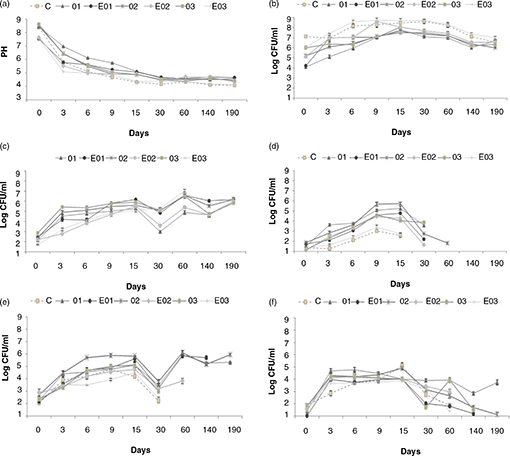 Figure 2. Values of pH changes (a) and microbial populations (b-f) of samples collected during table olive fermentation. Figure 2. Values of pH changes (a) and microbial populations (b-f) of samples collected during table olive fermentation.
Results
indicate the mean values of three measurements.
Abbreviations: C, control trial; O1, L. pentosus OM13 at 104 CFU/mL; EO1, L. pentosus OM13 at 104 CFU/mL + Acclimatization + Nutrient LBO2014 + Lactic acid; O2, L. pentosus OM13 at 105 CFU/mL; EO2, L. pentosus OM13 at 105 CFU/mL + Acclimatization + Nutrient LBO2014 + Lactic acid; O3, L. pentosus OM13 at 106 CFU/mL; EO3, L. pentosus OM13 at 106 CFU/mL + Acclimatization + Nutrient LBO2014 + Lactic acid.
Letters between brackets from a to f indicate values of pH
(a) and microbial counts of LAB on MRS (b), yeasts on DRBC (c), Enterobacteriaceae on VRBGA (d), pseudomonads on PAB (e) and staphylococci on BP (f) media.
|
|
The acidification kinetics of table olive and brine is closely correlated with the amount of organic acids, such as lactic
and acetic acids, which are produced by LAB during the olive fermentation process. Hence, methods to promote the growth of
LAB and decrease the pH are of paramount importance for improving the sensory quality of the final product (Martorana et al., 2017a). In the present study, the experimental design has been focused on innovative protocols to improve pH decrease through the
growth of LAB also when the population of inoculated LAB starter is lower than 107 CFU/mL of brine.
After three days of fermentation, the lowest values of pH (5.03) were observed in experimental trial EO3 inoculated with 106 CFU/mL of starter subjected to acclimatization and supplemented with nutrients and lactic acid up to pH 7.5 in the brine.
At day 6 the trials EO2 (4.98) and EO3 (4.99) showed the lowest pH values. On the 9th day the experimental productions C, O2, EO2, EO3 showed pH values lower than 5; the lowest values were observed for trials
C (4.31) and EO3 (4.38). Subsequently, these values remained almost constant until the end of the process (day 190) when lower
pH values were reached in trial EO3 (4.10) and control C (4.08). The other trials (O1, EO1, O2, EO2, O3) showed pH values
between 4.34-4.65.
3.2. Microbiological countsTOP
The changes in microbial populations were variable among trials and the results of counts are reported in Figure 2, b-f. During the first phase of fermentation (until the day 3), the highest levels of LAB population were reached by the
experimental trials EO3 (7.41 CFU/mL) and EO2 (6.97 CFU/mL), which were higher than or super-imposable to those found for
the control C (6.95 CFU/mL). Lower LAB levels were found in trials O1 (5.11 CFU/mL) and O2 (6.08 CFU/mL). These trends were
also observed in samples collected from day 6 to the end of fermentation (day 190) when trial EO3 showed 7.02 Log (CFU/mL)
and control C 6.55 Log (CFU/mL).
With regards to yeasts, at the beginning of process, these populations started from values of about 2.5 CFU/mL (Figure 2C) and showed a constant increase until the end of the trial when yeast counts were of about 6.0 CFU/mL in all trials. The
counts performed for Enterobacteriaceae, Pseudomonadaceae and Staphylococcaceae are also reported in Figures 2D, 2E, 2F. Members of the Enterobacteriaceae family reached higher values of about 5 Log (CFU/mL) at day 15 in trials O2, EO1 and O1; within the same period the lowest
concentrations of Enterobacteriaceae were found for experimental trial EO3 and control C, which did not show values higher than 3 Log (CFU/mL). With the exception
of trial O2, Enterobacteriaceae were detectable until day 35 in all trials. Staphylococci and pseudomonad populations reached their highest concentrations
of about 5 Log (CFU/mL) at day 15 in all trials and both populations remained at detectable levels in trials O1 and O2 until
the end of the process.
In the present study, similar LAB dynamics and pH changes were found which support those already published by Martorana et al., (2017a) during the entire period of olive manufacturing. These authors provided evidence that the addition of lactic acid, nutrient
adjuvants and, most importantly, the acclimatization of LAB cells significantly shortened the acidification process of olive
brine, prevented spoilage and improved sensory quality. These results are in accordance with the data reported by De Castro et al., (2002), which showed that LAB starter cultures, grown overnight in MRS in the presence of 4.5% w/v NaCl, allow the cells to adapt
to the stressful conditions of the brine and to dominate the fermentation process. In this study, the acclimatization process
was carried out during the industrial production process of table olives through the inoculum of the strain starter in brine.
In order to find significant differences among experimental trials, the values of microbial counts and changes in pH were
subjected to multivariate statistical analysis (Figures 3, 4 and 5). On the basis of AHC analysis (Figure 3), all trials were grouped into three classes at a dissimilarity level of 126.44%. Within classes, significant differences
were found in terms of variance; the experimental trial EO3 was closely related to control C and grouped into class 1 which
was characterized by the lowest values for within-class variance (21.27). Trials EO2 and O3 were further clustered into class
2, which showed 68.27 of within-class variance. The remaining experimental trials EO1, O1 and O2 were grouped together into
class 3, with 60.82 within-class variance.
|
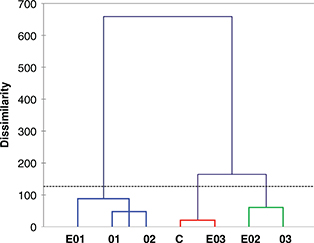 Figure 3. Dendrogram resulting from the agglomerative hierarchical clustering analysis based on values of pH and microbial populations. Figure 3. Dendrogram resulting from the agglomerative hierarchical clustering analysis based on values of pH and microbial populations.
Abbreviations: C, control trial; O1, L. pentosus OM13 at 104 CFU/mL; EO1, L. pentosus OM13 at 104 CFU/mL + Acclimatization + Nutrient LBO2014 + Lactic acid; O2, L. pentosus OM13 at 105 CFU/mL; EO2, L. pentosus OM13 at 105 CFU/mL + Acclimatization + Nutrient LBO2014 + Lactic acid; O3, L. pentosus OM13 at 106 CFU/mL; EO3, L. pentosus OM13 at 106 CFU/mL + Acclimatization + Nutrient LBO2014 + Lactic acid.
The dissimilarity among samples was measured by Euclidean distance,
whereas cluster aggregation was achieved by Ward’s method.
The blue, red and green colors of lines indicate the three clusters into which trials are grouped.
|
|
|
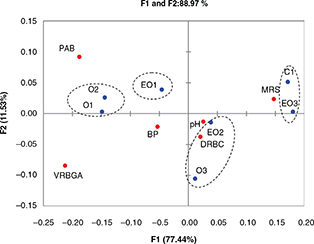 Figure 4. Symmetric plot from the canonical analysis based on values of pH and microbial populations. Figure 4. Symmetric plot from the canonical analysis based on values of pH and microbial populations.
Abbreviations: C, control trial;
O1, L. pentosus OM13 at 104 CFU/mL ; EO1, L. pentosus OM13 at 104 CFU/mL + Acclimatization + Nutrient LBO2014+ Lactic acid; O2, L. pentosus OM13 at 105 CFU/mL; EO2, L. pentosus OM13 at 105 CFU/mL + Acclimatization + Nutrient LBO2014+ Lactic acid; O3, L. pentosus OM13 at 106 CFU/mL; EO3, L. pentosus OM13 at 106 CFU/mL + Acclimatization + Nutrient LBO2014+ Lactic acid. MRS, Man-Rogosa-Sharpe agar for mesophilic rod LAB; DRBC, dichloran
rose bengal chloramphenico agar for total yeasts and filamentous fungi; VRBGA, violet red bile glucose agar for Enterobacteriaceae; PAB, Pseudomonas agar base for Pseudomonadaceae.
|
|
|
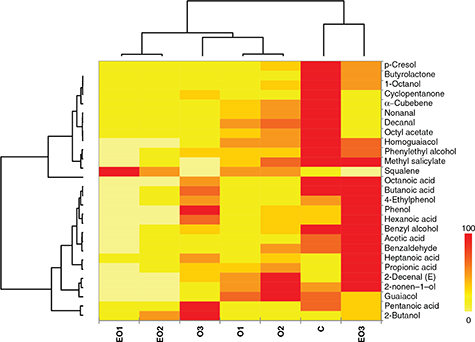 Figure 5. Distribution of volatile organic compounds (% area) among trials at the end (day 190) of olive fermentations. The heat map
plot depicts the relative percentage of each VOCs (variables clustering on the Y-axis) within each sample (X-axis clustering). Figure 5. Distribution of volatile organic compounds (% area) among trials at the end (day 190) of olive fermentations. The heat map
plot depicts the relative percentage of each VOCs (variables clustering on the Y-axis) within each sample (X-axis clustering).
Abbreviations: C, control trial; O1, L. pentosus OM13 at 104 CFU/mL; EO1, L. pentosus OM13 at 104 CFU/mL + Acclimatization + Nutrient LBO2014 + Lactic acid; O2, L. pentosus OM13 at 105 CFU/mL; EO2, L. pentosus OM13 at 105 CFU/mL + Acclimatization + Nutrient LBO2014 + Lactic acid; O3, L. pentosus OM13 at 106 CFU/mL; EO3, L. pentosus OM13 at 106 CFU/mL + Acclimatization + Nutrient LBO2014 + Lactic acid.
The values for VOCs concentration are depicted by color intensity
from yellow (lowest concentration) to red (highest concentration).
|
|
The results from the AHC analysis, which showed the values of microbial and pH variables associated with each class. In particular,
the variables that mainly affected the distribution of trials were pH values and LAB, Enterobacteriaceae and pseudomonads concentrations. No significant differences were found among classes in terms of minimum and maximum values
of variables.
With the aims to find correlations among the experimental treatments and physico-chemical and microbiological characteristics
of table olives, the data were further investigated by explorative multivariate correspondence analysis as shown by the symmetric
plot (Figure 4), which explained 88.97% of total inertia. All experimental trials were clustered into three main clusters and they were
mainly separated along Factor 1 axes, which explained 77.44% of total variability. Interestingly, a close distribution was
found between trial EO3 and control C1, which were significantly correlated with the high values of the MRS variable. Trial
EO2 was manly correlated with pH values and also with MRS.
On the other hand, trials O1 and O2, which were carried out without acclimatization of starter cells and adjuvants, were mainly
correlated with PAB and VRBGA variables. High differences, along the F1 and F2 axes, were found between trials EO3 and O3,
as well as between experimentations EO2 and O2. These results showed that the acclimatization procedures and addition of nutrients
and lactic acid affected the kinetics of brine acidification and microbial growth, in particular that of LAB population.
3.3. Characterization and distribution of LABTOP
One thousand, two hundred and twenty colonies were collected from the highest plated dilutions of cell suspensions. After
a purification phase, they were subjected to microscopic inspection and all cultures with the shape morphology typical of
lactobacilli were phenotypically investigated. Nine hundred and fifty-two cultures which resulted from Gram positive and catalase
negative were considered presumptive LAB, and phenotypically grouped. Due to the high number of isolates, about 40% of the
presumptive LAB cultures (381 isolates) were further grouped and selected on the basis of experimental trial and day of fermentation.
All these selected cultures were subjected to RAPD-PCR analysis in order to identify the presence of the reference starter
strain L. pentosus OM13 used for the inoculum. 76.8 and 65.6% of the isolates, showed polymorphic profiles with high levels (> 95%) of similarity
with the reference strain OM13 from trials EO3 and EO2, respectively. In trial EO1, the percentage of isolates with a polymorphic
profile similar to OM13 was 60.3%. For the control C, a similar value (74.6%) to those reported above was found. Although
experimental trials EO3 and EO2 were fermented with the inoculum of starter OM13 at a concentration of 2 Log cycles lower
than the control C, the starter strain OM13 was able to dominate indigenous LAB population as well as to promote a rapid decrease
in pH by day 3 of fermentation. In experimental productions that did not provide for acclimatization of the OM13 strain (O1,
O2 and O3) the percentage of isolates with polymorphic profiles similar to the starter strain were between 59.8–70.2%. Thus,
in accordance with the results reported by Martorana et al., (2017a), the acclimatization of LAB starter cells has been confirmed once again as a method for improving starter culture growth
during table olive manufacturing. Three isolates with RAPD profiles identical to the starter strain OM13 were also subjected
to 16S rRNA gene sequencing which confirmed the species identity as L. pentosus (accession number MF577062).
Within the class of LAB, four strains were identified by using 16S rRNA gene sequencing as L. plantarum (accession number MF577063) and seven strains as Pediococcus pentosaceus (accession number MF577063). These species were mainly found during the first sampling phases in trials O1, O2 and EO1; furthermore,
the species P. pentosaceus was isolated until the end of fermentation (day 190) in trial O1.
All LAB species reported above are normally isolated during the fermentation of table olives as already reported by Martorana et al., (2016, 2017a). These species represent part of the microbial ecology of table olive fermentation and might significantly contribute to
the acidification and aroma of the final product. The level of species diversity of LAB was not high since all experimental
trials were inoculated with the starter strain OM13. Generally, high values of microbial diversity have been found during
spontaneous fermentation, as previously reported by several authors (Hurtado et al., 2008), as well as described for food fermentations such as wine, cheese and salami (Moschetti et al., 2016; Gaglio et al., 2016a, b).
Explorative multivariate analysis has been widely applied to monitor the microbiological and chemical changes during experimental
productions of table olives (Rodríguez-Gómez et al., 2012; Martorana et al., 2015, 2016, 2017b). In particular, the clustering analysis combined with graphical representation by a heat map plot is a useful method to
depict a large data set and underline the main differences among experimental trials.
3.4. VOCs in fermented olivesTOP
Volatile organic compounds might significantly affect the organoleptic characteristics of fermented table olives due to the
enzymes produced by microbial populations that occur during the entire manufacturing process (Sabatini and Marsilio 2008). In the present work, the VOC profile has been determined on table olives at the end of the fermentation period (day 190),
as shown in Table 1. A total of 27 compounds belonging to groups of aldehydes, ketones, alcohols, alkanes and furans were identified. High concentrations
of 2-butanol, acetic and propionic acids, homoguaiacol and 4-ethylphenol were found in trials EO3, EO2 and O3. The chemical
squalene reached its highest concentration in trials EO1, EO2 and O1.
Table 1. Concentrations of volatile organic compounds (% area) at the end (day 190) of olive fermentations.
| Compounds |
Control C |
Trial O1 |
Trial EO1 |
Trial O2 |
Trial EO2 |
Trial O3 |
Trial EO3 |
Statistical significance |
| 2-Butanol |
9.74±0.27cd |
3.47±0.03de |
1.17±0.06e |
4.35±0.04de |
20.46±3.54b |
13.84±1.25bc |
62.04±5.87a |
*** |
| 2-nonen-1-ol |
0.55±0.03b |
0.55±0.11b |
0.15±0.02c |
0.89±0.07a |
0.17±0.06c |
0.85±0.09a |
0.28±0.04c |
*** |
| Nonanal |
4.01±0.14a |
1.38±0.09c |
0.16±0.01e |
1.72±0.06b |
0.35±0.09e |
0.84±0.11d |
0.26±0.02e |
*** |
| Acetic acid |
7.01±0.18b |
2.74±0.06cd |
0.34±0.11e |
3.43±0.33c |
2.06±0.36d |
12.00±0.98a |
3.45±0.11c |
*** |
| Octyl acetate |
0.84±0.06a |
0.27±0.01d |
0.06±0.00c |
0.35±0.02b |
0.04±0.00d |
0.00±0.00d |
0.04±0.00d |
*** |
| α -Cubebene |
0.55±0.05a |
0.14±0.03c |
0.05±0.01d |
0.22±0.01b |
0.06±0.00d |
0.08±0.04cd |
0.08±0.02cd |
*** |
| Decanal |
1.27±0.11a |
0.51±0.04c |
0.05±0.02d |
0.69±0.06b |
0.11±0.02d |
0.13±0.03d |
0.04±0.02d |
*** |
| Benzaldehyde |
0.70±0.04b |
0.39±0.01c |
0.09±0.04d |
0.63±0.08b |
0.17±0.11d |
1.13±0.11a |
0.25±0.01cd |
*** |
| Propionic acid |
3.12±0.22cd |
8.55±0.81b |
0.83±0.14d |
10.88±2.33b |
7.43±0.78bc |
23.72±3.33a |
10.44±1.44b |
*** |
| 1-Octanol |
1.39±0.08a |
0.24±0.01d |
0.04±0.00f |
0.36±0.01c |
0.07±0.00ef |
0.60±0.05b |
0.15±0.00de |
*** |
| Butyrolactone |
0.97±0.07a |
0.10±0.04cd |
0.04±0.00d |
0.19±0.01c |
0.07±0.00d |
0.35±0.07b |
0.13±0.00cd |
*** |
| Butanoic acid |
1.45±0.09ab |
0.21±0.07cd |
0.10±0.01d |
0.53±0.04c |
0.27±0.03cd |
1.74±0.26a |
1.36±0.12b |
*** |
| 2-Decenal (E) |
0.11±0.01cd |
0.21±0.05b |
0.06±0.00d |
0.31±0.04a |
0.07±0.02d |
0.31±0.03a |
0.19±0.02bc |
*** |
| Pentanoic acid |
0.69±0.08b |
0.10±0.02d |
0.03±0.00e |
0.18±0.03 |
0.05±0.01d |
0.30±0.02c |
1.25±0.01a |
*** |
| Methyl salicylate |
0.41±0.02a |
0.19±0.01a |
0.04±0.02a |
0.34±0.02a |
0.09±0.02a |
0.38±0.38a |
0.05±0.00a |
N.S. |
| Hexanoic acid |
0.34±0.02bc |
0.27±0.05cd |
0.08±0.04e |
0.35±0.10bc |
0.13±0.02de |
0.61±0.06a |
0.43±0.05b |
*** |
| Guaiacol |
0.97±0.14ab |
1.07±0.03a |
0.04±0.00e |
1.23±0.06a |
0.14±0.03de |
0.74±0.23bc |
0.44±0.06cd |
*** |
| Cyclopentanone |
0.74±0.06a |
0.02±0.00d |
0.10±0.02bc |
0.07±0.00bcd |
0.05±0.00cd |
0.06±0.00cd |
0.13±0.00b |
*** |
| Benzyl alcohol |
2.12±0.20b |
1.04±0.04c |
0.09±0.03e |
1.28±0.10c |
0.61±0.06d |
2.60±0.21a |
1.18±0.08c |
*** |
| Phenylethyl alcohol |
3.77±0.17a |
1.56±0.14c |
0.12±0.01e |
1.74±0.16c |
0.84±0.08d |
2.53±0.18b |
1.54±0.36c |
*** |
| Homoguaiacol |
32.89±1.86a |
20.18±0.90b |
2.43±0.24d |
21.43±1.88b |
7.09±0.66cd |
24.57±2.63b |
12.40±4.22c |
*** |
| Heptanoic acid |
0.00±0.00d |
0.07±0.01cd |
0.05±0.02d |
0.14±0.06bc |
0.06±0.00cd |
0.48±0.05a |
0.19±0.00b |
* |
| Phenol |
0.41±0.04b |
0.27±0.03cd |
0.06±0.03e |
0.38±0.05bc |
0.14±0.00de |
0.67±0.06a |
0.62±0.08a |
*** |
| Octanoic acid |
0.46±0.05a |
0.12±0.02c |
0.08±0.03c |
0.18±0.09c |
0.08±0.00c |
0.49±0.04a |
0.33±0.02b |
** |
| p-Cresol
|
0.84±0.07a |
0.15±0.01cd |
0.05±0.02d |
0.24±0.12bc |
0.09±0.00cd |
0.33±0.02b |
0.15±0.01cd |
*** |
| 4-Ethylphenol |
2.54±0.10b |
0.95±0.08c |
0.17±0.09c |
1.03±0.21c |
1.17±0.12c |
5.61±0.86a |
2.58±0.42b |
*** |
| Squalene |
22.11±2.30d |
55.25±2.56bc |
93.52±5.25a |
46.86±3.77c |
58.13±6.11b |
5.04±0.21e |
0.00±0.00e |
*** |
Abbreviations: C, control trial; O1, L. pentosus OM13 at 104 CFU/mL; EO1, L. pentosus OM13 at 104 CFU/mL + Acclimatization + Nutrient LBO2014+ Lactic acid; O2, L. pentosus OM13 at 105 CFU/mL; EO2, L. pentosus OM13 at 105 CFU/mL + Acclimatization + Nutrient LBO2014+ Lactic acid; O3, L. pentosus OM13 at 106 CFU/mL; EO3, L. pentosus OM13 at 106 CFU/mL + Acclimatization + Nutrient LBO2014+ Lactic acid.All determinations were carried out in triplicate and mean value
± standard deviation reported.
Data within a line followed by the same letter are not significantly different according to
Tukey’s test.
ANOVA p value: *, p < 0.05 **, p < 0.01; ***, p < 0.001, N.S., not significant |
However, in order to better investigate the effect of experimental treatments on the VOC composition and concentration of
final products, the data set of VOCs was also subjected to a multivariate statistical analysis and the results are illustrated
by heat map plot (Figure 5). Interestingly, all the trials were grouped into two mega-clusters and the VOC profile of trial EO3 was closely related
to that of control C. On the other hand, all remaining trials were grouped into one mega-cluster where trials EO1 and EO2
were significantly separated from trials O1, O2 and O3. Thus, the experimental procedures based on starter cell acclimatization
and the addition of nutrients and lactic acid were confirmed to be a effective strateies to differentiate the VOC profiles
of fermented olives and to confirm the results already published by Martorana et al., (2017a).
3.5. Sensory attributes of fermented olivesTOP
The olive samples collected at the end of the fermentation process (day 190) were subjected to a sensory analysis by 12 trained
panelists who identified a total of 16 attributes as reported in Table 2.
Table 2. Sensory scores for olives collected at the end (day 190) of fermentation.
| Descriptors |
Trials |
SEM |
Statistical significance |
| C |
O1 |
EO1 |
O2 |
EO2 |
O3 |
EO3 |
| Green color intensity |
6.22ab |
6.20ab |
6.21ab |
6.05b |
6.45a |
6.15ab |
6.37ab |
0.03 |
* |
| Brightness |
5.30ab |
4.62c |
5.00b |
5.16ab |
5.40a |
5.15ab |
5.10ab |
0.06 |
** |
| Green olive aroma |
7.02b |
6.11c |
6.80b |
6.11c |
6.87b |
6.27c |
7.40a |
0.11 |
*** |
| Complexity (odor) |
7.77ab |
7.20d |
7.02cd |
7.35cd |
7.50bc |
7.35cd |
8.10a |
0.08 |
*** |
| Off-odors |
1.00b |
1.89a |
1.78a |
1.60a |
1.00b |
1.00b |
1.00b |
0.09 |
*** |
| Crispness |
5.77a |
5.64a |
5.82a |
5.64a |
5.90a |
5.75a |
5.88a |
0.03 |
N.S. |
| Easy stone |
6.22a |
5.50c |
5.55c |
5.80bc |
6.04ab |
6.12ab |
6.04ab |
0.06 |
** |
| Juicy |
7.35a |
7.11bc |
7.28ab |
7.01c |
7.11bc |
7.20abc |
7.21abc |
0.03 |
* |
| Sweet |
4.60ab |
4.15c |
4.30bc |
4.70a |
4.50ab |
4.50ab |
4.57ab |
0.04 |
* |
| Sour |
4.50ab |
4.26b |
4.53a |
4.52a |
4.54a |
4.57a |
4.47ab |
0.03 |
* |
| Bitter |
2.45d |
3.12a |
3.00ab |
2.80bc |
2.80bc |
2.70cd |
2.60cd |
0.05 |
** |
| Salt |
3.84a |
3.15b |
3.27b |
3.24b |
3.70a |
3.33b |
3.74a |
0.06 |
** |
| Complexity (taste) |
7.88ab |
6.50e |
7.30c |
6.95d |
7.68b |
7.10cd |
8.01a |
0.11 |
*** |
| Astringent |
2.12c |
2.66ab |
2.35bc |
2.77a |
2.52ab |
2.34bc |
2.12c |
0.06 |
** |
| Off-flavors |
1.00b |
1.30ab |
1.21ab |
1.45a |
1.00b |
1.17ab |
1.00b |
0.04 |
* |
| Overall acceptability |
7.85b |
7.15c |
7.60b |
7.20c |
7.70b |
7.74b |
8.35a |
0.09 |
*** |
Results indicate mean value of each sensorial attribute evaluated by 12 trained panelists.
Data within a line followed by the
same letter are not significantly different according to Tukey’s test.
ANOVA p value: *. p < 0.05 **. p < 0.01; ***. p < 0.001; N.S., not significant.
Abbreviations: C, control trial; O1, L. pentosus OM13 at 104 CFU/mL; EO1, L. pentosus OM13 at 104 CFU/mL + Acclimatization + Nutrient LBO2014 + Lactic acid; O2, L. pentosus OM13 at 105 CFU/mL; EO2, L. pentosus OM13 at 105 CFU/mL + Acclimatization + Nutrient LBO2014 + Lactic acid; O3, L. pentosus OM13 at 106 CFU/mL; EO3, L. pentosus OM13 at 106 CFU/mL + Acclimatization + Nutrient LBO2014 + Lactic acid. |
Statistically significant differences (p < 0.05) among experimental olives were found for several descriptors. Olives from
trials EO3 and EO2 showed the highest scores for odor and flavor complexities and green olive aroma. Although the experimental
trials EO3 and EO2 were performed by inoculating the OM13 starter at a level significantly lower than those of control C,
the sensory profiles of experimental olives EO3 and EO2 were positively appreciated by panelists and reached high scores of
overall acceptability. Similar values were obtained by Martorana et al., (2017a) who showed the effects of cell acclimatization and nutrient supplements on the sensory characteristics of fermented olives
for the first time.
The sensory profiles of fermented olives are significantly affected by diversity and the concentration of many chemicals,
in particular organic acids, phenols and VOCs. The presence of these chemicals compounds in the final product is influenced
by the growth of the microbial population and by the diversity of LAB strain during the fermentation process (Martorana et al., 2015).
The presence of off-odors and off-flavors (such as fecal, putrid, etc.) in fermented olives is closely related to the growth
of spoilage microorganisms which belong to enterobacteria and pseudomonads groups (Randazzo et al., 2017). Furthermore, the bitter taste, which is not usually accepted by consumers, might be improved by intense growth of LAB,
which are able to degrade phenols into other less-bitter compounds (Marsilio et al., 2006).
The results from the sensory analysis were also subjected to a statistical multivariate analysis through the construction
of an external preference map, as shown in Figure 6. This graphical representation included the position of the ideal point and iso-preference curves for the vectorial model
related to six different clusters. By analysis of the model selection, cluster 2 was recognized as the ideal point type and
correlated with values of 8.16 F1 and 13.11 F2 axes. The experimental trials EO3, EO2 and control C were clustered into one
main group that was significantly correlated with the ideal point cluster 2 since these trials were preferred by 60-80% of
panelists. On the contrary, the experimental olives from trial O1, which was not subjected to cell acclimatization or supplement
addition, was closely related to cluster 3, identified as an anti-ideal point type. Furthermore, the olives from trial O1
were preferred by only 20-40% of the judges.
|
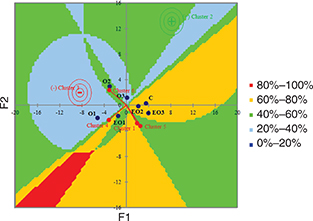 Figure 6. Contour plot based on results from the sensory analysis performed on table olives at the end of fermentation (day 190). Figure 6. Contour plot based on results from the sensory analysis performed on table olives at the end of fermentation (day 190).
Abbreviations: C, control trial; O1, L. pentosus OM13 at 104 CFU/mL; EO1, L. pentosus OM13 at 104 CFU/mL + Acclimatization + Nutrient LBO2014+ Lactic acid; O2, L. pentosus OM13 at 105 CFU/mL; EO2, L. pentosus OM13 at 105 CFU/mL + Acclimatization + Nutrient LBO2014 + Lactic acid; O3, L. pentosus OM13 at 106 CFU/mL; EO3, L. pentosus OM13 at 106 CFU/mL + Acclimatization + Nutrient LBO2014+ Lactic acid.
Legend: values (%) of preferences and satisfaction for table
olive samples shown by judges.
Preferences and satisfaction (%) for table olive samples.
Clusters are based on the segmentation
of the judges by groups of similar preferences.
|
|
4. CONCLUSIONSTOP
The present study evaluated the effect of the acclimatization of LAB cell and supplement (nutrient and lactic acid) addition
to improve the growth and dominance of the LAB starter during olive fermentation.
The microbiological results confirmed significant and positive effects of these innovative procedures on the ability of starter
OM13 to dominate indigenous microbial populations during the fermentation of table olives. A significant effect was also found
in terms of acidification kinetics within the first week of fermentation.
Furthermore, the cell acclimatization procedure was found to improve the dominance of starter OM13 even just after the inoculum
into brine, when its population levels were 2 Log cycles lower than that commonly reached during standard fermentation.
The treatment EO3 showed characteristics similar to those obtained for trial C. This trend was also confirmed by the results
from the sensory analysis, since trials C, EO2 and EO3 showed high values of preference and satisfaction, as well as by the
PCA and AHC results, which indicated that trials C and EO3 were closely related to the population of LAB.
ACKNOWLEDGMENTSTOP
This work was financially supported by P.O.N. RICERCA E COMPETIVITA’ 2007-2013. Progetto “Di.Me.Sa.”- Valorizzazione di prodotti
tipici della Dieta Mediterranea e loro impiego a fini salutistici e nutraceutici. Code of Project: PON02_00667 – PON02_00451_3361785.
The authors wish to thank the enterprise Geolive Belice S.A.S. and Dr. Francesco La Croce (Olive da tavola Castelvetrano,
Trapani, Italy) for its technical support during the fermentation process of drupes, the company LALLEMAND Inc. (1620 rue
Prefontaine Montreal Quebec H1W 2N8, Canada) for its significant support to lyophilize L. pentosus OM13 strains, and to produce nutrient supplements, and Rosario Prestianni for his support in microbiological and chemical
analyses.
The authors are also grateful to the Dr. Specht Gordon for proof-reading the final version of English.
REFERENCESTOP
| ○ |
Aponte M, Blaiotta G, La Croce F, Mazzaglia A, Farina V, Settanni L, Moschetti G. 2012. Use of selected autochthonous lactic
acid bacteria for Spanish- style table olive fermentation. Food Microbiol. 30, 8–16. https://doi.org/10.1016/j.fm.2011.10.005 |
| ○ |
Arroyo-López FN, Querol A, Bautista-Gallego J, Garrido-Fernández A. 2008. Role of yeasts in table olive production. Int. J. Food Microbiol. 128, 189–196. https://doi.org/10.1016/j.ijfoodmicro.2008.08.018 |
| ○ |
Castro A de, Montaño A, Casado FJ, Sánchez A H, Rejano L. 2002. Utilization of Enterococcus casseliflavus and Lactobacillus pentosus as starter cultures for Spanish-style green olive fermentation. Food Microbiol. 19(6), 637–644. https://doi.org/10.1006/fmic.2002.0466 |
| ○ |
Chasseriaud L, Krieger-Weber S, Déléris-Bou M, Sieczkowski N, Jourdes M, Teissedre PL, Claisse O, Lonvaud-Funel A. 2015. Hypotheses
on the effects of enological tannins and total red wine phenolic compounds on Oenococcus oeni. Food Microbiol. 52, 131–137. https://doi.org/10.1016/j.fm.2015.07.002 |
| ○ |
Corona O, Alfonzo A, Ventimiglia G, Nasca A, Francesca N, Martorana A, Moschetti G, Settanni L. 2016. Industrial application
of selected lactic acid bacteria isolated from local semolinas for typical sourdough bread production. Food Microbiol. 59, 43–56. https://doi.org/10.1016/j.fm.2016.05.006 |
| ○ |
Francesca N, Barbera M, Martorana A, Saiano F, Gaglio R, Aponte M, Moschetti G, Settanni L. 2016. Optimised method for the
analysis of phenolic compounds from caper (Capparis spinosa L.) berries and monitoring of their changes during fermentation. Food Chem. 196, 1172–1179. https://doi.org/10.1016/j.foodchem.2015.10.045 |
| ○ |
Gaglio R, Scatassa ML, Cruciata M, Miraglia V, Corona O, Di Gerlando R, Portolano B, Moschetti G, Settanni L. 2014. In vivo application and dynamics of lactic acid bacteria for the four-season production of Vastedda-like cheese. Int. J. Food Microbiol. 177, 37–48. https://doi.org/10.1016/j.ijfoodmicro.2014.02.007 |
| ○ |
Gaglio R, Francesca N, Maniaci G, Corona O, Alfonzo A, Giosuè C, Di Noto A, Cardamone C, Sardina MT, Portolano B, Alabiso,
M. 2016a. Valorization of indigenous dairy cattle breed through salami production. Meat Sci. 114, 58–68. https://doi.org/10.1016/j.meatsci.2015.12.014 |
| ○ |
Gaglio R, Cruciata M, Di Gerlando R, Scatassa ML, Cardamone C, Mancuso I, Sardina MT, Moschetti G, Portolano B, Settanni L.
2016b. Microbial activation of wooden vats used for traditional cheese production and evolution of the neo-formed biofilms.
Appl. Environ. Microb. 82, 585–595. https://doi.org/10.1128/AEM.02868-15 |
| ○ |
Gaglio R, Francesca N, Di Gerlando R, Mahony J, De Martino S, Stucchi C, Moschetti G, Settanni L. 2017. Enteric bacteria of
food ice and their survival in alcoholic beverages and soft drinks. Food Microbiol. 67, 17–22.
|
| ○ |
Garrido-Fernández A, Fernández Díez MJ, Adams MR. 1997. Table Olives, Production and Processing. Champman and Hall, London.
|
| ○ |
Holzapfel WH. 2002. Appropriate starter culture technologies for small-scale fermentation in developing countries. Int. J. Food Microbiol. 75, 197–212. https://doi.org/10.1016/S0168-1605(01)00707-3 |
| ○ |
Hurtado A, Reguant C, Esteve-Zarzoso B, Bordons A, Rozès N. 2008. Microbial population dynamics during the processing of Arbequina
table olives. Food Res. Int. 41, 738–744. https://doi.org/10.1016/j.foodres.2008.05.007 |
| ○ |
Hurtado A, Reguant C, Bordons A, Rozès N. 2012. Lactic acid bacteria from fermented table olives. Food Microbiol. 31, 1–8. https://doi.org/10.1016/j.fm.2012.01.006 |
| ○ |
Jervis SM, Guthrie B, Guo G, Worch T, Hasted A, Drake MA. 2016. Comparison of Preference Mapping Methods on Commodity Foods
with Challenging Groups of Low-Variance Attributes: Sliced Whole Wheat Sandwich Bread Example. J. Sens. Stud. 31, 34–49. https://doi.org/10.1111/joss.12188 |
| ○ |
Kontkanen D, Inglis DL, Pickering GJ, Reynolds A. 2004. Effect of yeast inoculation rate, acclimatization, and nutrient addition
on icewine fermentation. Am. J. Enol. Viticult. 55, 363–370.
|
| ○ |
Marsilio V, d’Andria R, Lanza B, Russi F, Iannucci E, Lavini A, Morelli G. 2006. Effect of irrigation and lactic acid bacteria
inoculants on the phenolic fraction, fermentation and sensory characteristics of olive (Olea europaea L. cv. Ascolana tenera) fruits. J. Sci. Food Agr. 86, 1005–1013. https://doi.org/10.1002/jsfa.2449 |
| ○ |
Martorana A, Alfonzo A, Settanni L, Corona O, La Croce F, Caruso T, Moschetti G, Francesca N. 2015. An innovative method to
produce green table olives based on “pied de cuve” technology. Food Microbiol. 50, 126–140. https://doi.org/10.1016/j.fm.2015.03.008 |
| ○ |
Martorana A, Alfonzo A, Settanni L, Corona O, La Croce F, Caruso T, Moschetti G, Francesca N. 2016. Effect of the mechanical
harvest of drupes on the quality characteristics of green fermented table olives. J. Sci. Food Agr. 96, 2004–2017. https://doi.org/10.1002/jsfa.7311 |
| ○ |
Martorana A, Alfonzo A, Gaglio R, Settanni L, Corona O, La Croce F, Vagnoli P, Caruso T, Moschetti G, Francesca N. 2017a.
Evaluation of different conditions to enhance the performances of Lactobacillus pentosus OM13 during industrial production of Spanish-style table olives. Food Microbiol. 61, 150–158. https://doi.org/10.1016/j.fm.2016.08.007 |
| ○ |
Martorana A, Di Miceli C, Alfonzo A, Settanni L, Gaglio R, Caruso T, Moschetti G, Francesca N. 2017b. Effects of irrigation
treatments on the quality of table olives produced with the Greek-style process. Ann. Microbiol. 67, 37–48. https://doi.org/10.1007/s13213-016-1234-2 |
| ○ |
Moschetti G, Corona O, Gaglio R, Squadrito M, Parrinello A, Settanni L, Barone E, Francesca N. 2016. Use of fortified pied
de cuve as an innovative method to start spontaneous alcoholic fermentation for red winemaking. Aust. J. Grape Wine R. 22, 36–45. https://doi.org/10.1111/ajgw.12166 |
| ○ |
Oliveira T, Ramalhosa E, Nunes L, Pereira JA, Colla E, Pereira EL. 2017. Probiotic potential of indigenous yeasts isolated
during the fermentation of table olives from Northeast of Portugal. Innov. Food Sci. Emerg. In press. https://doi.org/10.1016/j.ifset.2017.06.003 |
| ○ |
Panagou EZ, Tassou CC, Katsaboxakis CZ. 2003. Induced lactic acid fermentation of untreated green olives of the Conservolea
cultivar by Lactobacillus pentosus. J. Sci. Food Agr. 83, 667–674. https://doi.org/10.1002/jsfa.1336 |
| ○ |
Randazzo CL, Todaro A, Pino A, Pitino I, Corona O, Caggia C. 2017. Microbiota and metabolome during controlled and spontaneous
fermentation of Nocellara Etnea table olives. Food Microbiol. 65, 136–148. https://doi.org/10.1016/j.fm.2017.01.022 |
| ○ |
Rodríguez-Gómez F, Romero-Gil V, Bautista-Gallego J, Garrido-Fernández A, Arroyo López FN. 2012. Multivariate analysis to
discriminate yeasts strains with technological applications in table olive processing. World J. Microb. Biot. 28, 1761–1770. https://doi.org/10.1007/s11274-011-0990-1 |
| ○ |
Sabatini N, Marsilio V. 2008. Volatile compounds in table olives (Olea europaea L., Nocellara del Belice cultivar). Food Chem. 107, 1522–1528. https://doi.org/10.1016/j.foodchem.2007.10.008 |
| ○ |
Servili M, Settanni L, Veneziani G, Esposto S, Massitti O, Taticchi A, Urbani S, Montedoro GF, Corsetti A. 2006. The use of
Lactobacillus pentosus 1MO to shorten the debittering process time of black table olives (Cv. Itrana and Leccino): a pilot-scale application. J. Agr. Food Chem. 54, 3869–3875. https://doi.org/10.1021/jf053206y |
| ○ |
Teixeira P, Castro H, Kirby R. 1995. Spray drying as a method for preparing concentrated cultures of Lactobacillus bulgaricus. J. Appl. Microbiol. 78, 456–462. https://doi.org/10.1111/j.1365-2672.1995.tb03433.x |
| ○ |
Torriani S, Felis GE, Dellaglio F. 2001. Differentiation of Lactobacillus plantarum, L. pentosus, and L. paraplantarum by recA gene sequence analysis and multiplex PCR assay with recA gene-derived primers. Appl. Environ. Microb. 67, 3450–3454. https://doi.org/10.1128/AEM.67.8.3450-3454.2001 |
| ○ |
Weisburg WG, Barns SM, Pelletier DA, Lane DJ. 1991. 16S ribosomal DNA amplification for phylogenetic study. J. Bacteriol. 173, 697–703.
|