Variability of seed oil content, fatty acid composition, and nervonic acid content in Acer truncatum, native to 14 regions of China
Q. Qiao, W. Xue and Z. Feng*
1College of forestry Shandong Agricultural University, Taian 271018, Shandong, China
*Corresponding author: fengzn408@qq.com; 1226694758@qq.com
| |
SUMMARY
The seed oil of 138 accessions of 14 Acer truncatum (Aceraceae family) populations native to China were analyzed by pulsed nuclear magnetic resonance spectroscopy and gas chromatography-flame
ionization detection. The oil content ranged from 17.81% to 36.56% (mean: 28.57%), which mainly consisted of 14 types of fatty
acids. Palmitic (4.69%), stearic (2.30%), oleic (25.19%), linoleic (32.97%), linolenic (2.76%), cis-11-eicosenoic (7.90%),
erucic (16.49%), and nervonic (5.76%) fatty acids accounted for 98% of total fat. The nervonic acid content ranged from 3.90%
to 7.85% among the accessions. Significant variations in oil content and predominating fatty acids were observed among populations.
Hierarchical cluster analysis and principal component analysis detected obvious geographical variation trends among A. truncatum populations which correlate with environmental variations (especially altitude, temperature, and precipitation) and supported
the grouping of the populations into three groups according to geographic locations.
|
| |
RESUMEN
Variabilidad del contenido de aceite, composición en ácidos grasos y contenido de ácido nervónico en semillas Acer truncatum nativas de 14 regiones de China. El aceite de semillas de 138 accesiones de 14 poblaciones de Acer truncatum (familia Aceraceae) nativas de China se analizaron mediante espectroscopía de resonancia magnética nuclear pulsada y cromatografía
de gases y detección de ionización de llama. El contenido de aceite varió de 17.81% a 36.56% (promedio: 28.57%), y están formadas
principalmente por 14 tipos de ácidos grasos. Palmítico (4.69%), esteárico (2.30%), oleico (25.19%), linoleico (32.97%), linolénico
(2.76%), cis-11-eicosenoico (7.90%), erúcico (16.49%) y nervónico (5.76 %) los ácidos grasos representaron el 98% de la grasa
total. El contenido de ácido nervónico varió de 3,90% a 7,85% entre las accesiones. Se observaron variaciones significativas
en el contenido de aceite y en los ácidos grasos predominantes entre las poblaciones. El análisis jerárquico de conglomerados
y el análisis de componentes principales detectaron evidentes variaciones geográficas entre las poblaciones de A. truncatum que se correlacionaban con las variaciones ambientales (especialmente altitud, temperatura y precipitación) y permitieron
agrupar las poblaciones en tres grupos según las ubicaciones geográficas.
|
1. INTRODUCTIONTOP
Plant seeds are an important source of oil, which serves as a staple agricultural food product and an important industrial
raw material. Moreover, plant seed oils are an increasingly important renewable and environmentally safe bioenergy resource.
However, increasing demand for seed oil has resulted in increasingly prevalent and serious oil shortages. To address this
problem, efforts have been focused on the development of woody oil trees, which have recently become a major edible oil source
in some western European countries. Woody crop oils with a large share of the edible oil market include coconut, olive, palm,
almond, walnut, and tea oils. However, there are many potentially excellent woody edible oils in nature that have not been
exploited, including those coming from maple tree species.
Acer truncatum, a member of the Aceraceae family, and is a forest tree species native to northern China, Korea and Japan, but can also be
found in Europe and North America (Guo et al., 2014). It is a deciduous tree species native to northern and western China, and it is mainly distributed in the Yellow River basin,
the northeast, Inner Mongolia, Jiangsu, Sichuan and other regions. This species of maple has been commonly chosen as a landscape
tree for its brilliant autumn leaf color (Zhao et al., 2007; Li et al., 2015). A. truncatum is also an ideal source of timber, protein, medicinal substances, and chemical raw materials due to its sturdy texture and
high levels of protein, chlorogenic acid, tannin, and flavonoids (Ma et al., 2005). In addition, its abundant oil seeds have been roasted for many years for use as a food source in northeastern China, but
have not yet been used on a large scale. Previous studies (Wang et al., 2006; Hu et al., 2017; Sun et al., 2018) have suggested that maple seed oil would be an excellent edible oil because it contains a large percentage of unsaturated
fatty acids (92%) and nervonic acid (6.22%). Notably, nervonic acid, an important fatty acid for brain growth and maintenance,
has been shown to prevent neural deficits and shows promise for the treatment of neurological disorders such as schizophrenia
and psychosis (Akoh et al., 2001; Barcarolo et al., 2003; Chen et al., 2017). It has a high content of vitamin E (125.23mg/100g) (Wang et al., 2006). Therefore, A. truncatum is regarded as a potential species for use in the development of valuable nutritional and medicinal substances.
A. truncatum is also a renewable biomass energy tree species which produces approximately 30 kg of fruit per tree after 20 years and its
seed ratio is up to 66.4% (Wang et al., 2006). Currently, it is receiving much attention from researchers in China due to its great potential value for energy and other
numerous applications. Consequently, the seed oil was approved as a new food resource by the Chinese Ministry of Health in
2011. A. truncatum seed oil (ATO) is usually obtained by cold pressing and commercialized as a crude oil in China (Hu et al., 2017). At the present time, the A. truncatum artificial cultivation area encompasses 4 × 10⁴ ha and should continue to expand rapidly due to this tree’s numerous industrial prospects. However, as most previous studies
have focused on the edible, medicinal, and health care uses of its seed oil, no studies have investigated variations in oil
content or fatty acid composition among natural stands. Moreover, only limited information is available regarding the effects
of environmental factors on seed oil yield and quality.
In this study, we selected 138 accessions from 14 A. truncatum tree populations growing across the known natural distribution area of this species in China. The objectives were to analyze
seed oil variation and investigate the influence of environmental factors on seed oil content and fatty acid composition.
The information obtained from these studies should guide breeding programs, aid in selection of the most adaptable lines for
large-scale cultivation, and ultimately stimulate further development of the ATO industry in China.
2. MATERIALS AND METHODSTOP
2.1. Plant materialTOP
In October and November 2016, 138 accessions of A. truncatum that grow naturally in fourteen regions were collected from nine provinces of China. About 10 separate pest-free adult plants
(each 20 years of age or older) were selected from each sample collection area. In order to minimize other factors affecting
seed development, individual tree species were chosen with spacing to other trees of at least 50 m. For each germplasm, 1-2
kilograms of fully matured samaras were randomly selected from multiple locations on each tree to ensure that the sample represented
each whole plant. Samaras were stored at room temperature. After a period of time, the seeds are stripped from the Samaras
manually. Using GPS to record latitude, longitude and altitude, the meteorological factors were listed using the data from
the local meteorological department (Table 1).
Table 1. Acer truncatum populations with their respective codes and collection site characteristics.
| Code |
Number of accessions |
Collection site |
Latitude (°N) |
Longitude (°E) |
Altitude (m) |
Annual average temperature (ºC) |
Annual rainfall (mm) |
Frost-free season (d) |
| DQTL |
10 |
Daiqintala, Inner Mongolia |
45°13’ |
121°30’ |
324 |
5.6 |
388.0 |
120 |
| CF |
10 |
Chifeng, Inner Mongolia |
42°17’ |
118°59’ |
574 |
7.4 |
460.0 |
130 |
| CC |
10 |
Changcun, Jilin |
43°53’ |
125°19’ |
225 |
4.8 |
580.0 |
150 |
| PQ |
10 |
Pingquan, Hebei |
40°50’ |
118°46’ |
628 |
6.0 |
600.0 |
155 |
| TA |
10 |
Taian, Shandong |
36°12’ |
117°07’ |
305 |
13.2 |
722.6 |
202 |
| LF |
10 |
Linfen, Shanxi |
36°44’ |
111°48’ |
802 |
10.0 |
625.0 |
153 |
| YJ |
10 |
Yongji, Shanxi |
34°50’ |
110°22’ |
316 |
14.1 |
530.0 |
219 |
| HY |
10 |
Huayin, Shaanxi |
34°32’ |
110°05’ |
353 |
12.0 |
600.0 |
200 |
| YS |
10 |
Yongshou, Shaanxi |
34°43’ |
108°03’ |
1005 |
13.2 |
578.6 |
205 |
| FZ |
10 |
Fengzhou, Shaanxi |
33°58’ |
106°39’ |
1020 |
11.4 |
613.2 |
188 |
| ABZ |
10 |
Abazhou, Sichuan |
33°16’ |
103°55’ |
2060 |
12.7 |
552.9 |
225 |
| NX |
10 |
Neixiang, Henan |
33°3’ |
110°51’ |
160 |
15.1 |
855.6 |
227 |
| JY |
10 |
Jiyuan, Henan |
35°9’ |
112°07’ |
602 |
14.6 |
860.0 |
220 |
| NJ |
8 |
Nanjing, Jiangsu |
32°15’ |
119°08’ |
50 |
15.4 |
1106.0 |
237 |
2.2. Oil content and fatty acid composition analysisTOP
A Bruker minispec mq20 pulsed nuclear magnetic resonance instrument (pulsed NMR) was used to estimate the seed oil content
of each material. The specific method used here follows the official standard method (ISO 5511:1992, GB/T 15690-1995, AOAC,
2005).
Oil extraction was performed using a Soxhlet apparatus with ~5 g of ground seeds and petroleum ether (60–90 °C) solvent according
to published methods (Hu et al., 2017). The pure seed oil was transferred to a vial, flushed with nitrogen, and kept at -20 °C until further analysis. The seed
oil was methylated twice, the first step being pre-esterification with H2SO4-CH3OH to reduce the acid value to less than 1 mg KOH/g; the second step was trans-esterification with KOH-CH3OH, according to the published method (ISO 5509:2000, GB/T 17376-2008). The fatty acid methyl ester (FAMEs) profiles obtained
for each accession were determined using an Agilent 7890A (Agilent, Palo Alto, CA, USA) gas chromatograph (GC) equipped with
a flame ionization detector (FID) using 17:0 FAME as an internal standard. The DB-23 capillary column (length 30 m, internal
diameter 0.32 mm, film thickness 0.25 μm) was used for this test. The injector and detector temperatures were 230 °C and 280 °C,
respectively. The oven temperature was maintained at 180 °C for 5 minutes and raised 3 °C·min−1 to 230 °C. The carrier gas (helium) was delivered at a flow rate of 1.0 ml·min−1, and 1 ml of the sample was manually injected in a split injection mode. FAME peaks were identified by comparing the retention
times of known standards which were run under the same conditions. Peak integration was performed using instrument software.
2.3. Statistical analysisTOP
R software was used for correlation analysis, hierarchical cluster analysis (HCA), and principal component analysis (PCA);
Excel 2010 was used for other calculations. Determinations were run in duplicate and the data were reported as mean values.
3. RESULTSTOP
3.1. Oil content and fatty acid compositionTOP
Oil content is an important indicator to measure industrial production. In this work, the oil content of A. truncatum seeds ranged from 17.81%–36.56%, with a mean value of 28.57% for all 138 accessions studied (Table 2). Among the concessions, we selected three with very high oil content (>35%), including YS-6 (36.56%), ABZ-6 (35.71%), and
DQTL-8 (35.44%), which would likely be valuable for the development of new varieties with high oil contents.
Table 2. Variability in oil content and fatty acid composition among populations.
| Populations |
Traits/% |
| C16:0 |
C18:0 |
C18:1 |
C18:2 |
C18:3 |
C20:1 |
C22:1 |
C24:1 |
SFA |
UFA |
MUFA |
PUFA |
Oil content |
| DQTL |
4.38±0.18C |
2.38±0.14CD |
25.64±1.18ABCD |
35.08±0.87AB |
2.62±0.32ABC |
8.06±0.26ABC |
15.14±1.14E |
4.97±0.63E |
8.07±0.24DE |
91.93±0.24AB |
53.96±0.98EFG |
37.97±0.82A |
32.47±2.39A |
| CF |
4.52±0.26BC |
2.30±0.17CDE |
24.06±1.24CD |
35.64±0.66A |
2.96±0.70AB |
7.92±0.22ABC |
15.26±0.48DE |
5.47±0.44CDE |
8.21±0.31DE |
91.79±0.31AB |
52.87±1.11FG |
38.91±1.04A |
28.97±2.19ABCD |
| CC |
4.29±0.30C |
2.29±0.22CDE |
24.70±3.10BCD |
33.44±2.23BC |
2.84±0.47AB |
7.80±0.40BCD |
16.50±0.55ABC |
6.23±0.55ABC |
8.03±0.52E |
91.97±0.52A |
55.42±2.90CDEF |
36.55±2.62ABC |
30.02±2.69ABC |
| PQ |
4.47±0.22BC |
2.37±0.15CD |
22.94±1.25D |
34.44±0.88ABC |
2.90±0.77AB |
7.43±0.20DE |
17.23±0.44AB |
6.29±0.67AB |
8.38±0.41DE |
91.62±0.41AB |
53.99±1.27EFG |
37.64±1.06AB |
30.38±2.28ABC |
| TA |
4.93±0.35AB |
2.21±0.17CDE |
27.91±2.89A |
31.34±1.64DE |
2.37±0.43BC |
8.20±0.34ABC |
15.40±0.74CDE |
5.85±0.66ABCD |
8.48±0.44CDE |
91.52±0.44ABC |
57.55±2.24ABCD |
33.96±2.01DE |
26.71±3.35CDE |
| LF |
4.70±0.34ABC |
2.45±0.34BC |
26.64±1.95ABC |
30.30±1.83E |
2.79±0.56ABC |
8.31±0.38A |
16.90±0.81AB |
6.03±0.43ABC |
8.74±0.67BCD |
91.26±0.67BCD |
57.88±1.91ABC |
33.38±1.95DE |
29.03±4.82ABCD |
| YJ |
4.51±0.34BC |
2.20±0.13CDE |
24.72±2.64BCD |
33.41±2.05BC |
2.87±0.37AB |
7.83±0.47ABCD |
17.04±1.20AB |
5.54±0.59BCDE |
8.29±0.47DE |
91.71±0.47AB |
55.14±2.23DEF |
36.57±2.23ABC |
25.38±5.04DE |
| HY |
4.57±0.19BC |
2.15±0.17DE |
25.63±2.22ABCD |
32.76±1.80CD |
2.40±0.39ABC |
8.11±0.40ABC |
16.77±0.75AB |
5.82±0.45ABCD |
8.21±0.32DE |
91.79±0.32AB |
56.34±2.08ABCDE |
35.45±2.03BCD |
30.37±2.86ABC |
| YS |
4.54±0.17BC |
2.26±0.22CDE |
25.34±1.27ABCD |
33.19±1.31BC |
3.12±0.79A |
8.07±0.25ABC |
16.26±1.01BCD |
5.52±0.69BCDE |
8.23±0.32DE |
91.77±0.32AB |
55.18±1.69DEF |
36.58±1.60ABC |
32.09±2.00A |
| FZ |
4.92±0.20AB |
2.84±0.31A |
23.46±2.02D |
34.16±1.54ABC |
2.55±0.25ABC |
7.72±0.47CDE |
16.97±1.24AB |
4.91±0.57E |
9.47±0.56A |
90.33±0.56E |
53.30±1.75FG |
37.03±1.73ABC |
27.36±1.95BCDE |
| ABZ |
5.06±0.42A |
2.69±0.32AB |
23.30±1.48D |
34.94±0.82AB |
3.10±0.48A |
7.34±0.46E |
16.27±1.04BCD |
5.24±0.66CDE |
9.30±0.45AB |
90.70±0.45DE |
52.35±1.02G |
38.35±0.92A |
31.70±2.79AB |
| NX |
4.90±0.29AB |
1.59±0.19F |
26.32±1.73ABC |
30.61±1.80E |
2.87±0.58AB |
7.75±0.29CDE |
17.50±0.76A |
6.18±0.42ABC |
8.32±0.31DE |
91.68±0.31AB |
57.96±2.30AB |
33.72±2.34DE |
25.39±3.72DE |
| JY |
5.14±0.53A |
2.30±0.19CDE |
24.93±1.38BCD |
31.41±1.24DE |
2.98±0.40AB |
7.92±0.23ABC |
16.72±0.68AB |
6.54±0.35A |
9.05±0.63ABC |
90.95±0.63CD |
56.26±1.28BCDE |
34.69±1.50CDE |
25.09±5.61DE |
| NJ |
4.67±0.84ABC |
2.07±0.19E |
27.43±2.75AB |
30.41±1.87E |
2.12±0.41C |
8.26±0.49AB |
16.95±0.92AB |
6.06±0.72ABC |
8.45±0.87CDE |
91.60±0.87AB |
58.79±2.97A |
32.81±2.25E |
24.06±2.83E |
| Mean |
4.69 |
2.30 |
25.19 |
32.97 |
2.76 |
7.90 |
16.49 |
5.76 |
8.52 |
91.47 |
55.45 |
36.02 |
28.57 |
| Range |
3.78-6.12 |
1.31-3.30 |
20.00-34.31 |
27.08–36.71 |
1.60–4.35 |
6.48–9.15 |
13.64–18.86 |
3.90–7.85 |
7.32–10.31 |
89.60–92.90 |
50.30–63.50 |
28.90–40.57 |
17.81–36.56 |
| CV |
9.12 |
15.15 |
9.58 |
6.95 |
20.58 |
5.59 |
6.70 |
12.62 |
7.51 |
0.73 |
4.83 |
7.09 |
14.72 |
| F |
5.302** |
17.244** |
5.342** |
13.814** |
2.983** |
6.382** |
7.202** |
7.740** |
8.636** |
9.654** |
10.914** |
11.596** |
6.703** |
| Note: **: Significant at p < 0.01. Different capital letters in the same column show significant difference (P < 0.01). Determinations
were run in duplicate and the data are reported as the mean. Range from 138 accessions. Abbreviations of fatty acids with
fig.1 and Abbreviations of populations with table 1. The data for 18:3 is for “total 18:3”, being the sum of GLA +ALA. Other fatty acids include C16:1, C20:0, C20:2, C22:0,
C24:0 and unknown components.
|
With regard to A. truncatum, a total of 14 fatty acid components were detected in this study (Figure 1). The results (Table 2) show that ATO is highly unsaturated (89.60%–92.90%), with an unsaturated to saturated ratio of approximately 10:1. The oil
contains mainly oleic acid (C18:1) (20.00%–34.31%), linoleic acid (C18:2) (27.08%–36.71%), cis-11-eicosenoic acid (C20:1)
(6.48%–9.15%), erucic acid (C22:1) (13.64%–18.86%), nervonic acid (C24:1) (3.90%–7.85%) and linolenic acid (C18:3) (1.60%–4.35%)
which is composed of g-linolenic acid (GLA, 0.20%–1.36%) and α-linolenic acid (ALA, 0.97%–3.51%). The saturated fatty acid
(SFA) content was low (7.32%–10.31%), but may stabilize the fat. SFA consisted predominantly of palmitic acid (C16:0) (3.78%-6.12%)
and stearic acid (C18:0) (1.31%–3.30%). Palmitoleic acid (C16:1), arachidic acid (C20:0), cis-11,14-eicosadienoic acid (C20:2),
behenic acid (C22:0), and tetracosanoic acid (C24:0) were also detected, but were not further characterized due to their small
amounts (<1%), and therefore were labeled as other fatty acids.
|
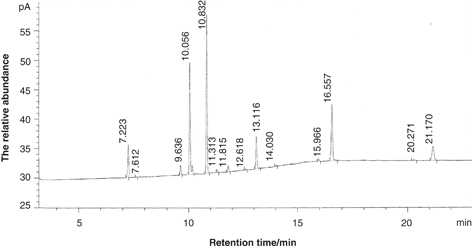 Figure. 1 Total ion chromatograms of fatty acid methyl ester. Figure. 1 Total ion chromatograms of fatty acid methyl ester.
Note: 7.223 - palmitic acid methyl ester (C16:0), 7.612 - Palmitoleic (C16:1), 9.636 - stearic (C18:0), 10.056 - oleic (C18:1) (20-34.31%), 10.832 - linoleic (C18:2), linolenic (C18:3) (including 11.313 - γ-linolenic and 11.815 - α-linolenic), 12.618 - arachidic (C20:0), 13.116 - cis-11-eicosenoic (C20:1), 14.030 - cis-11,14-eicosadienoic (C20:2), 15.966 - behenic (C22:0), 16.557 - erucic (C22:1), 20.271 - tetracosanoic (C24:0), 21.170 - nervonic acid methyl ester (C24:1).
|
|
3.2. Variation of oil content and fatty acid composition among populationsTOP
The oil content varied significantly (p < 0.01) among the 14 analyzed populations (Table 2). The highest seed oil content was exhibited by the DQTL population (32.47%), followed by YS (32.09%), with the lowest content
observed in the NJ population (24.06%). Therefore, based on these results, the populations of DQTL and YS were chosen as germplasm
with high oil contents for screening purposes.
The main fatty acid composition varied significantly (p < 0.01) among the 14 analyzed populations (Table 2). Unsaturated fatty acids (UFA) are classified into monounsaturated fatty acids (MUFA) and polyunsaturated fatty acids (PUFA)
according to the number of fatty acid double bonds. The populations NJ and NX exhibited the highest MUFA levels (> 57.96%),
while populations CF and ABZ exhibiting the lowest MUFA levels (< 52.87%). PUFA percentage tended to be inversely correlated
with MUFA percentage. Meanwhile, populations DQTL and CF exhibited a high (> 35.08%) content of C18:2 and relatively low content
of C18:1, while TA, NJ, LF and NX populations exhibited a high (> 26.32%) C18:1 content and relatively low C18:2 content.
Overall, the sum of percentages of C18:1 and C18:2 was consistently 60%, a previously known relationship prevalent in oil
crops for which oleic acid is a precursor of linoleic acid (Yu et al., 2017; Darwish, 2014). The highest amount of C18:3 was detected in populations YS (3.12%) and ABZ (3.10%). The content of C20:1 ranged from 7.34%
(ABZ) to 8.31% (LF). JY, NX, and PQ samples exhibited the highest amounts of C22:1 (16.72%, 17.50%, and 17.23%, respectively)
and C24:1 (6.54%, 6.18%, and 6.29%, respectively). Therefore, JY, NX, and PQ can be regarded as excellent germplasm resources
which are especially valuable due to their C24:1 contents. The SFA content levels for populations FZ (9.47%), ABZ (9.30%),
and JY (9.05%) were obviously higher than for other populations, as was also observed for C16:0 and C18:0 contents.
In summary, selection of excellent germplasm resources can be used to obtain optimal oil content and composition for various
applications. The findings reported here will be beneficial as a starting point for future breeding efforts toward improving
the yield and quality of ATO.
3.3. Effects of geography and ecological factors on seed oil content and fatty acid compositionTOP
The correlation analysis is shown in Table 3. Oil content showed significant negative correlations with annual average temperature (p < 0.05, −0.629), annual rainfall
(p < 0.01, −0.749), and frost-free season period (p < 0.05, −0.562) and a positive correlation with latitude (0.503) and altitude
(0.469), indicating that northern high altitude populations exhibited higher oil contents within the sampling area (such as
DQTA and YS). Meanwhile, according to the correlation analysis, SFA and UFA showed a tendency toward longitudinal variation,
while C18:2 and C22:1 exhibited latitudinal variation and C16:0 exhibited northeast-to-southwest variation.
Table 3. Correlation coefficients between traits and geography - ecological factors.
| Traits |
Latitude (°N) |
Longitude (°E) |
Altitude (m) |
Annual average temperature (ºC) |
Annual Rainfall (mm) |
Frost-free Season (d) |
| C16:0 |
−0.673** |
−0.613* |
0.427 |
0.666** |
0.462 |
0.617* |
| C18:0 |
0.149 |
−0.235 |
0.688** |
−0.337 |
−0.465 |
−0.304 |
| C18:1 |
−0.232 |
0.213 |
−0.555* |
0.402 |
0.516 |
0.241 |
| C18:2 |
0.535* |
0.058 |
0.406 |
−0.601* |
−0.790** |
−0.510 |
| C18:3 |
0.161 |
−0.286 |
0.526 |
−0.162 |
−0.437 |
−0.123 |
| C20:1 |
−0.039 |
0.242 |
−0.524 |
0.186 |
0.258 |
−0.058 |
| C22:1 |
−0.542* |
−0.351 |
−0.061 |
0.376 |
0.482 |
0.495 |
| C24:1 |
−0.075 |
0.305 |
−0.422 |
0.132 |
0.592* |
0.214 |
| SFA |
−0.514 |
−0.640* |
0.678** |
0.358 |
0.182 |
0.36 |
| UFA |
0.490 |
0.638* |
−0.663** |
−0.326 |
−0.144 |
−0.324 |
| MUFA |
−0.386 |
0.144 |
−0.603* |
0.486 |
0.741** |
0.400 |
| PUFA |
0.520 |
0.008 |
0.461 |
−0.584* |
−0.802** |
−0.494 |
| Oil content |
0.503 |
0.017 |
0.469 |
−0.629* |
−0.749** |
−0.562* |
| Note: *, **: Significant at p < 0.05 and p < 0.01, respectively. Abbreviations of fatty acids with fig.1. The data for 18:3 is for “total 18:3”, being the sum of GLA +ALA. |
Temperature is considered an important factor affecting the composition of fatty acids. It showed a significant negative correlations
with PUFA (p < 0.05, −0.584) and C18:2 (p < 0.05, −0.601), although a significant positive correlations with C16:0 (p<0.01,
0.666). Meanwhile, environmental factors other than temperature also play a role in the fatty acid compositions of oils. Precipitation
exhibited a significant negative correlation with C18:2 (p < 0.01, −0.790), PUFA (p < 0.01, −0.802) and a significant positive
correlation with C24:1 (p < 0.05, 0.592), and MUFA (p < 0.01, 0.741). As a final observation, the frost-free period had the
lowest effect on fatty acid composition, only significantly and negatively correlating with C16:0 (p < 0.05, 0.617).
The correlation study among different biochemical and geographical parameters could be used to understand their interrelations
for future breeding, and for selecting an ideal location for growing high yield or high quality A. truncatum plants. From this study, we determined that an improvement in fat production and in the quality of ATO can be achieved by
planting trees in moderately cold areas, meaning that the northeast and northwest regions of China are the best place to grow.
3.4. Hierarchical cluster analysis and principal component analysisTOP
To evaluate the likely similarities and relationships among different populations, hierarchical cluster analysis (HCA) was
performed based on 13 traits selected for this study (Figure 2A) (Szekely and Rizzo, 2005). This analysis provided the basis for understanding variations in fatty acid composition in combination with geographical
influences. Based on this analysis, 14 populations of A. truncatum were classified into three groups. The first group consisted of the five populations of TA, LF, NX, JY, and NJ, all rich
in MUFA (56.26%–58.79%) and C18:1 (24.93%-27.91%) (Table 2). It should be noted that JY differed from the others in of its exceptionally high level of C16:0 (5.14%). Populations FZ
and ABZ, with higher amounts of SFA (> 9.30%) plus a moderate amount of PUFA, were classified in the second group. The third
group was further divided into two subgroups. The first subgroup consisted of two populations (DQTL and CF) with high PUFA
(> 37.97%) and C18:2 (> 35.08%) compositions, while the CC, PQ, YJ, HY, and YS populations, with higher quantities of UFA
(> 91.62%) than other populations, were assigned to the second subgroup.
|
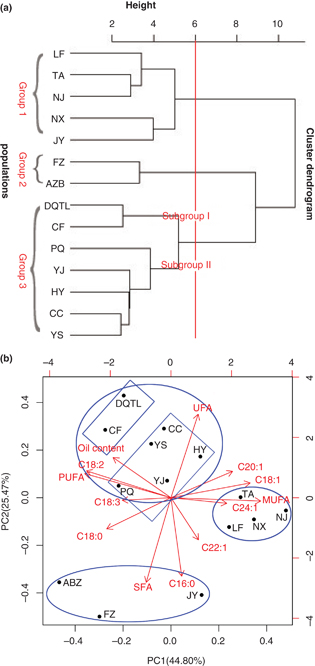 Figure 2. HCA and PCA of 14 populations of A. truncatum. (A) Dendrogram using the Ward clustering method. (B) PCA based on the 13 traits. Figure 2. HCA and PCA of 14 populations of A. truncatum. (A) Dendrogram using the Ward clustering method. (B) PCA based on the 13 traits.
Note: Abbreviations of fatty acids with figure1 and Abbreviations of populations with table 1. The data for 18:3 is for “total 18:3”, being the sum of GLA +ALA.
|
|
In the second stage of analysis, PCA was performed on all populations and all traits were evaluated in order to explore the
interrelationships among and within populations. Most (84.04%) of the variation was explained by the first three principal
components (PC1, PC2, and PC3). The result of PCA revealed that the first and second components explained 70.28% of the total
variation. The first PC (PC1) accounted for 44.80% of the total variation and had a high positive correlation with MUFA (0.410)
and C18:1 (0.362) (Table 4), but a negative correlation with PUFA (-0.394) and C18:2 (-0.386). The PC2 results explained 25.47% of the total variation.
A high negative contribution by SFA (-0.516) and C16:0 (-0.478) and positive contribution by UFA (0.509) were also observed.
Table 4. Principal component analysis of 13 traits in A.truncatum.
| traits |
comp.1 |
comp.2 |
comp.3 |
| C16:0 |
- |
−0.478 |
- |
| C18:0 |
−0.293 |
−0.19 |
0.305 |
| C18:1 |
0.362 |
- |
0.293 |
| C18:2 |
−0.386 |
0.163 |
- |
| C18:3 |
−0.222 |
- |
−0.411 |
| C20:1 |
0.282 |
0.161 |
0.412 |
| C22:1 |
0.126 |
−0.257 |
−0.468 |
| C24:1 |
0.255 |
- |
−0.45 |
| SFA |
−0.113 |
−0.516 |
0.145 |
| UFA |
0.125 |
0.509 |
−0.156 |
| MUFA |
0.410 |
- |
- |
| PUFA |
−0.394 |
0.147 |
- |
| Oil content |
−0.265 |
0.245 |
- |
| standard deviation |
2.4134072 |
1.8196902 |
1.3376747 |
| proportion of variance |
0.4480411 |
0.25471333 |
0.1376441 |
| cumulative proportion |
0.4480411 |
0.7027544 |
0.8403985 |
Note: Abbreviations of fatty acids with fig.1. The data for 18:3 is for “total 18:3”, being the sum of GLA +ALA.
- indicates almost zero. |
Further analysis results shown that the four populations of TA, LF, NX and NJ were positively correlated with MUFA, C18:1,
C20:1 and C22:1. The population of FZ, ABZ and JY was positively correlated with SFA and C16:0. The remaining 7 populations
were positively correlated with oil content, UFA, PUFA and C18:2. Notably, PCA classification confirmed the results of HCA
apart from JY (Figure 2B).
4. DISCUSSIONTOP
Yield is the trait most predictive of whether or not an oil is suitable for large-scale production and adaptability to multiple
industrial uses. Consequently, crops that contain high oil content at harvest ultimately reduce overall final production costs
(Kumar and Sharma, 2011). This mean content (28.57%) value for A. truncatum greatly exceeded values for Glycine max (17%), Olea europaea (20%), and most results for Sapium sebiferum (12–29%) (USDA, 2012; Karmakar et al., 2010), and was comparable to values for Jatropha curcas (20.05%-38.33%) (Kaushik and Bhardwaj, 2013) and wild manihot (17%-31%) (Alvesa et al., 2014). This proves that it is feasible to extract oil from the seed of A. truncatum for industrial purposes.
Seed oil quality and uses are determined mainly by fatty acid composition, with rich variety in fatty acid compositions and
content observed among the various species (and even among varieties). Therefore, fatty acid composition and content can be
used as fingerprints to identify biological oil sources, as well as to test the authenticity of oils (Li et al., 2011). At the species level, a total of 14 distinct fatty acid components were detected in this study, which is similar to that
reported by Hu et al., (2017), and a number similar to that obtained for Xanthoceras sorbifolia by Yu et al., (2017), although their oil content differed from the values reported here. The degree of unsaturation (89.60%–92.90%) of ATO is
higher than peanut oil (83.1%), soybean oil (84.4%), olive oil (86.2%), cotton seed oil (74.1%) and other edible oil (USDA,
2012). C18:2 (27.08%–36.71%) is essential for human metabolism due to the lack of enzymes responsible for its biosynthesis (Hanganu et al., 2012), and it contains a special substance named nervonic acid that is an essential fatty acid which helps maintain brain health
by its participation in biosynthesis and maintenance of nerve cell myelin (Akoh et al., 2001; Barcarolo et al., 2003). Due to its scarcity, C24:1 draws a high purchase price. Therefore, it is of great significance to find alternative plant
sources rich in C24:1. A. truncatum is one of a handful of known species that contains C24:1 in seed oil, including Brassicaceae, Lunaria annua, Borago officinalis, Cannabis sativa, Tropaeolum speciosum, Cardamine graeca, Malania oleifera, and X. sorbifolia (Katavic et al., 2010; Chen et al., 2017; Yu et al., 2017). Therefore, the C24:1 content is an important indicator of ATO value. The content ranged from 3.90% to 7.85%, with a mean
value of 5.76% in this study, which is much higher than the content of the current source of medicinal nervonic acid, X. sorbifolia (1.52%–3.04%) (Yu et al., 2017). And the yield per plant is rich (about 30 kg of fruit after 20 years). So, A. truncatum seeds will become a promising raw material to extract nervonic acid.
Variability is the result of different environmental selection forces that are the root cause of phenotypical differentiation
among populations. In this study, altitude, temperature, and precipitation are the main environmental factors causing variation.
The trend is the same in the study of Dewhurst and King (1998), and Darwish (2014), demonstrating higher oil yields in plants collected from relatively higher altitudes. However, the oleic acid content differed
from that of previous studies in that it is dependent on mean temperature and can decrease by up to 2% with each degree (ºC)
of increase in temperature (Rondanini et al., 2011). However, no significant relationship between mean temperature and oleic acid content in oils was found in this study, but
significant negative correlations were observed between annual average temperature and both PUFA (-0.584) and linoleic acid
(-0.601). It has been demonstrated that low temperatures increase the PUFA content of plants to maintain the fluidity of biological
membranes (Falcone et al., 2004); in a high temperature environment, the increase in SFA could be explained by lipid peroxidation (Arbaoui and Link, 2007). That also explains the observation that palmitic acid exhibits a significantly positive correlation with annual average
temperature (0.666).
Laribi et al., (2009) and Rebey et al., (2011) observed water stress effects on lipid metabolism. In our study, precipitation exhibited a significant negative correlation
with C18:2 (-0.790) and a significant positive correlation with C24:1 (0.592). In addition, researchers have noted that an
increase in altitude has tended to promote greater UFA content (with subsequently lower SFA content), possibly because altitude
increases lead to lower temperatures and higher exposure to light (Dewhurst and King, 1998; Lai et al., 2010). However, this relationship is in contrast to the results of this study, which coincide with Vicia sativa by Mao et al., (2012) who found that other environmental factors besides temperature and light intensity, such as soil and air, may also influence
the lipid metabolism of plants. This will be the direction of our future work.
In addition to environmental factors, genetics need to be considered. Rahimmalek et al., (2017) suggested that the thymol content in Iranian Ajowan (Trachyspermum ammi) can be affected by both genetic and environmental factors. It is necessary to consider the differences within and among
populations when screening promising germplasm resources for oil use, since the biosynthesis of fatty acids can be regulated
by both genetic and environmental factors simultaneously. Thus, further research should be conducted to explore the effects
of environment and genotype in order to guide in the selection of genotypes which exhibit high oil yield and useful fatty
acids.
Results of HCA and PCA showed that within a certain geographic area, populations with similar physiological characteristics
can be clustered into a class which is the same as the result of Rahimmalek et al., (2017) on Iranian Ajowan. Within a class, it was observed that the fatty acid composition of ATO assumed variation patterns which
are characteristic of geographic isolation. Fatty acid profiles could be roughly correlated with growth in three major geographic
areas of China: (I) Eastern central region (TA, LF, NX, JY, and NJ, with high MUFA especially C18:1); (II) Southwest region
(FZ and ABZ, with high SFA); (III) Northeast and northwest regions (DQTL, CF, CC, PQ, YJ, HY, and YS, with high UFA, especially
PUFA and C18:2). These findings also indicate that it is feasible to purchase seeds in the region which could guide future
development of ATO for industrial production.
5. CONCLUSIONSTOP
A. truncatum is a woody oil tree species with high seed oil content (28.57%), high unsaturated fatty acid content (91.47%), and high nervonic
acid content (5.76%) ompared to grain and other seed oil sources. Notably, the data presented in this study show patterns
of variability in oil content and fatty acid composition which correlate with geographic location: northern high altitude
populations exhibited higher oil content; populations in the eastern central region exhibited high levels of MUFA (especially
C18:1); populations from the southwest region were rich in SFA; populations from the northeast and northwest regions had high
UFA content (especially PUFA, and C18:2).
Seed oil content and fatty acid composition were found to be influenced by ecological factors, especially altitude, temperature,
and precipitation. The results suggest that both fat production and quality of ATO may be improved by planting trees in moderately
cold areas. Consequently, further studies will incorporate such results to guide in the selection of excellent individual
trees which have high specificity (such as high oil, high C24:1) to improve oil yield and quality. The populations of DQTL
and YS were chosen as germplasm resources with high oil content, while JY, NX, and PQ were regarded as excellent germplasm
resources with high C24:1. This work should lay the groundwork for improving oil yield and quality and should ensure ATO’s
future success as an important industrial crop.
ACKNOWLEDGMENTSTOP
This work was supported by Central Fiscal Forestry Science and Technology Extension Demonstration Fund Project (No: 2016LZGC014),
a Major Agricultural Project of Shandong Province (No: [2012] 213 and [2014] 96) and Shandong “Double Tops” Program. We are
grateful to the Institute of Oil Crops of the Chinese Academy of Agricultural Sciences for providing technical support in
the tests.
REFERENCESTOP
| ○ |
Akoh CC, Moussata CO. 2001. Characterization and oxidative stability of enzymatically produced fish and canola oil-based structured
lipid. J. Am. Oil Chem. Soc. 7, 25–30. https://doi.org/10.1007/s11746-001-0214-2 |
| ○ |
Arbaoui M, Link W. 2007. Effect of hardening on frost tolerance and fatty acid composition of leaves and stems of a set of
faba bean (Vicia faba L.) genotypes. Euphytica 162, 211–219. https://doi.org/10.1007/s10681-007-9521-4 |
| ○ |
Alvesa AAC, Manthey L, Isbell T, Ellis D, Jenderek MM. 2014. Diversity in oil content and fatty acid profile in seeds of wild
cassava germplasm. Ind. Crops Prod. 60, 310–315. https://doi.org/10.1016/j.indcrop.2014.06.025 |
| ○ |
Barcarolo R, Bau A, Moreno JB, Dimitrova B, Anklam E. 2003. On-line LC–GC method for determination of isomers of nervonic
acid in meat-derived food. J. Sep. Sci. 26, 1347–1352. https://doi.org/10.1002/jssc.200301487 |
| ○ |
Chen FL, Zhang Q, Fei SM, Gu HY, Yang L. 2017. Optimization of ultrasonic circulating extraction of samara oil from Acer saccharum using combination of Plackett–Burman design and Box–Behnken design. Ultrason Sonochem. 35, 161–175. https://doi.org/10.1016/j.ultsonch.2016.09.015 |
| ○ |
Darwish MSA. 2014. Essential oil variation and trace metals content in garden sage (Salvia officinalis L.) grown at different environmental conditions. J. Agric. Sci. 6, 209. https://doi.org/10.5539/jas.v6n3p209 |
| ○ |
Dewhurst RJ, King PJ. 1998. Effects of extended wilting, shading and chemical additives on the fatty acids in laboratory grass
silages. Grass Forag. Sci. 53.
|
| ○ |
Falcone DL, Ogas JP, Somerville CR. 2004. Regulation of membrane fatty acid composition by temperature in mutants of Arabidopsis
with alterations in membrane lipid composition. Plant Biol. 4, 17. https://doi.org/10.1186/1471-2229-4-17 |
| ○ |
Guo X, Wang R, Chang R, Liang X, Wang C, Luo Y, Yuan Y, Guo W. 2014. Effects of nitrogen addition on growth and photosynthetic
characteristics of Acer truncatum seedlings. Dendrobiology 72, 151–161. https://doi.org/10.12657/denbio.072.013 |
| ○ |
Hanganu A, Todaşcă MC, Chira NA, Maganu M, Roşca S. 2012. The compositional characterisation of Romanian grape seed oils using
spectroscopic methods. Food Chem. 134, 2453–2458. https://doi.org/10.1016/j.foodchem.2012.04.048 |
| ○ |
Hu P, Xu XB, Yu LL. 2017. Physicochemical Properties of Acer truncatum Seed Oil Extracted Using Supercritical Carbon Dioxide. J. Am. Oil Chem. Soc. 94, 779–786. https://doi.org/10.1007/s11746-017-2983-1 |
| ○ |
Karmakar A, Karmakar S, Mukherjee S. 2010. Properties of various plants and animals feedstocks for biodiesel production. Bioresour. Technol. 10, 7201–7210. https://doi.org/10.1016/j.biortech.2010.04.079 |
| ○ |
Katavic V, Mietkiewska E, Taylor DC, Guo YM, Brost JM. 2010. Lunaria annua, cardamine graeca and teesdalia nudicaulis fae Genes and their Use in Producing Nervonic and Eicosenoic Acids in Seed Oils. Patent Application Publication. no.US 2010/0122377.
|
| ○ |
Kaushik N, Bhardwaj D. 2013. Screening of Jatropha curcas germplasm for oil content and fatty acid composition. Biomass Bioenergy 58, 201–218. https://doi.org/10.1016/j.biombioe.2013.10.010 |
| ○ |
Kumar A, Sharma S. 2011. Potential non-edible oil resources as biodiesel feedstocks: an Indian perspective. Renew Sust. Energy Rev. 15, 1791–1800. https://doi.org/10.1016/j.rser.2010.11.020 |
| ○ |
Lai L, Zheng Y, Bai H, Yu Y, An P, Li X, Rimmington GM, Shimizu H. 2010. Strong light inhibits germination of Artemisia sphaerocephala and A. ordosica at low temperature and its relevance to revegetation in sandy lands of Inner Mongolia. China. Ecol. Res. 25, 771–780. https://doi.org/10.1007/s11284-010-0706-2 |
| ○ |
Laribi B, Bettaieb I, Kouki K, Sahli A, Mougou A, Marzouk B. 2009. Water deficit effects on caraway (Carum carvi L.) growth, essential oil and fatty acid composition. Ind. Crop Prod. 30, 372–379. https://doi.org/10.1016/j.indcrop.2009.07.005 |
| ○ |
Li CM, Yao YP, Zhao GZ, Cheng W, Liu HL, Liu CY, Shi Z, Chen Y, Wang S. 2011. Comparison and analysis of fatty acids, sterols,
and tocopherols in eight vegetable oils. J. Agric. Food Chem. 59, 12493–12498. https://doi.org/10.1021/jf203760k |
| ○ |
Li L, Manning WJ, Tong L, Wang XK. 2015. Chronic drought stress reduced but not protected Shantung maple (Acer truncatum Bunge) from adverse effects of ozone (O3) on growth and physiology in the suburb of Beijing, China. Environ. Pollut. 201, 34–41. https://doi.org/10.1016/j.envpol.2015.02.023 |
| ○ |
Ma X, Wu L, Ito Y, Tian W. 2005. Application of preparative high-speed counter-current chromatography for separation of methyl
gallate from Acer truncatum Bunge. J. Chromatogr. A. 1076, 212–215. https://doi.org/10.1016/j.jchromb.2008.01.047 |
| ○ |
Mao ZX, Fu H, Nan ZB, Wang J, Wan CG. 2012. Fatty acid content of common vetch (Vicia sativa L.) in different regions of Northwest China. Biochem. Syst. Ecol. 44, 347–351. https://doi.org/10.1016/j.bse.2012.06.021 |
| ○ |
Rahimmalek M, Heidari EF, Ehtemam MH, Mohammadib S. 2017. Essential oil variation in Iranian Ajowan (Trachyspermum ammi (L.) Sprague) populations collected from different geographical regions in relation to climatic factors. Ind. Crop. Prod. 95, 591–598. https://doi.org/10.1016/j.indcrop.2016.11.017 |
| ○ |
Rebey IB, Knioua S, Hamrouni I, Limam F, Marzouk B. 2011. Water-deficit impact on fatty acid and essential oil composition
and antioxidant activities of cumin (Cuminum cyminum L.) aerial parts. J. Agric. Food Chem. 59, 328–334. https://doi.org/10.1021/jf1037618 |
| ○ |
Rondanini DP, Castro DN, Searles PS, Rousseaux MC. 2011. Fatty acid profiles of varietal virgin olive oils (Olea europaea L.) from mature orchards in warm arid valleys of Northwestern Argentina (La Rioja). Grasas Aceites. 62, 399–409. https://doi.org/10.3989/gya.125110 |
| ○ |
Sun JY, Wang XK, Smith MA. 2018. Identification of n-6 monounsaturated fatty acids in Acer seed oils. J. Am. Oil Chem. Soc. 95, 21–27. https://doi.org/10.1002/aocs.12020 |
| ○ |
Szekely GJ, Rizzo ML. 2005. Hierarchical clustering via Joint Between-Within Distances: Extending Ward’s Minimum Variance
Method. J. Classif. 22, 151–183. https://doi.org/10.1007/s00357-005-0012-9 |
| ○ |
USDA, Agricultural Research Service, 2012. USDA National Nutrient Database for Standard Reference, Release 25. Nutrient Data
Laboratory, Home Page, http://www.ars.usda.gov/ |
| ○ |
Wang XY, Fan JS, Wang SY, Sun RC. 2006. A new resource of nervonic acid from purpleblow maple (Acer truncatum) seed oil. Forest Prod. J. 56, 147–150.
|
| ○ |
Yu HY, Fan SQ, Bi QX, Wang SX, Hu XY, Chen MY, Wang LB. 2017. Seed morphology, oil content and fatty acid composition variability
assessment in yellow horn (Xanthoceras sorbifolium Bunge) germplasm for optimum biodiesel production. Ind. Crop Prod. 97, 425–430. https://doi.org/10.1016/j.indcrop.2016.12.054 |
| ○ |
Zhao WH, Gao CC, Ma XF, Bai XY, Zhang YX. 2007. The isolation of 1,2,3,4,6-penta-O-galloyl-beta-d-glucose from Acer truncatum Bunge by high-speed counter-current chromatography. J. Chromatogr. B. 850, 523–527. https://doi.org/10.1016/j.jchromb.2006.11.002 |