From NIR spectra to singular wavelengths for the estimation of the oil and water contents in olive fruits
N. Hernández-Sáncheza,* and M. Gómez-del-Campob
aPhysical Properties Laboratory and Advanced Technologies in Agrifood (LPF-TAGRALIA), ETSIAAB, Universidad Politécnica de Madrid,
Av. Puerta de Hierro, 2 - 4, 28040 Madrid, Spain
bCEIGRAM, ETSIAAB, Universidad Politécnica de Madrid, Av. Puerta de Hierro, 2 - 4, 28040 Madrid, Spain
*Corresponding author: n.hernandez@upm.es
| |
SUMMARY
Knowledge about the oil and water contents in olive fruits is required to determine orchard management, harvest time, and
the oil extraction process. The simplification of procedures and of equipment based on NIR Spectroscopy is of major interest.
Estimation models for oil and water contents on a fresh matter basis were developed by partial least square regression with
NIR spectral data (700 wavelengths). For raw absorbance data the r2 for the test set reached 0.9 and 0.92 for oil and water contents; and RPIQt was 4.9 and 4.3, respectively. The identification
of a useful relation of the relative absorbance at 1724 nm and 1760 nm to the oil content allowed for restricting the wavelengths
to three. For oil content the r2 showed 0.88 with ad RPIQt of 4.4. For water content the r2 value was 0.84 and the RPIQt was 3.1. Estimation performance with only three wavelengths was comparable to that obtained with PLSR with 700 variables.
|
| |
RESUMEN
Espectros NIR y longitudes de onda específicas para la estimación del contenido de aceite y agua en aceitunas. El contenido de aceite y agua en aceitunas es requerido para gestionar el manejo del cultivo, el momento de cosecha y el
proceso de extracción de aceite. La simplificación de los procedimientos y de los equipos basados en espectroscopia NIR es
de gran interés. Se desarrollaron modelos de estimación para el contenido de aceite y agua sobre peso fresco por regresión
de mínimos cuadrados parciales con datos espectrales NIR (700 longitudes de onda). Para los datos de absorbancia crudos, el
r2 para el conjunto de validación externa alcanzó 0.9 y 0.92 para el contenido de aceite y agua; y RPIQt fue 4,9 y 4,3 respectivamente.
La identificación de una relación útil de la absorbancia relativa a 1724 nm y 1760 nm con el contenido de aceite, permitió
restringir las longitudes de onda a tres. Para el contenido de aceite, el r2 alcanzó 0,88 y RPIQt fue 4,4. Para el contenido de agua, el valor de r2 fue de 0,84 y el RPIQt fue de 3,1. La calidad de la estimación con solo tres longitudes de onda fue comparable al obtenido
con PLSR en 700 variables.
|
1. INTRODUCTION TOP
The determination of the oil and water contents in olive fruits is of major interest for the oil sector. The official determination
of oil content is currently made by the Soxhlet analytical method, which is time-consuming and requires previous sample preparation
along with the use of dissolvent products. Nuclear magnetic resonance (NMR) can also be used to determine oil content although
the fruits should be previously dehydrated. García Sánchez et al., (2005) studied the feasibility of the NMR technique in milled and dehydrated olive fruits. Fruit water content determination also
requires sample dehydration. Near Infrared Spectroscopy (NIRS) has been revealed as a successful technique which uses intact
olive fruits as an alternative to such methods (Cayuela et al., 2009; Cayuela and Pérez-Camino 2010; Gracia and León 2011; León-Moreno 2012; Salguero-Chaparro et al., 2013; Salguero-Chaparro and Peña-Rodríguez, 2014).
Easy measurements of oil and water contents in olive fruits are required by growers and the industry. The implementation of
NIR Spectroscopy combined with multivariate calibration methods to develop estimation models significantly simplify the determination
procedures and provide an instantaneous method for the determination of such parameters with minimal sample preparation.
Such methodology will be a useful tool for decisions concerning orchard management. Irrigation increases olive and oil production
but at the same time fruit water content increases and consequently the oil quality is modified. It has been shown that high
irrigation reduces oil phenol content and oxidative stability (Gómez-del Campo and García, 2013). During fruit development, oil is accumulated in the olive pulp and the pattern of oil accumulation depends on many factors
such as cultivar, climatic conditions and orchard management. An easy and fast oil and water measurement for fresh olive fruits
will allow for monitoring the evolution of such parameters and for determining the best harvesting moment for high oil production
(Morrone et al., 2018) in each of the different plots of the orchard (Herrera-Cáceres et al., 2017). From an industrial point of view, information about the oil and water contents in the fruit is required for optimal oil
extraction procedures, such as the time and temperature of malaxation (Tapanni et al., 2017) or the decanter feeding pump (Guerrilli et al., 2017).
According to Beer’s law, the use of NIR spectra is based on the linear relationship between the absorbance at certain wavelengths
and the concentration of the compound producing such absorbance. However, the NIR spectra can be significantly affected by
shifts in baseline and non-linearities mainly as a result of light scattering derived from the comparable size of the wavelengths
within the NIR range and particle size in biological samples (Rinnan et al., 2009a). Many physical and chemical phenomena also produce deviations from the law, such as differences in effective path length,
changes in sample sizes, molecular interactions, changes in refractive index, etc. (Rinnan et al., 2009b).
The spectral pre-processing techniques focussed on reducing deviations from Beer’s law are a major issue to enhance the performance
of calibration models in industrial applications. Such techniques contribute to an improvement in model robustness, as discussed
by Zeaiter et al., (2004 and 2005).
Pre-processing techniques can be divided into two different categories. The first group comprises the normalization methods,
as indicated by Zeaiter et al., (2005), also categorized as scatter-corrective methods by Rinnan et al., (2009a), which correct the shifts and the trends in baseline and curvilinearity, and multiplicative interference, mainly due to scattering.
This group includes standard normal variate (SNV) transformation, robust normal variate transformation, the de-trend (DT)
method, multiplicative scatter correction (MSC), inverse MSC, extended MSC, and extended inverse MSC.
The second group accounts for smoothing to reduce noise and the differentiation (or spectral derivatives) to correct peak
overlap and constant or linear baseline drift. This group includes the Savitzky and Golay (SavGol) algorithm used for smoothing,
the first derivative to remove the additive constant background effects and the second derivative which removes the baseline
linear slope variations and additive effects.
Cayuela et al., (2009) and Cayuela and Pérez-Camino (2010) applied spectral pre-treatments such as MSC, SNV and SavGol derivatives to the NIR spectra of intact olive fruits. Models
were obtained with the full spectrum ranging from 1100 nm to 2300 nm. Partial least squares regression (PLSR) models predicted
oil content related to both fresh weight and to dry matter, with correlation coefficients (r) between actual and predicted values ranging from 0.78 to 0.89. Nine and ten latent variables (LV) were selected in corresponding
models, with values for the residual predictive deviation (RPD) ranging from 2.77 to 3.18. For fruit moisture Cayuela et al., (2009) obtained a model that achieved a calibration coefficient (RC) of 0.943 and cross-validation coefficient (RCV) of 0.895; and Cayuela and Pérez-Camino (2010) obtained a model with eight latent variables that achieved an RC of 0.792 and RCV of 0.759, with RPD of 2.51. Also for intact olive fruits, Gracia and León (2011) and León-Moreno (2012) acquired spectra in the wavelength region of 1100 to 2300 nm at 1 nm intervals (1201 wavelengths). Prediction models were
obtained by portable NIR spectroscopy with nine latent variables and an r ranging from 0.89 to 0.94, with RPD from 2.63 to 2.88. In such work spectral pre-treatments did not improve model performance.
Salguero-Chaparro et al., (2013) obtained spectral information in the wavelength range between 950 and 1690 nm, at a resolution of 2 nm (371 wavelengths).
Moisture and fat contents were determined in intact olive fruits under on-line conditions. The pre-processing treatments MSC
and SNV-DT were applied. The highest coefficients of determination (R2) were obtained with the latter. For moisture R2 = 0.87, RPD = 2.76 and 7 latent variables; for oil content, R2 = 0.79, RPD = 2.37 and 8 latent variables. Salguero-Chaparro and Peña-Rodríguez (2014) obtained on-line spectra from 380 to 1690 nm, every 2 nm (656 wavelengths); and off-line spectra from 400 to 2500 nm, every
2 nm (1051 wavelengths). These authors applied SNV transformation followed by DT and first derivative SG in their study focused
on the comparison between the on-line and off-line NIRS analysis of intact olives. The PLSR provided coefficients of determination
of prediction (r2) for fat content ranging from 0.82 to 0.86, and RPD from 2.08 to 2.51. For moisture content, the least squares support vector
machine algorithm (LS-SVM) gave the best results with r2 = 0.91 and RPD = 3.05. Fernández-Espinosa (2016) measured NIR spectra in the wavelength region from 1000 to 2300 nm at 1 nm resolution (1301 wavelengths). The author obtained
prediction performance of R2 0.88 for water content and R2 = 0.76 for fat content after the application of SavGol smoothing for the second derivative, which meant good prediction potential
of the models.
Trapani et al., (2017) used a NIR spectrometer based on a discrete filter system for the measurement of the moisture, oil and sugar contents of
olive fruits. NIR spectra were recorded from 1400 to 2400 nm at 19 selected wavelengths. In PLS models the r2 in calibration ranged between 0.90 and 0.93.
A substantial reduction in the number of wavelengths used, which would provide more robust models, is a possible solution,
and is studied in the present work.
The RPD has been commonly used to compare the performance across different regression models by scaling the standard error
of prediction (SEP) with any statistical index which represents the spread of the population, usually the standard deviation
(SD). This ratio removes the effects of the range of the property to be estimated. Bellon-Maurel et al., (2010) proposed the use of the interquartile distance (IQ25-75 = Q75 – Q25) as an alternative to the SD when assumptions about normal distributions were not fulfilled. Such a ratio is called the “ratio
of performance to interquartile range” (RPIQ) and was used throughout this work.
The analysis of NIR spectral data usually involves the management of hundreds of variables corresponding to the wavelengths
studied, which are indeed highly correlated. In addition, the need for spectral pre-processing prior to the development of
regression models increases computational requirements. The present work is a study on the feasibility of estimating oil and
water contents by more simple computational methods which focus on a few wavelengths instead of the whole spectrum. The identification
of the wavelengths of interest was performed by the method proposed by Roger et al., (2011) for variable selection called CovSel (Covariance Selection). CovSel aims at classifying the most useful variables of X (data
matrix) in the decreasing order of interest. The most useful variable is selected at each step. Covsel presents the advantage
of maximizing the covariance between X and Y (matrix of properties to be estimated) rather than the correlation. For two variables
with the same correlation with Y, the one with the highest covariance is chosen. Then the data are orthogonally projected
onto this selected variable which removes the information that is correlated to it. As neighboring variables in NIR spectra
are highly correlated, this projection drastically decreases the variance of the variables adjacent to the selected one. Thus,
the identification of the next variable in the following step will not take into account such adjacent variables. The consequence
is that the variables showing high variance play a prominent role in the regression model. CovSel also deals with Y containing
multiple responses and carries out the variable selection on the basis of their global covariance with all the properties
to be predicted.
Roger et al., (2011) successfully implemented CovSel to data analysis, regression and discrimination. For the regression case, NIR spectra from
corn samples were analyzed. The moisture, oil, protein and starch contents of the samples were taken as the Y multi-response.
CovSel was applied to the calibration set and least square linear regressions were then calculated, using the variables in
the order previously obtained. The optimal models for each response included 11, 12 and 13 wavelengths. The application of
the models to the validation set achieved R2 values of 0.997, 0.903, 0.908, and 0.877 for each response, respectively.
The present work aims at evaluating the feasibility of the estimation of oil content (% fresh matter and % dry matter) and
water content (% fresh matter) from intact olive fruits with simplified procedures using a reduced number of singular wavelengths
in the devoted models.
For assuring robustness in the development of estimation models, it is a major requirement that most of the expected sample
variability is taken into account. In the present work, the main criterion for achieving maximum variability in oil and water
content and spectral data was based on the different photosynthetic capacities derived from differences in the quantity of
intercepted radiation by the foliar surface according to position in the tree and to hedgerow orientation. Such differences
involve a variation in flowering, fruit number, fruit size, ripening, synthesis and accumulation of oil in the fruit (Gómez-del-Campo et al., 2009; Connor et al., 2009). In order to enhance the variability, another main source was included, such as geographical location of orchards.
This study is focused on identifying specific wavelengths and wavelength ratios which are useful as an alternative to the
traditional use of a huge amount of spectral data in NIR applications in olive fruits, and could contribute to the future
development of multi-wavelength devices which are applicable in the oil industry.
2. MATERIALS AND METHODSTOP
2.1. SamplesTOP
Olive fruit samples with different oil contents of the cv. Arbequina were harvested in different layers of three different
orchards in Spain, near Puebla de Montalban, Toledo (39°N) and Pedro Abad, Córdoba (38ºN), Écija, Sevilla (37ºN). In the first
olive orchard hedgerows were planted E–W and spaced 4 x 2 m (1250 trees/ha). The hedgerow was 2 m high and 1 m wide. In the
second orchard, the hedgerows were E-W oriented with spacing of 4 x 1.35 m (1922 trees/ha), hedgerow height was 1.5 m, with
1 m width. The third orchard was N-S oriented and spaced at 4 x 1.35 m; hedgerow height was 1.3 m, and the width was 1 m (1922
trees/ha).
In each orchard, the canopy was divided into several horizontal stratums with 40 and 60 cm width according to canopy development,
with height above 280 and 220 cm, respectively (Figure 1). One kilogram of olive fruits was harvested manually from each stratum.
|
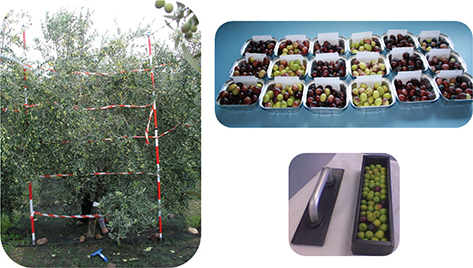 Figure 1. Left: Layer delimitation in olive hedgerow for sample harvesting. Upper-right: Variability in fruit skin color of olives according to different maturity stages. Bottom-right: Sample holder filled with one sample of fresh olives containing 100 fruits. Figure 1. Left: Layer delimitation in olive hedgerow for sample harvesting. Upper-right: Variability in fruit skin color of olives according to different maturity stages. Bottom-right: Sample holder filled with one sample of fresh olives containing 100 fruits.
|
|
The whole set comprised a total of 95 samples, corresponding to 95 different stratums. Each sample contained about one hundred
fruits. Samples were randomly split into two sets: a calibration set with 80 samples for model development, and a test set
with 15 samples for external validation.
In summary, the olive fruits used for the development of the estimation model came from different orchards, different heights
and different orientations in order to enhance variability in maturity stages, and consequently, in oil and water contents,
and variability in the spectral data. Table 1 summarizes the statistics for both sets.
Table 1. Summary of the statistics for oil content (% fresh matter) and water content (% fresh matter) of the calibration and test sets.
| STATISTICS |
Oil content (% fresh matter) Whole set split into: |
Water content (% fresh matter) Whole set split into: |
| Calibration set N = 80 |
Test set N = 15 |
Calibration set N = 77 |
Test set N = 15 |
| Minimum |
11.08 |
12.36 |
47.74 |
50.55 |
| Maximum |
25.46 |
23.37 |
66.21 |
63.97 |
| Range |
14.38 |
11.01 |
18.47 |
13.42 |
| Interquartile distance |
4.28 |
4.58 |
5.20 |
4.08 |
| Mean |
17.45 |
17.75 |
58.09 |
58.34 |
| Median |
16.81 |
17.37 |
57.92 |
58.39 |
| STD |
3.18 |
3.09 |
4.01 |
3.26 |
2.2. Water and oil content determinationTOP
Fresh samples of intact olive fruits were weighed before and after drying for 48 h in a forced-air oven at 105 °C to determine
moisture content. Olive moisture was gravimetrically determined and expressed as percentage of fresh weight (AENOR, 1973).
The oil content was measured from dried olive fruits using an NMR Minispec NMS100 (Bruker Optik GmbH) since the suitability
of this analytical technique in terms of accuracy and precision has been proven through comparison to the official method
based on Soxhlet extraction (García Sánchez et al., 2005). Values were expressed as percentage of fresh weight.
2.3. NIR measurementsTOP
NIR measurements of the olive fruits were taken using a FOSS NIRSystems 5000 in the 1100-2500 nm range at 2 nm resolution
(total of 700 wavelengths) in reflectance mode, and then transformed to absorbance values as log (1/R).
In order to eliminate the influence of temperature, all samples were stabilized at room temperature prior to spectra acquisition.
For each sample, about one hundred olive fruits were placed in the sample holder (Figure 1). Olive fruits within each canopy layer were expected to present natural differences in chemical composition and visibly
showed heterogeneity in shape and size (Figure 1). Thus, NIR spectra were acquired from two replicate samples of olive fruits. Then the spectral data were averaged so as
to obtain a more representative NIR spectrum of the layer.
2.4. NIR model developmentTOP
The identification of outliers was carried out using univariate and multivariate approaches for analytical (oil and water
content) and spectral data, respectively. The univariate approach was intended to identify data outliers among the oil content
determinations by NMR analyses. Although univariate outliers are usually a result of an experimental error, they could also
be a result of a phenotypical variability. In the present work, box-plots were used with lines at the lower quartile, middle,
and upper quartile values. The whiskers had a length equal to 1.5 times the interquartile range (Dytham, 2010) and those data beyond the ends of the whiskers were considered outliers.
PCA was performed on raw spectra. Hotelling’s T2 was computed in order to reveal unusual variation inside the PCA model, that is, to detect variations in the PC scores which
are higher than statistically expected when the dispersion in each PC is taken into account. Then, PLSR was performed and
those samples that either provided a prediction error higher than three times the bias corrected SEP or presented Hotelling’s
T2 value higher than the corresponding limit (95% confidence interval) were discarded.
The univariate analysis of oil and water content data, spectral pre-processing, PLSR and CovSel were performed using MATLAB
Release 2016a, The MathWorks, Inc.
Estimation models with the whole spectra. Different spectral pre-processing techniques were evaluated, including no pre-treatment of the data. The most common techniques
were applied, such as MSC, SavGol smoothing and derivation algorithm with a window of 21 wavelengths, third-degree polynomial
and first derivative (SavGol21_3_1); SavGol with a window of 21 wavelengths, third-degree polynomial and second derivative (SavGol21_3_2), SNV, and DT. In order to combine the reduction of both multiplicative and additive effects due to scattering, SavGol21_3_2 with SNV; and DT with SNV were also applied.
PLS regressions were developed in order to generate different estimation models of oil content (% fresh matter) and water
content (% fresh matter) with the calibration sets of fresh olive fruits. The selection of the number of latent variables
was carried out according to the evolution of the standard error of calibration (SEC) and the standard error of cross-validation
(SECV). The spectra of the test set as well as the corresponding oil and water contents were scaled with respect to the respective
means of the calibration set.
The performance across the different regression models was compared using the R2, r2, SEC, SEP and RPIQ. Assumptions on normal distributions are not considered in the present work.
Estimation models with singular wavelengths. Preliminary identification of potential singular wavelengths was made by computing the interquartile distance Q25-75 of each wavelength in the NIR spectra without pre-treatment. Wavelengths showing high dispersion were compared to those showing
high b-coefficients (absolute value) in the corresponding PLSR model. In addition, the evolution of the peak’s height in relation
to increasing oil content was monitored in order to find potentially useful relationships.
Wavelength selection was carried out according to the methodology explained by Roger et al., (2011). Three approaches were defined: a) selection of independent wavelengths for each response; b) selection of wavelengths on
the basis of their global covariance with several responses; c) selection of wavelength indexes for common use.
For the first approach, CovSel was run on the NIR spectra without pre-treatment (X matrix) and the oil content vectors (wet
basis) and the water content (wet basis) vector independently, with a limit of 15 steps. This yielded a selection of 15 ordered
wavelengths for each response. Then, variables were introduced stepwise in classic mono-response least square models. Up to
15 models were built with an increasing number of variables in the order previously obtained (from one variable up to 15).
A leave-one-out cross-validation produced a curve of SEC and a curve of SECV that lead to the choice of the final model.
For the second approach, CovSel was run on the X matrix and the Y matrix containing all the responses (oil and water content),
with a limit of 15 steps. This yielded a selection of 15 ordered wavelengths as well. CovSel was run a second time for each
parameter independently to produce three sortings of the 15 selected variables. A series of 15 least square regression models
were then calculated, one series for each response. The optimal models were then chosen by studying the evolution of the SECV.
For the third approach, indexes were computed as combinations of relative peak heights. CovSel was applied to identify the
indexes with the best capacity for estimating oil content on a fresh weight basis (% fresh matter). The selected indexes were
used to generate models to estimate water content (% fresh matter). In doing so, the wavelengths required would be restricted
to a low optimal number.
All the selected models were applied to the validation set. Performance indicators were R2, SEP, and RPIQ.
3. RESULTS AND DISCUSSION TOP
The near-infrared absorbance spectra showed the typical absorbance bands reviewed by Shenk et al., (2001) and by Aparicio and Hardwood (2000). Figure 2a provides an illustrative example of a spectrum from a fresh olive fruit. For band comparison, examples of a spectrum from
Arbequina extra virgin olive oil and from water are also provided (Figure 2b and c). The near infrared region consists primarily of first, second, and third overtones from 700 to 1900 nm (Osborne et al., 1993). From 1900 to 2500 nm, the absorption information primarily consists of combination bands of one or more overtone bands.
Some of the most important CH2 bands from second overtones in oil were found as four paired peaks around 1720, 1760, 2300, and 2350 nm; peaks at around
1200 nm and 1400 were also found (Figure 2a, b, y c). Strong OH bands for water were found from its first overtone at around 1440, and from a first band combination at about
1930 nm (Figure 2a and c). Figure 2a shows the noticeable accordance between the peaks comprising the spectra from olive fruits and those comprising the spectra
from water and olive oil. Such a pattern was consistent for the whole set of raw absorbance spectra from the fresh olives
analyzed in the present work (Figure 3a), which are dominated by the broad bands corresponding to water.
|
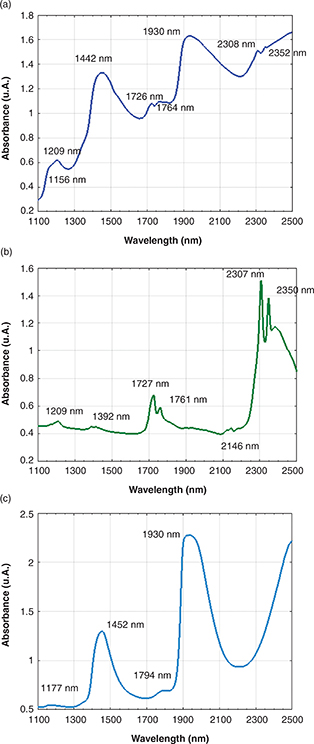 Figure 2. Examples of absorbance NIR spectra: a) fresh olive fruit; b) Arbequina extra virgin olive oil; c) water. Figure 2. Examples of absorbance NIR spectra: a) fresh olive fruit; b) Arbequina extra virgin olive oil; c) water.
|
|
|
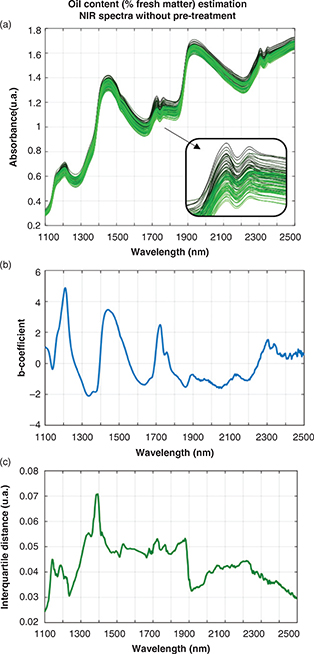 Figure 3. PLSR analysis for estimation of oil content (% fresh matter) from NIR spectra without pre-treatment: a) Absorbance NIR spectra of the calibration set; b) b-coefficients of the PLSR model with 6 latent variables; c) interquartile distance Q25-75. Figure 3. PLSR analysis for estimation of oil content (% fresh matter) from NIR spectra without pre-treatment: a) Absorbance NIR spectra of the calibration set; b) b-coefficients of the PLSR model with 6 latent variables; c) interquartile distance Q25-75.
|
|
As illustrated in Figure 3a, the effect of scattering was also remarkable, along with the additive and multiplicative effects, and curved baselines.
Spectra are colored and range from light green to dark green, roughly encompassing the increase in oil content, mainly at
the regions related to oil absorbance bands. Color degradation highlights a trend in the dispersion of the spectra as samples
with increasing oil content tend to show higher absorbance values throughout the range of wavelengths. A noticeable pattern
within the wavelength region ranging from 1700 to 1800 nm is illustrated in detail in Figure 3a. Such a region is associated with oil absorbance bands, and contains a doublet with a local maximum at around 1724 and 1760
nm. For low-oil content samples (lighter green), the absorbance at 1724 nm was lower than the absorbance at 1760 nm. As oil
content increased (darker green) the absorbance at 1724 nm became higher than that at 1760 nm. This evolution was exploited,
as shown below.
For chemical and spectral data, the identification of the outliers was carried out by univariate and multivariate approaches,
respectively. The univariate approach did not identify any outliers among the oil and water contents. The multivariate approach
did not identify any outlier among the spectra. However, according to the prediction errors (results not shown), three outliers
were found in the calibration set for water content estimation with the PLSR model. The outliers were deleted prior to the
development of the definitive corresponding models.
Table 1 summarizes the statistics for calibration and validation final sets, which showed similar values. The broad range characterizes
each property to be estimated, and mean and median were comparable values. According to this, calibration and validation sets
were balanced in number of samples and were representative of the expected variability.
3.1. Estimation models with the whole spectraTOP
PLSR models were developed using the 700 wavelengths of the NIR spectra. The selection of latent variables was carried out
according to the performance achieved during the internal validation through the cross-validation method. An increasing number
of latent variables assured higher R2 and lower SEC; and usually those values reached stabilization. However, with increasing model complexity the overfitting
was induced, as revealed by the divergence of SEC and SECV. The number of LV was selected according to the beginning of this
divergence (results not shown).
The parameters which characterize the performance of the different PLSR models are summarized in Table 2. For oil content (% fresh matter) the use of raw spectra, i.e. without applying any pre-treatment, provided an excellent
performance for the calibration set. The percentages of variance captured by the model with six latent variables were 99.63%
for the spectra and 92.75% for the oil content. Performance decreased for the external validation as r2 was 0.85, although the RPIQt value of 3.9 was a satisfactory result.
Table 2. Summary of performance results from the PLSR models for the prediction of oil content (% fresh matter) and water content (% fresh matter) obtained after different pre-processing techniques on NIR spectra (1100 nm to 2500 nm) from fresh olive fruits.
| Pre-processing techniques |
Latent variables |
Oil content (% fresh matter) |
Latent variables |
Water content (% fresh matter) |
| Calibration set (N = 80) |
Test set (N = 15) |
Calibration set (N = 77) |
Test set (N = 15) |
| R2 |
SEC |
RPIQc |
r2 |
SEP |
RPIQt |
R2 |
SEC |
RPIQc |
r2 |
SEP |
RPIQt |
| No pre-treatment |
6 |
0.93 |
0.85 |
5.0 |
0.85 |
1.16 |
3.9 |
7 |
0.95 |
0.93 |
5.6 |
0.9 |
1.13 |
3.6 |
| DT |
2 |
0.85 |
1.21 |
3.5 |
0.83 |
1.22 |
3.8 |
8 |
0.96 |
0.83 |
6.3 |
0.95 |
0.73 |
5.6 |
| MSC |
7 |
0.94 |
0.75 |
5.7 |
0.9 |
0.98 |
4.7 |
4 |
0.94 |
0.97 |
5.4 |
0.92 |
0.97 |
4.2 |
| SNV |
7 |
0.94 |
0.75 |
5.7 |
0.9 |
0.98 |
4.7 |
4 |
0.94 |
0.97 |
5.4 |
0.92 |
0.97 |
4.2 |
| SavGol21_3_1 |
6 |
0.95 |
0.72 |
5.9 |
0.93 |
0.83 |
5.5 |
5 |
0.94 |
0.98 |
5.3 |
0.95 |
0.75 |
5.4 |
| SavGol21_3_2 |
3 |
0.85 |
1.21 |
3.5 |
0.85 |
1.17 |
3.9 |
6 |
0.96 |
0.82 |
6.3 |
0.96 |
0.72 |
5.7 |
| SavGol21_3_2 + SNV
|
5 |
0.92 |
0.91 |
4.7 |
0.95 |
0.67 |
6.8 |
4 |
0.94 |
1.02 |
5.1 |
0.95 |
0.79 |
5.2 |
| DT + SNV |
7 |
0.96 |
0.67 |
6.4 |
0.93 |
0.81 |
5.7 |
7 |
0.95 |
0.85 |
6.1 |
0.97 |
0.57 |
7.2 |
Figure 3b shows the b-coefficients of the corresponding model. The regions related to both components, oil and water, presented a local
maximum with comparable values. The structure of the olive tissue and the distribution of the oil content and the water content
within such cells and tissues, as well as their relative proportions, were expected to affect the spectral response. Water
is the most important component of fresh olive fruit (values between 48-66 % fresh matter) and oil is the second component
(11-25 % fresh matter), and those fruits with higher oil content present less water in them (Gómez-del-Campo et al., 2009). Hence, the absorbance of water would reveal information on the oil content.
The classic pre-treatments provided dissimilar estimation capacity among them (Table 2), even showing performances comparable to raw data. The pre-treatments aimed at reducing multiplicative effects such as MSC
and SNV showed higher r2 and RPIQt values than the pre-treatments aimed at reducing additive effects such as DT and SavGol21_3_2; whereas SavGol21_3_1 and the combined pre-treatments SavGol21_3_2 + SNV and DT + SNV showed the highest r2 and RPDt values. The number of latent variables ranged from 2 to 7; r2 ranged from 0.83 to 0.95; and RPIQt ranged from 3.9 to 6.8.
The estimation of the water content (% fresh matter) from the raw data provided excellent results for the test set, with r2 of 0.9 and RPIQt of 3.6. The application of all the pre-treatments increased the predictive capacity with r2 ranging from 0.92 to 0.97 and RPIQt ranging from 4.2 to 5.7, which mean an excellent predictive capacity. The best results were found for the combination of
DT + SNV. Latent variables ranged from 4 to 8. Performance indicators were consistently higher than those of oil content estimation.
This is in accordance with previous works referred to in the Introduction section such as Salguero-Chaparro et al., (2013). The reason could be attributed to the preponderance of the absorbance peaks related to water.
These variable results obtained when applying spectral pre-treatments and the fact that they did not always show better capacity
than the raw data, suggest that the dispersion of the absorbance that contains useful information on oil content could have
been partially removed. Moreover, encouraging results have been obtained by PLSR models from the non-pre-treated spectra.
As in classic NIR spectroscopy applications, the previous analysis used a spectral data matrix comprising a large number of
variables, i.e. 700. Despite the PLSR models providing a simple vector with the b-coefficients of the regression to be used
for estimation, the need for managing hundreds of variables remained. Therefore, a subsequent study was focused on identifying
a limited number of wavelengths or combination of wavelengths which provided acceptable estimation capacity. Under a practical
point of view, the analysis was carried out on raw spectral data.
3.2. Estimation models with singular wavelengthsTOP
A preliminary identification of potential singular wavelengths was carried out by computing the interquartile distance for
each wavelength in the NIR spectra without pre-treatment (Figure 3c). In contrast to fluid-like samples, the microstructure heterogeneity of solid-like samples such as olive fruits enhances
the dispersion of the absorbance values due to scattering. However, the spectral features that are related to the oil content
were expected to show stronger deviation.
As expected, those wavelengths showing a local maximum in Figure 3c were in accordance with the main peaks in the spectrum of the olive oil illustrated in Figure 2a, as expected. The highest dispersion was found for 1392 nm, which could be derived from the curved baseline. Similarities
were also found with the wavelengths showing high b-coefficients (absolute value) in the corresponding PLSR model (Figure 3b). The interquartile distance depicted in Figure 3c illustrated the higher dispersion at 1724 nm in comparison to 1760 nm, which could be an indicator of a different behavior
related to variations in oil content. This result supported the evolution of the relative peak heights shown in Figure 3a for this doublet. Therefore, this peak height ratio was revealed as potentially useful for oil content estimation.
In order to consistently identify the proper wavelengths, the method of variable selection CovSel, developed by Roger et al., (2011), was applied to the matrix of absorbance spectra without any pre-treatment.
Firstly, the selection of wavelengths was carried out independently for each property. According to Roger et al., (2011) in the iterative process of variable selection there is a compromise between the X variance, the Y variance and their correlation.
When X variables are dependent, and a relation between X and Y exists, the evolution of the variances explained by Covsel
(expressed in percentage of the whole variances of X and Y) presents a rapid increase at the beginning of the process which
corresponds to the selection of the most important variables. At increasing iterative steps, the increase in the explained
variances slows down. This behavior is observed for the oil in Figure 4a, and for water content (results not shown). It is worth noting that the first selected variable accounted for 62% of the
X variance and the 72% of the Y variance. The selection process included up to 15 variables, with explained variance of X
evolving up to 100%. The number of variables finally selected was set according to the divergence of the SEC and SECV and
the evolution of R2 computed in the linear least square models, which were built by introducing the variables in a stepwise mode. Six wavelengths
finally entered the model for the estimation of oil content 6 (Figure 4b). For water content 5 wavelengths were selected.
|
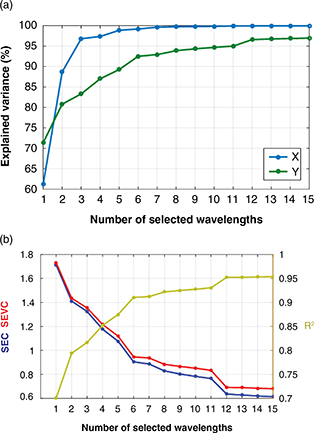 Figure 4. Procedure of variable selection for oil content (% fresh matter) according to the number of selected wavelengths introduced in the linear square regression model: a) Evolution of the explained variance X: NIR raw spectra matrix; Y: oil content (% fresh matter) matrix; b) Evolution of the standard error of prediction (SEP), standard error of cross-validation (SECV) and coefficient of determination (R2). Figure 4. Procedure of variable selection for oil content (% fresh matter) according to the number of selected wavelengths introduced in the linear square regression model: a) Evolution of the explained variance X: NIR raw spectra matrix; Y: oil content (% fresh matter) matrix; b) Evolution of the standard error of prediction (SEP), standard error of cross-validation (SECV) and coefficient of determination (R2).
|
|
Table 3 summarizes the selected wavelengths and the parameters that characterize the performance for the different models. Three
wavelengths were common to both properties: 1390, 1630 and 1724 nm. The last one was constantly selected in the first step.
Excellent performance was obtained for the external validation, with r2 of 0.9 and RPIQt of 4.8 for oil content (% fresh matter); and r2 of 0.92 and RPIQt of 4.3 for water content (% fresh matter).
Table 3. Summary of the selected wavelengths by CovSel for the different estimation models and parameters that characterize the performance of the models. Ordering in columns corresponds to order of selection.
| Specific Wavelength Selection |
| |
Num. wavelengths |
Wavelengths |
Calibration set (Noil = 80) (Nwater = 77) |
Test set (N = 15) |
| R2 |
SEC |
RPIQc |
r2 |
SEP |
RPIQt |
| Oil content (% fresh matter) |
6 |
1724 |
0.91 |
0.95 |
4.5 |
0.9 |
0.94 |
4.9 |
| 1390 |
| 1940 |
| 1206 |
| 1630 |
| 1464 |
| Water content (% fresh matter) |
5 |
1724 |
0.91 |
1.17 |
4.4 |
0.92 |
0.95 |
4.3 |
| 1390 |
| 1940 |
| 1630 |
| 1434 |
| |
|
Common Indexes |
|
|
|
|
|
|
| Oil content (% fresh matter) |
3 |
A1724/(A1760/A1724) |
0.88 |
1.1 |
3.9 |
0.88 |
1.04 |
4.4 |
| Water content (% fresh matter) |
|
(A1760/A1724) A1206/(A1760/A1724) |
0.88 |
1.37 |
3.8 |
0.84 |
1.3 |
3.1 |
These estimation capabilities for oil and water content on a fresh weight basis were higher than those obtained by the PLSR
model with 700 wavelengths combined in 6 latent variables, which is an encouraging result.
In Figure 5 the selected wavelengths which are specific for the estimation of oil content (% fresh matter) are identified by vertical
lines superimposed onto the average spectrum. 99.92% of the X variance and 92.5% of the Y variance are captured by these six
wavelengths. The most important information was provided by the dispersion at 1724 nm, related to oil absorbance. Secondly,
the dispersion at 1390 nm, where a change in slope appeared in the peak related to water which could be ascribed to the peak
observed in the oil sample (Figure 2b). The third variable, 1940 nm, was also related to water. Then, information on oil absorbance at 1206 nm was selected. Finally,
1630 nm and 1464 nm were selected. Most of the selected wavelengths were the same (or slightly shifted) as the local maximum
of the b-coefficients computed by PLSR.
|
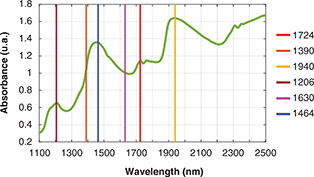 Figure 5. Wavelengths selected by the specific CovSel procedure for oil content estimation identified by vertical lines superimposed onto the average spectrum from NIR spectra with no pre-treatment. Ordering in label corresponds to the order of selection. Figure 5. Wavelengths selected by the specific CovSel procedure for oil content estimation identified by vertical lines superimposed onto the average spectrum from NIR spectra with no pre-treatment. Ordering in label corresponds to the order of selection.
|
|
When CovSel was applied to multi-response regression, the selected variables included those of the specific selection, and
a similar hierarchy was obtained providing comparable results (not shown).
The third approach was focused on the selection of common wavelength indexes which are useful for estimating both responses.
In view of the spectral pattern observed with increasing oil content in the doublet within the region ranging from 1700 to
1800 nm, and in view of the regular selection of absorbance at 1724 nm, several indexes were computed as the combination of
the absorbance at different wavelengths.
The two main indexes were: absorbance at 1764 nm divided by absorbance at 1724 nm (I1 = A1760/A1724); and A1724 minus A1760 (I2 = A1724 - A1760). Secondary indexes were computed by dividing the absorbance at each selected wavelength by I1. Values of I1 were greater than the unit for samples with low oil content; and decreased towards values lower than the unit for samples
with increasing oil content as peak height at 1724 evolved to values higher than peak height at 1760 nm (Figure 6a). Thus, for samples with lower oil content secondary indexes comprised a low numerator and a denominator higher than the
unit, which yielded a much lower value. In contrast, for samples with higher oil content secondary indexes comprised a high
numerator and a denominator lower than the unit, which yielded a much higher value. According to this, secondary indexes would
potentially spread the dispersion at each wavelength, which could enhance the covariance with the responses and thus, improve
the estimation capability. Figure 6b illustrates the effect of the computation of the index A1724/I1. In Figure 6b for low oil content, the blue dots (values of A1724) are above their corresponding red dots (index). For intermediate content, blue and red dots are closer; and for higher oil
content the blue dots appear below the red dots. The slope increased from 0.0114 to 0.0135; and the values of R2 increased from 0.71 to 0.79. Analogous behavior is observed for the index A1206/I1 in Figure 6c. The slope increased from 0.006 to 0.0073; and the values of R2 increased from 0.48 to 0.63.
|
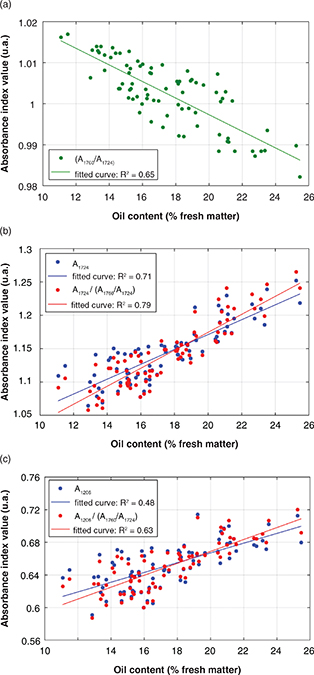 Figure 6. Oil content (% fresh matter) versus absorbance values (u.a.): a) The green series corresponds to index 1 values, I1 = A1760/A1724; b) The blue series corresponds to a raw absorbance value at 1724 nm (A1724); the red series corresponds to values computed as A1724/(A1760/A1724); b) The blue series corresponds to a raw absorbance value at 1206 nm (A1206); the red series corresponds to values computed as A1206/(A1760/A1724). Figure 6. Oil content (% fresh matter) versus absorbance values (u.a.): a) The green series corresponds to index 1 values, I1 = A1760/A1724; b) The blue series corresponds to a raw absorbance value at 1724 nm (A1724); the red series corresponds to values computed as A1724/(A1760/A1724); b) The blue series corresponds to a raw absorbance value at 1206 nm (A1206); the red series corresponds to values computed as A1206/(A1760/A1724).
|
|
The selection of the best indexes for the estimation of oil and water content (% fresh matter) was carried out by following
the previously described procedure. Three indexes were selected, which included absorbance at three wavelengths, i.e. 1206
nm, 1724 nm, and 1760 nm. For the test set r2 achieved 0.88 and RPIQt was 4.4. Then, the same indexes were used to estimate water content (% fresh matter). This solution provided a compromise
between the estimation performance and the use of a minimum number of singular wavelengths. The r2 value was 0.84 and the RPIQt was 3.1. These values were comparable to those obtained with PLSR, although in this case only three wavelengths were required
(Figure 7).
|
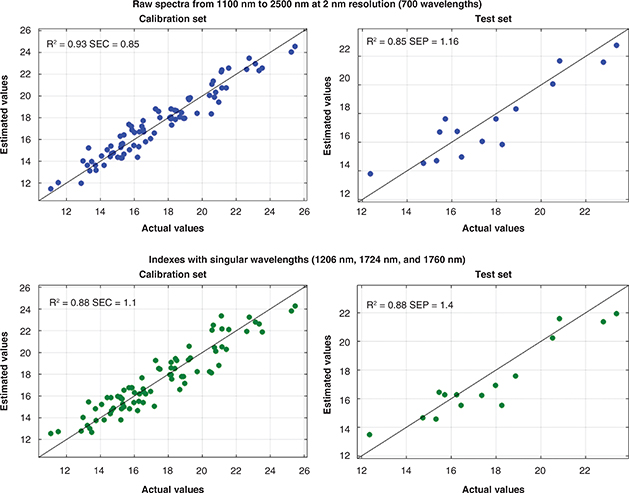 Figure 7. Scatterplot of estimated oil content (% fresh matter) against actual values: model with the whole raw spectra (upper row) and model with indexes computed from selected wavelengths (bottom row). Figure 7. Scatterplot of estimated oil content (% fresh matter) against actual values: model with the whole raw spectra (upper row) and model with indexes computed from selected wavelengths (bottom row).
|
|
4. CONCLUSIONSTOP
The NIR spectra from fresh olive fruits were affected by shifts in baseline and non-linearities mainly as a result of light
scattering, which induced additive and multiplicative effects. In the present work, classic spectral pre-treatments were applied
to diminish such effects prior to the development of PLSR models. However, they do not always guarantee successful results.
Some pre-treatments yielded poorer estimation capabilities for oil content (% fresh matter) than that provided from the raw
spectra (lower r2 and lower RPIQt). Therefore, part of the dispersion containing useful information was reduced by the pre-treatment. Despite the scattering
effects manifested throughout the raw spectra, several wavelengths showed a wider dispersion which was related to oil and
water content. Thus, raw data are reliable for obtaining estimation models.
Acceptable performances were obtained when using raw spectral data from 1100 nm to 2500 nm at 2 nm resolution (total of 700
wavelengths). The estimation of oil content in external validation achieved an r2 value of 0.85 and RPIQt value of 3.9. As for water content r2 was 0.9 and RPIQt was 3.6. The estimation of the water content consistently showed better results when compared to oil estimation.
For both parameters, oil and water content, the estimation models included absorbance bands assigned to both compounds. Such
a result suggests that their proportion in fresh tissue affects the proportion of their corresponding spectral responses.
Thus, useful information for the quantification of each parameter is reciprocally contained in their corresponding absorbance
bands.
The spectral data bases that are typically used for the estimation of parameters from the NIR spectra of olive fruits contain
a huge number of variables. Moreover, PLSR models include several LV which are combinations of the whole range of variables.
The amount of data managed can be significantly simplified by the application of a specialized selection of variables, without
a reduction in estimation capacity. The CovSel method was applied in the present work which involved a reduction from 700
variables to 6 and to 5 variables for oil content and water content, respectively. Such variables were hierarchically selected
according to their covariance with such contents. Estimation performance overcame that obtained with PLSR models without variable
selection. For the test set the r2 reached values of 0.9 and 0.92 for oil and water content, respectively.
Required wavelengths can be restricted to an even lower practical number. The evolution of the relative peak heights found
for absorbance at 1724 nm and at 1760 nm can be exploited. The indexes were computed as ratios of their absorbance. The indexes
spread the dispersion at each wavelength, which enhanced the covariance with the responses and thus, improved the estimation
capability. Three indexes were selected, which included 1206 nm, 1724 nm, and 1760 nm. For oil content r2 reached a value of 0.88 and RPIQt was 4.4. For water content the r2 value was 0.84 and the RPIQt was 3.1. Estimation performance can be comparable to that obtained with PLSR with 700 variables. It is noticeable that in
this case only three wavelengths were required.
These are encouraging results since straightforward and robust methodologies for fruit inspection are pursued by the olive
industry. The identification and evaluation of a reduced number of singular wavelengths is a step towards the development
of multi-wavelength devices, such as cameras, which could be used in field, industrial and laboratory environments.
ACKNOWLEDGMENTSTOP
Authors gratefully acknowledge Jacinto Cabetas from El Carpio de Tajo (Toledo), Antonio Capitán from Écija (Sevilla), Casas
de Hualdo from Puebla de Montalbán (Toledo) and Todolivo from Pedro Abad (Córdoba) for access to olive orchards where this
research was conducted.
We thank Beatriz Somoza-Rodríguez for assistance in NIR spectra data collection. In addition, the authors gratefully acknowledge
Jean Michel Roger from Irstea, UMR ITAP, (France) for his valuable expertise advice and lecturing on Chemometrics.
This work was partially supported by AGL2013-49047-C2-1-R and AGL2016-77282-C3-2-R. The authors gratefully acknowledge the
Comunidad de Madrid (S2013/ABI-2747, TAVS-CM, Spain) and European Structural Funds for financial support. LPF-TAGRALIA is
part of the CEI Moncloa Campus of Excellence, UPM-UCM (Spain).
REFERENCESTOP
| ○ |
Aenor, Asociación Española de Normalización y Certificación. 1973. Materias Grasas. Humedad y materias volátiles. Norma UNE
55-020-73, Madrid, España.
|
| ○ |
Aparicio R, Harwood J. 2000. Manual del aceite de oliva. Ediciones Paraninfo S.A. Madrid: Mundi-Prensa.
|
| ○ |
Bellon-Maurel V, Fernandez-Ahumada E., Palagos B, Roger JM, McBratney AB. 2010. Critical review of chemometric indicators
commonly used for assessing the quality of the prediction of soil attributes by NIR spectroscopy. TrAC Trend. Anal. Chem. 29, 1073–1081. https://doi.org/10.1016/j.trac.2010.05.006 |
| ○ |
Cayuela JA, Pérez-Camino MC. 2010. Prediction of quality of intact olives by near infrared spectroscopy. Eur. J. Lipid Sci. Technol. 112, 1209–1217. https://doi.org/10.1002/ejlt.201000372 |
| ○ |
Cayuela JA, García JM, Caliani N. 2009. NIR prediction of fruit moisture, free acidity and oil content in intact olives. Grasas Aceites 60, 194–202. https://doi.org/10.3989/gya.097308 |
| ○ |
Connor DJ, Centeno A, Gómez-del-Campo M. 2009. Yield determination in olive hedgerow orchards. II. Analysis of radiation and
fruiting profiles. Crop Pasture Sci. 60, 443–452. https://doi.org/10.1071/CP08253 |
| ○ |
Dytham C. 2010. Choosing and Using Statistics: A Biologist’s Guide. Third Edition. Wiley-Blackwell.
|
| ○ |
Fernández-Espinosa AJ. 2016. Combining PLS regression with portable NIR spectroscopy to on-line monitor quality parameters
in intact olives for determining optimal harvesting time. Talanta 148, 216–228. https://doi.org/10.1016/j.talanta.2015.10.084 |
| ○ |
García Sánchez A, Ramos Martos N, Ballesteros E. 2005. Estudio comparativo de distintas técnicas analíticas (espectroscopía
de NIR y RMN y extracción mediante Soxhlet) para la determinación del contenido graso y de humedad en aceitunas y orujo de
Jaén. Grasas Aceites 56, 220–227.
|
| ○ |
Gómez-del-Campo M, Centeno A, Connor DJ. 2009. Yield determination in olive hedgerow orchards. I. Yield and profiles of yield
components in north–south and east–west oriented hedgerows. Crop Pasture Sci. 60, 434–442. https://doi.org/10.1071/cp08252 |
| ○ |
Gomez-del-Campo M, García JM. 2013. Summer deficit-irrigation strategies in a hedgerow olive cv. Arbequina orchard: effect
on oil quality. J. Agric. Food Chem. 61, 8899–8905. https://doi.org/10.1021/jf402107t |
| ○ |
Gracia A, León L. 2011. Non-destructive assessment of olive fruit ripening by portable near infrared spectroscopy. Grasas Aceites 62, 268–274. https://doi.org/10.3989/gya.089610 |
| ○ |
Guerrini L, Masella P, Angeloni G, Migliorini M, Parenti A. 2017. Changes in olive paste composition during decanter feeding
and effects on oil yield: Effect of decanter feeding on olive oil yield. Eur. J. Lipid Sci. Technol. 119. https://doi.org/10.1002/ejlt.201700223 |
| ○ |
Gurdeniz G & Ozen B. 2009. Detection of adulteration of extra-virgin olive oil by chemometric analysis of mid-infrared spectral
data. Food Chem. 116, 519–525. https://doi.org/10.1016/j.foodchem.2009.02.068 |
| ○ |
Herrera-Cáceres C, Pérez-Galarce F, Álvarez-Miranda E, Candia-Véjara A. 2017. Optimization of the harvest planning in the
olive oil production: A case study in Chile. Comput. Electron. Agric. 141, 147–159. https://doi.org/10.1016/j.compag.2017.07.017 |
| ○ |
León-Moreno L. 2012. Usefulness of portable near infrared spectroscopy in olive breeding programs. Span. F. Agric. Res. 10, 141–148. https://doi.org/10.5424/sjar/2012101-184-11 |
| ○ |
León L, Rall, L, Garrido A. 2003. Análisis de aceituna intacta mediante espectroscopia en el infrarrojo cercano (NIRS): una
herramienta de utilidad en programas de mejora de olivo. Grasas Aceites 54, 41–47.
|
| ○ |
Morrone L, Neri L, Cantini C, Alfei B, Rotondi A. 2018. Study of the combined effects of ripeness and production area on Bosana
oil’s quality. Food Chem. 245, 1098–1104. https://doi.org/10.1016/j.foodchem.2017.11.061 |
| ○ |
Osborne BG, Fearn T, Hindle PT. 1993. Practical NIR spectroscopy with applications in food and beverage analysis. Second Edition. Addison-Wesley Longman Ltd: Harlow UK.
|
| ○ |
Rinnan A, Berg F, Engelsen SB. 2009a. Review of the most common pre-processing techniques for near-infrared spectra. Trends Anal. Chem. 28. https://doi.org/10.1016/j.trac.2009.07.007 |
| ○ |
Rinnan A, Nørgaard L, Frans van den Berg F, Thygesen J, Bro R. and Engelsen SB. 2009b. Data Pre-processing in Infrared Spectroscopy for Food Quality Analysis and Control, Edited by Da-Wen Sun, ISBN: 978-0-12-374136-3.
|
| ○ |
Roger JM, Palagos B, Bertrand D, Fernandez-Ahumada E. 2011. CovSel: Variable selection for highly multivariate and multi-response
calibration. Application to IR spectroscopy. Chemometr. Intell. Lab. Syst. 106, 216–223. https://doi.org/10.1016/j.chemolab.2010.10.003 |
| ○ |
Salguero-Chaparro L and Peña-Rodríguez F. 2014. On-line versus off-line NIRS analysis of intact olives. LWT - Food Sci. Technol. 56, 363–369. https://doi.org/10.1016/j.lwt.2013.11.032 |
| ○ |
Salguero-Chaparro L, Baeten V, Fernández-Pierna JA, Peña-Rodríguez, F. 2013. Near infrared spectroscopy (NIRS) for on-line
determination of quality parameters in intact olives. Food Chem. 139, 1121–1126. https://doi.org/10.1016/j.foodchem.2013.01.002 |
| ○ |
Shenk JS, Workman JJ & Westerhaus MO. 2001. Application of NIR spectroscopy to agricultural products, in: Burns, D.A. & Ciurczak, E.W. (Eds.) 3 Handbook of near-infrared analysis. Marcel Dekker, Inc., New York, 419–474.
|
| ○ |
Sun D-W. 2009. Infrared Spectroscopy, for food quality analysis and control. (1st ed.). UK: Academic Press, (Chapter 1).
|
| ○ |
Trapani S, Migliorini M, Cecchi L, Valentina G, Roberto B, Valentina C, Giovanna F, Bruno Z. 2017. Feasibility of filter-based
NIR spectroscopy for the routine measurement of olive oil fruit ripening indices. Eur. J. Lipid Sci. Technol. 119. https://doi.org/10.1002/ejlt.201600239 |
| ○ |
Trapani S, Guerrini L, Masella P, Parenti A, Canuti V, Picchi M, Caruso G, Gucci R, Zanonia B. 2017. A kinetic approach to
predict the potential effect of malaxation time-temperature conditions on extra virgin olive oil extraction yield. J. Food. Eng. 195, 182–190. https://doi.org/10.1016/j.jfoodeng.2016.09.032 |
| ○ |
Zeaiter M, Roger JM, Bellon-Maurel V. 2005. Robustness of models developed by multivariate calibration. Part II: The influence
of pre-processing methods. Trends Anal. Chem. 24, 437–445. https://doi.org/10.1016/j.trac.2004.11.023 |
| ○ |
Zeaiter M, Roger JM, Bellon-Maurel V, Rutledge DN. 2004. Robustness of models developed by multivariate calibration. Part
I: The assessment of robustness. Trends Anal. Chem. 23, 157–170. https://doi.org/10.1016/S0165-9936(04)00307-3 |