Effect of drying on the chemical composition of Çakıldak (cv) hazelnuts during storage
A. Turan*
Giresun University, Technical Sciences Vocational School, Hazelnut Expertise Programme, 28100, Giresun, Turkey
*Corresponding author: ali.turan@giresun.edu.tr; alituran61@gmail.com
| |
SUMMARY
The hazelnut (Corylus avellana L.) is one of the most popular tree nuts in the world. The proper selection of drying methods is necessary to prevent oil oxidation which will influence the overall nut quality during storage. The aim of this study was to determine the effects of sun drying (SD) and artificial dryingied (AD) on the chemical traits of hazelnuts during long–term storage. Protein, lipid and moisture contents, water activity, fatty acid composition, sum of fatty acids, and oil oxidation properties were determined over 24 months’ storage (2015–2017) at 20–25 °C and 70–90% relative humidity. The results showed that monounsaturated fatty acids (MUFA) was the main fatty acid group (81.55–83.38%) followed by polyunsaturated (PUFA; 10.39–11.57%) and saturated fatty acids (SFA; 5.75–6.60%). The samples dried by AD had more SFA (5.86%) and MUFA (83.11%) than the SD samples. At the end of storage, the lowest free fatty acid, and peroxide value (0.52%–1.45 meqO2·kg−1, respectively), and the highest oleic/linoleic acidity ratio (7.76) were found from AD. Therefore, AD appears to be more promising for hazelnut drying.
|
| |
RESUMEN
Efecto del secado durante el almacenamiento sobre la composición química de avellanas Çakıldak (cv). La avellana (Corylus avellana L.) es una de las nueces de árbol más populares del mundo. Una elección adecuada de los métodos de secado es necesario para evitar la oxidación del aceite, lo que influirá en la calidad general de la nuez durante el almacenamiento. En este estudio se determinan los efectos de secado al sol (SD) y secado artificial (AD) sobre los parámetros químicos de la avellana durante el almacenamiento a largo plazo. El contenido de proteínas, lípidos y humedad, actividad del agua, composición de ácidos grasos y propiedades oxidativas del aceite se determinaron a lo largo de 24 meses de almacenamiento (2015-2017) a 20-25 °C y 70-90% de humedad relativa. Los resultados mostraron que los ácidos grasos monoinsaturados (MUFA) fue el principal grupo de ácidos grasos (81,55-83,38%) seguido de los ácidos grasos poliinsaturados (AGPI, 10,39-11,57%) y ácidos grasos saturados (AFS: 5,75-6,60%). Las muestras secadas en AD tenían más SFA (5.86%) y MUFA (83.11%) que aquellas muestras SD. Al final del almacenamiento, la acidez libre y el índice de peróxido más bajo (0,52% -1,45 meqO2·kg-1, respectivamente), junto con la mayor relación de ácido oleico/linoleico (7,76) se encontraron en AD. Por lo tanto, AD parece ser más propicio para el secado de avellanas.
|
1. INTRODUCTIONTOP
The hazelnut is one of the most popular nuts in the international market. Turkey is the main producer and exporter of hazelnuts in the world. Proper harvesting and post-harvest processing are the main factors in achieving the maximum yield of good quality hazelnuts that determine marketability and profit (Qu et al., 2016). Rapid post-harvest processing, especially in husking and drying, is important for the quality of final product, and hazelnut drying plays an essential role.
During the drying process, hazelnut kernels can experience various reactions that give rise to the loss in nutritional value, microbial growth and chemical reaction (Fu et al., 2016). In addition, hazelnuts are more susceptible to deterioration from hydrolytic or oxidase enzymes and oil oxidation, causing rancidity during the drying process (Wang et al., 2018). In this aspect, drying becomes crucial to prevent the growth of micro flora and to preserve the nut. Unfortunately, in
Turkey, compared to other food products, studies on the drying of hazelnuts are very limited.
Traditionally, hazelnut drying is performed by sun drying and may be subject to mould growth, and like other nuts, subsequent aflatoxin formation due to prolonged drying under humid or rainy conditions (Turan, 2017). In addition, it is well known that many factors, such as prolonged storage under air and/or at relatively high temperature and humidity have negative effects on various nut quality parameters (Turan and İslam, 2018).
In response to the changes in light and heat, lipid molecules are released to form free fatty acids, which can affect the stability of nut oil (Fu et al., 2016; Turan, 2018). Therefore, it is important to maintain oil stability during the hazelnut–drying process. Moreover, the rapid post-harvest processing of hazelnuts, particularly drying, is an important parameter in terms of the quality of the final product during the storage phase. In summary, to ensure their long shelf–life and to protect them from rancidification processes, hazelnuts must be dried immediately after harvest (Ghirardello et al., 2013; Turan, 2018). Therefore, it is necessary to design and accurately simulate a drying system for hazelnuts to sustain better quality.
Unfortunately, in the literature, studies concerning the effects of traditional sun-drying and the artificial drying methods on the fatty acid composition, sum of fatty acids and oil oxidation of the Çakıldak cultivar is very limited. Therefore, this work focuses on the evaluation of the effects of three different drying methods on the nut quality of the Çakıldak cultivar harvested in 2015, after two years of storage. In this work, the hazelnuts were stored under ambient temperature conditions, which are typical of commercial storage.
2. MATERIALS AND METHODSTOP
2.1. Samples and drying methodsTOP
The experiments were conducted on the Çakıldak cultivar (cv), harvested in a single orchard, in the Işıktepe neighborhood
(l 40°49'05.57˝ N, 37°31ʹ59.08˝ E, 1114 m a.s.l) in the Gürgentepe district of Ordu, Turkey on 4 to 15 September, 2015. The nuts were harvested by hand by picking them from the tree branches. The average kernel moisture content was about 28% at harvest
(Turan and İslam, 2016). The clusters were laid on grass ground (dimensions of the ground: 4x3 m, 30 kg in–shell hazelnut; GG) and dehydrated for five days (From 16 to 21 September, 2015) to allow moisture loss (19.18%). The nuts were separated from their husks using a husker (Dinçler Makine, FPHM 2500, Samsun, Turkey) and randomly divided into three groups:
The first group was dried in the sun on GG: The grass had been cut (to accelerate the drying process and prevent the canvas from getting wet) with a string trimmer (Oleo-Mac 440 T, Italy) and a canvas (TS 4739, TS 1534-2; EN ISO 2286-2, Kale Tente,
İstanbul, Turkey) was laid on the ground upon which the samples were placed and occasionally mixed. The second group was dried on concrete ground (Dimensions of the ground: 5x5 m, 30 kg in–shell hazelnut; CG): These nuts were directly placed onto CG
(TS EN 12390, Gümüştaş Çimento, Giresun, Turkey) and allowed to dry in the sun with occasional mixing. The drying process continued for 156 h for CG and 165 h for GG (Table 1). The CG and GG methods were performed in similar sunshine and environmental conditions (average of wind velocity, ambient air temperature and relative humidity and sunshine duration; 1.2 h·km–1, 25.7 °C, 69.3% and 5.45 h, respectively). The hazelnuts on CG and GG methods were dried every day from 8:00 a.m. to 8:00 p.m. continuously. After 8:00 p.m., plastic covers (Metroplast, İstanbul, Turkey) were used to prevent the samples from getting wet.
Table 1. Moisture contents of hazelnuts before and after dehydration, after drying and before storage and drying time.
| M |
Initial moisture content (%) |
Moisture content after dehydration (%) |
Final moisture (%) content after drying |
Drying time (h) |
| Shell |
Kernel |
Shell |
Kernel |
Shell |
Kernel |
| CG |
28.36±1.18 |
26.83±1.29 |
21.56±2.12 |
19.18±2.05 |
8.73±1.25 |
6.32±0.56 |
156 |
| GG |
|
|
|
|
6.82±0.82 |
6.70±0.72 |
165 |
| AD |
|
|
|
|
8.89±0.66 |
5.37±0.46 |
45 |
| Results are reported as mean value ± standard deviation of three replicate analyses (n=3). Abbreviations: M; drying method, CG; concrete ground, GG; grass ground, AD; artificial drying. |
The last group was dried in a drying machine (AD): These nuts were directly placed into the machine by conveyor belt, and dried using hot air at 50 °C (3000 kg in–shell hazelnut; FACMA ES 3000, 2013, Italy). Namely, the desiccation was obtained by the forced ventilation of hot air, which the heat–exchanger sends to the ventilator, which at the same time pushes it inside the body of the dryer. The sample, continuously ventilated, was mixed by a central Archimedean screw and ventilated with non heated air as well. The temperature inside the dryer was adjusted after about 3 h of each operation and ceased after 1.5 h. The Archimedean screw had continued circulation for 1.5 h in every cycle. The drying process continued until the moisture content was up to 5.37% and lasted for 45 h (Table 1). In addition, the drying characteristics (drying time and moisture content (Figure 1) were monitored during the drying process under the three drying conditions. The drying processes were carried out 22 and
30 September, 2015 in the Karapınar neighborhood (l 40°58ʹ17.53” N, 37°56ʹ00.41” E, 10 m a.s.l) in the Altınordu district,
Ordu, Turkey (Ordu OSB, Gürsoy Tarımsal Ürünler Gıda Sanayi ve Ticaret A.Ş. Entegre Tesisi).
|
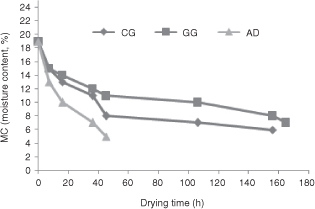 Figure 1. Drying curves for in–shell hazelnut during sun drying and artificial drying. Abbreviations: CG; concrete ground, GG; grass ground and AD; artificial drying. Results are reported as mean value ± standard deviation of three replicate analyses (n=3). Figure 1. Drying curves for in–shell hazelnut during sun drying and artificial drying. Abbreviations: CG; concrete ground, GG; grass ground and AD; artificial drying. Results are reported as mean value ± standard deviation of three replicate analyses (n=3).
|
|
The shell and kernel moisture contents were measured before and after dehydration, and again after drying and before storage and, the drying time (in hours) is shown in Table 1. At the end of drying, the samples were stored under ambient temperature conditions in jute bags (10 kg), and analyzed every three months (Faculty of Agriculture, Ordu University, Ordu, Turkey). Approximately 4 kg shell (approximately 2 kg of kernels) samples were removed and a total of 90 kg nuts were used for the analysis.
2.2. Storage conditionsTOP
The dried nuts were stored in 10 kg jute bags in a store room under the conditions of 20–25 °C and 70–90% relative humidity. The samples were stored for 24 months (2015–2017) and were analyzed every 12 weeks (3 months).
2.3. Lipid extractionTOP
Hazelnut oil was extracted by cold pressing (Pressure force: 10000 kgf, pressure: 34.7 MPa, temperature: –5 °C ~+45 °C and capacity; 250 g kernel) method using Ceselsan’s nut oil extraction system (AISI3004, Ceselsan, Giresun, Turkey). Kernel samples of ~2 kg were randomly selected and compressed (Turan, 2017). The recovered oil was separated by centrifugation at 4800 rpm for 5 min, and the oil was stored at −18 °C in a freezer until further analysis.
2.4. Protein and fat contentTOP
Protein content (PC) was determined using AOAC Standard Methods. PC (N×6.25) was estimated from 0.5 g samples according to the macro Kjehldahl method (Velp UDK 149, Europe). Lipid content (LC) was determined according to AOAC Official Methods (AOAC, 2000). LC was determined by extracting a known sample weight (5 g) with petroleum ether, using a soxhlet apparatus (Velp Ser 148,
Milano, Italy).
2.5. Moisture content and water activityTOP
Moisture content (MC) was determined according to Turkish Standards Institution (TSE)–TS 3075/T1 standard (Turan, 2017). MC was evaluated in ground hazelnut (Fakir Motto 800w, Germany) samples in an oven (Refsan RK 55, Kütahya, Turkey) at 105
°C until a constant weight was reached. Water activity (aw) was determined using the Novasina aw Sprint TH 500 (Switzerland) water activity analyzer (WAA, 2004).
2.6. Fatty acid compositionTOP
The fatty acid composition of hazelnut kernel oils was determined by gas chromatography (GC). Methyl esters of fatty acids
(FAMEs) were prepared according to Ficarra et al., (2010) with slight modifications. Oil samples (0.1 g) were placed in a screw-top vial of 10 mL and n–hexane was added and thoroughly mixed in a dark tube. Next, 500 μL potassium hydroxide and methanol mixture were added to this dark tube. The extract was transferred to a dark glass vial and immediately analyzed using Shimadzu GC–2010 (Tokyo, Japan). FAMEs were analyzed using a GC equipped with flame-ionization detector. A capillary column DB-23 (30 m × 0.25 mm idx 0.25–µm film thickness, Agilent
Technologies, J&W Scientific, USA) was used. The injector and detector temperatures were set at 250 °C. The split ratio was set at 1:8, and helium was used as the carrier gas at a flow rate of 1 mL/min. The column temperature was 90 °C for 7 min, then increased to 240 °C by 5 °C/min; finally, it was held 240 °C for 15 min. The injector and detector were 250 °C. FAMEs were identified by comparison with retention times of authentic standards, and quantified using the Agilent Chem–Station software. The obtained fatty-acid composition was used to calculate the sum of saturated (∑SFA), monounsaturated (∑MUFA), and polyunsaturated
(∑PUFA) fatty acids as well as the ratio of fatty acids (∑MUFA+PUFA/∑SFA).
2.7. Oxidation parametersTOP
To determine free fatty acids (FFA), peroxide value (PV; expressed as meq O2kg−1 oil), rancimat value (RV), ratio of oleic-to-linoleic acid (O/L), and iodine value (IV) were evaluated. FFA was determined using the AOAC Standard Method (AOAC, 1990a). A 2.5–5 g (m) sample of oil was weighed into a glass vial and dissolved in a 25–50 mL mixture of ethanol, diethyl ether
(1/1, v/v), and 2–3 drops of phenolphthalein. This was then titrated with NaOH (0.1 N) (V) until the pink color persisted for at least 10s. FFA was calculated as FFA (% oleic acid) = (V/m) ×28.2. To determine PV, 2–2.5 g of oil were weighed into a glass vial and dissolved in 100 mL acetic acid/isooctane (3/2, v/v) and supplemented with 0.2 mL potassium iodide (Metrohm,
Dosimat 799, Switzerland; (AOAC, 1990b). RV was determined using a Rancimat 743 device [Metrohm, Switzerland; Velasco et al., (2004)]. IV was determined according to the percentages of fatty acids using the following formula: [(palmitoleic acid × 1.901)
+ (oleic acid × 0.899) + (linoleic acid × 1.814) + (linolenic acid × 2.737; Belviso et al., (2017)]
2.8. Statistical analysisTOP
Experiments were performed in triplicate with a randomized-block design. Descriptive statistics were obtained with SPSS v. 22.0 (Armok, New York: IBM Corp.). Statistical tests were performed using the SAS–JAMP v. 10.0 (SAS Institute Inc., Cary,
North Carolina). A one-way ANOVA was conducted to assess significant differences among levels and the least significance difference (LSD) test was used to compare multiple means. Results were considered to be significantly different at p ˂ 0.05, p ˂ 0.01 and p ˂ 0.001.
3. RESULTS AND DISCUSSIONTOP
3.1. Protein contentTOP
The results obtained for the effect of three drying methods and storage on protein content (PC) are given in Table 2. Concerning PC, no significant differences among drying methods were found (p ˃ 0.05; Table 2), and varied from 14.04 to 14.30%. The present result shows similarity to the data acquired by Turan and İslam (2016) and Kermani et al., (2017). In relation to the storage period, a significant difference was found for PC (p ˂ 0.001), and remained stable until ~9 months, showed fluctuation at the 12th month, but generally increased and decreased again at the end of the storage period (14.04–17.95%). Such fluctuations in
PC must have been due to changes in MC because it is known that the storage time does not generally affect the PC (Delgado et al., 2017). Moreover, Turan and İslam (2016) and Koç Güler et al., (2017) whose studies are generally similar to our study, reported that PC decreased with fluctuation during the storage period.
Table 2. Effects of drying methods on protein contents, lipid contents, moisture contents and water activity of hazelnuts during 24 months of storage.
| P |
Storage periods (months) |
Sign. |
| M |
0 |
3 |
6 |
9 |
12 |
15 |
18 |
21 |
24 |
M |
S |
SxM |
| PC (%) |
CG |
14.12±0.11jkl |
14.92±0.11i |
14.52±0.08ijk |
14.73±0.25ij |
16.56±1.00fgh |
17.31±0.27a-e |
16.67±0.58efg |
17.95±0.08a |
17.32±0.24a-e |
ns |
*** |
* |
| |
GG |
14.30±0.00i-l |
14.38±0.98i-l |
13.77±0.24l |
14.57±0.38ij |
16.80±0.35def |
17.44±0.44a-d |
17.18±0.28b-f |
17.90±0.09ab |
17.43±0.16a-d |
|
|
|
| |
AD |
14.04±1.20jkl |
15.90±0.22h |
13.82±0.59kl |
14.97±0.65i |
17.14±0.26c-f |
17.89±0.10ab |
16.96±0.06def |
17.76±0.16abc |
16.03±0.19gh |
|
|
|
| LC (%) |
CG |
51.93±0.12a-d |
51.60±0.53b-f |
51.40±0.53b-g |
50.83±0.76d-i |
50.03±0.75ijk |
49.99±0.02ijk |
48.83±0.29klm |
47.87±0.81mn |
50.55±0.48e-i |
ns |
*** |
* |
| |
GG |
52.23±1.59ab |
51.43±0.61b-g |
50.42±0.72f-i |
51.29±1.25b-h |
50.35±0.71g-j |
49.93±0.12ijk |
49.17±0.76jkl |
47.00±0.20n |
48.00±0.20lmn |
|
|
|
| |
AD |
52.90±1.39a |
50.88±1.03c-i |
52.08±0.13abc |
51.71±0.61a-e |
50.07±1.31hij |
49.86±0.12ijk |
48.16±0.37lmn |
48.27±1.27lm |
47.80±0.00mn |
|
|
|
| MC (%) |
CG |
5.35±0.01f |
4.65±0.01m |
4.41±0.01o |
5.30±0.00g |
6.74±0.01a |
4.11±0.01s |
3.55±0.01u |
4.45±0.03d |
4.72±0.03k |
*** |
*** |
*** |
| |
GG |
5.31±0.01g |
4.11±0.01s |
4.28±0.01q |
5.00±0.00i |
6.40±0.00c |
4.51±0.01n |
3.38±0.00v |
4.68±0.02l |
4.38±0.03p |
|
|
|
| |
AD |
4.95±0.01j |
4.18±0.00r |
4.33±0.01p |
5.02±0.00i |
6.50±0.01b |
4.00±0.00t |
3.35±0.01w |
4.66±0.02l |
4.33±0.03p |
|
|
|
| aw |
CG |
0.60±0.00h |
0.57±0.01i |
0.50±0.00m |
0.60±0.00h |
0.72±0.01a |
0.50±0.01m |
0.35±0.00p |
0.65±0.01d |
0.62±0.01e |
*** |
*** |
*** |
| |
GG |
0.55±0.00l |
0.56±0.00k |
0.50±0.00m |
0.60±0.00h |
0.70±0.00b |
0.50±0.00m |
0.41±0.00o |
0.61±0.01f |
0.66±0.01c |
|
|
|
| |
AD |
0.60±0.00h |
0.57±0.01j |
0.50±0.00m |
0.60±0.00h |
0.70±0.00b |
0.47±0.01n |
0.35±0.01p |
0.62±0.01e |
0.61±0.01g |
|
|
|
| Results are reported as mean value ± standard deviation of three replicate analyses (n=3). Abbreviations: P; parameter, M; drying method, S; storage period, CG; concrete ground, GG; grass ground and AD: artificial drying, PC; protein content, LC; lipid content, MC; moisture content and aw: water activity. Different letters in columns for each different drying, indicate significantly different values among storage times. Significant level; *, **, *** and “ns” indicate significance at p < 0.05, 0.01, 0.001 and “not significant”, respectively, between drying and storage time. |
3.2. Lipid contentTOP
In relation to lipid content (LC), the effect of drying methods was not found to be significant (p ˃ 0.05), and the highest value obtained was 52.90% in AD and the lowest value was 51.93% when the CG method was applied. In addition to the similar studies reporting that drying methods do not affect LC (Turan and İslam, 2016; Kermani et al., 2017), there are also other studies (2.22–3.13 g/100 g dry weight) reporting that they affect the LC (Delgado et al., 2017). These differences may be due to several factors such as species, cultivar or drying methods. For the storage periods, as expected, the LC showed a slight fluctuation, but generally showed a tendency to decrease (p ˂ 0.001; Table 2), and this change was between 52.90% and 47.80%. It is also known that the hazelnuts stored in ambient conditions show a tendency in this direction (Turan and Islam, 2016). However, Ghirardello et al., (2013) stated that LC increased in hazelnuts stored in ambient conditions, but Koç Güler et al., (2017) reported that the value remained almost stable. These differences may be due to differences in ambient humidity, shell and/or kernel traits of the hazelnuts.
3.3. Moisture contentTOP
With respect to moisture content (MC), it is recommended that the MC does not exceed the 5% threshold value in order to maintain the quality traits of hazelnuts without deterioration (TSE, 2001). According to the hazelnut purchasing regulations in Turkey, the MC should be less than 6% (Turan and İslam, 2018), otherwise it is known that the hazelnuts are not purchased. The effect of drying method on MC was found to be significant
(p ˂ 0.001), and the lowest value was recorded as 4.95% in AD and the highest value as 5.35% when the CG method was applied.
Concerning the effect of storage, significant differences were found among drying methods for MC (p ˂ 0.001; Table 2). Moreover, the MC tended to decrease from the beginning of the storage period to the 9thmonth (5.35–4.28%); it decreased until the 18th month (3.35%) after reaching its maximum value (6.74%) at the 9th and 12th months, and increased again at the end of the storage period (4.33–4.72%, Table 2). According to the obtained results, it is possible to state that changing ambient humidity affects the MC of the samples and that Çakıldak cv has a thin shell which plays a significant role in such a result. As in our study, there are many studies showing that the MC in hazelnuts usually decreases in addition to fluctuation during storage time (Turan and İslam, 2016; Koç Güler et al., 2017; Turan, 2017).
3.4. Water activityTOP
Water activity (aw) is considered to be one of the most important parameters affecting oil oxidation in food (Özdemir et al., 2002). It is also known that the value of oxidation is very low when aw is between 0.3–0.5 and therefore kernel humidity should be below 5%. As in the studies by Turan and İslam (2016), among the drying methods, the highest values were found for CG and when AD (0.60) methods were applied, and the lowest value was found for the GG (0.55) method. This difference between them is considered significant (p ˂ 0.001; Table 2). In our study, aw showed a similar tendency toward the change in MC and remained in the range of 0.35–0.72 during storage.
Although the fluctuating tendency of aw during storage showed similarities with the studies by Turan and İslam (2016) and Koç Güler et al., (2017), it varied with the tendency to get close to the initial value at the end of the storage period. It has also been reported that if the aw exceeds 0.83 for two days, a flatoxin may form; thus, it should never exceed the threshold value (Turan, 2017). Our study, there was no such risk since all the aw obtained obtained were less than 0.72.
3.5. Fatty acid compositionTOP
For the fatty acid profile, as shown in Table 3, Çakıldak cv contains a total of 13 fatty acids. Among them, the one at the highest rate is oleic acid (C18:1), which is followed by linoleic (C18:2), palmitic (C16:0), and stearic (C18:0) fatty acids. The effects of drying method and storage are considered significant (p ˂ 0.001). In addition, caproic (C6: 0), caprylic (C8: 0), capric (C10: 0), lauric (C12: 0), eicosadienoic (20: 2) and lignoceric
(C24: 0) fatty acids were not found at a level to be recognized in the study (< 0.001%). The major group constituted ~99.00% of the total fatty acids while the minor group constituted ~0.5% of the total fatty acids (Table 3). Many factors such as variety, origin, growing conditions, maturity, fertilization, harvesting time, season, soil type, climate, altitude and storage conditions influence acid composition (Amaral et al., 2006). For example, Tüfekçi and Karataş (2018) reported that hazelnuts from the Middle Black Sea Region contain high amounts of saturated (8.45%) and monounsaturated fatty acids (83.45%) but low amounts of polyunsaturated fatty acids (7.8%); whereas hazelnuts from the Eastern Black Sea Region contain high amounts of linoleic (9.10%) and linolenic (0.09%) acids. In addition, Alaşalvar et al., (2010) stated that Tombul cv contains 5.61% palmitic (C16:0), 82.16% oleic (C18:1) and 8.26% linoleic (C18:2) acids; Palaz cv contains
6.64% palmitic (C16:0), 81.97% oleic (C18:1) and 8.32% linoleic (C18:2) acids; Çakıldak cv contains 5.02% palmitic (C16:0),
80.99% oleic (C18:1) and 10.63% linoleic (C18:2) acids.
Table 3. Effects of drying methods on fatty acid compositions of hazelnuts during 24 months of storage.
| P |
Storage periods (months) |
Sign. |
| M |
0 |
3 |
6 |
9 |
12 |
15 |
18 |
21 |
24 |
M |
S |
SxM |
| C14:O (%) |
CG |
0.03±0.00cde |
0.04±0.01ab |
0.02±0.01ef |
0.02±0.00f |
0.02±0.00f |
0.04±0.00a |
0.03±0.00cd |
0.03±0.01bc |
0.03±0.01bc |
** |
*** |
*** |
| |
GG |
0.03±0.01de |
0.02±0.00f |
0.02±0.00f |
0.02±0.00f |
0.02±0.00f |
0.02±0.00f |
0.03±0.00cd |
0.04±0.01ab |
0.04±0.01ab |
|
|
|
| |
AD |
0.03±0.01de |
0.02±0.01ef |
0.02±0.00f |
0.03±0.00cd |
0.03±0.00cd |
0.03±0.00cd |
0.03±0.01de |
0.03±0.01bc |
0.03±0.00cd |
|
|
|
| C16:O (%) |
CG |
3.90±0.04k |
3.93±0.01j |
4.01±0.01i |
3.76±0.01n |
3.76±0.01n |
3.75±0.01n |
3.75±0.01n |
3.70±0.01o |
3.67±0.01p |
*** |
*** |
*** |
| |
GG |
4.00±0.04i |
4.05±0.01h |
3.95±0.01j |
3.850.01±l |
3.86±0.02l |
3.82±0.01m |
3.82±0.01m |
3.80±0.01m |
3.65±0.01p |
|
|
|
| |
AD |
4.08±0.02g |
4.12±0.01f |
4.14±0.01f |
4.50±0.01d |
4.44±0.01e |
4.55±0.01c |
4.58±0.01b |
4.59±0.01ab |
4.60±0.01a |
|
|
|
| C16:1 (%) |
CG |
0.08±0.00cd |
0.08±0.01bcd |
0.09±0.01bc |
0.09±0.01bc |
0.07±0.01f |
0.08±0.00cd |
0.08±0.00cd |
0.08±0.01de |
0.08±0.01bcd |
** |
*** |
* |
| |
GG |
0.08±0.01bcd |
0.09±0.01bc |
0.08±0.01bcd |
0.08±0.00cd |
0.07±0.00ef |
0.08±0.00cd |
0.08±0.01de |
0.08±0.01bcd |
0.08±0.01bcd |
|
|
|
| |
AD |
0.09±0.00b |
0.10±0.01a |
0.08±0.01bcd |
0.08±0.00cd |
0.07±0.00ef |
0.08±0.00cd |
0.09±0.01bc |
0.08±0.01bcd |
0.09±0.00b |
|
|
|
| C17:O (%) |
CG |
0.03±0.00d |
0.04±0.01bcd |
0.04±0.01bcd |
0.03±0.01cd |
0.03±0.01cd |
0.04±0.00bc |
0.04±0.01ab |
0.03±0.01cd |
0.04±0.01ab |
*** |
*** |
** |
| |
GG |
0.03±0.01cd |
0.04±0.01bcd |
0.03±0.01cd |
0.03±0.00d |
0.03±0.00d |
0.03±0.00d |
0.04±0.00bc |
0.03±0.01cd |
0.04±0.00bc |
|
|
|
| |
AD |
0.03±0.01cd |
0.04±0.01bcd |
0.04±0.01bcd |
0.03±0.00d |
0.03±0.00d |
0.05±0.00a |
0.05±0.00a |
0.05±0.00a |
0.05±0.00a |
|
|
|
| C17:1 (%) |
CG |
0.04±0.00fg |
0.05±0.01def |
0.05±0.01def |
0.05±0.00cde |
0.05±0.01def |
0.07±0.00a |
0.06±0.01bc |
0.06±0.00b |
0.06±0.01bc |
*** |
*** |
*** |
| |
GG |
0.04±0.01efg |
0.04±0.01efg |
0.05±0.00cde |
0.04±0.01gh |
0.04±0.01efg |
0.04±0.00fg |
0.03±0.00h |
0.04±0.01gh |
0.04±0.00fg |
|
|
|
| |
AD |
0.04±0.00fg |
0.05±0.00cde |
0.04±0.01efg |
0.04±0.01fg |
0.04±0.00fg |
0.05±0.00cde |
0.05±0.00cde |
0.05±0.01bcd |
0.06±0.01b |
|
|
|
| C18:O (%) |
CG |
1.74±0.00q |
1.74±0.01q |
1.77±0.01mn |
2.21±0.01f |
2.25±0.02d |
2.22±0.02e |
2.31±0.01c |
2.35±0.01b |
2.40±0.01a |
*** |
*** |
*** |
| |
GG |
1.65±0.01r |
1.64±0.01r |
1.75±0.01op |
1.76±0.01no |
1.75±0.01pq |
1.79±0.01kl |
1.79±0.01kl |
1.81±0.01j |
1.84±0.01hi |
|
|
|
| |
AD |
1.74±0.01pq |
1.75±0.01pq |
1.89±0.02g |
1.85±0.01h |
1.85±0.01h |
1.83±0.01i |
1.80±0.01jk |
1.77±0.01mn |
1.78±l0.01m |
|
|
|
| C18:1 (%) |
CG |
83.04±0.07abc |
83.03±0.02abc |
82.68±0.03c-g |
82.50±0.02e-h |
82.51±0.01e-h |
82.62±0.01d-g |
82.51±0.01e-h |
82.41±0.01gh |
82.31±0.01j |
* |
*** |
*** |
| |
GG |
82.79±0.08b-f |
82.45±0.03fgh |
82.98±0.03bcd |
82.77±0.01b-g |
82.55±0.01e-g |
82.55±0.01e-g |
82.45±0.01fgh |
82.40±0.01gh |
81.69±1.15i |
|
|
|
| |
AD |
83.36±0.17a |
82.19±0.04h |
83.13±0.02ab |
82.86±0.02b-e |
82.75±0.01c-g |
82.60±0.01efg |
82.55±0.01e-h |
82.49±0.01e-h |
82.49±0.01e-h |
|
|
|
| C18:2 (%) |
CG |
10.28±0.26p |
10.69±0.01ij |
10.95±0.04ef |
10.59±0.03kl |
10.50±0.02lmn |
10.84±0.01gh |
10.87±0.01fg |
10.89±0.01fg |
11.00±0.01e |
*** |
*** |
*** |
| |
GG |
10.84±0.08gh |
11.34±0.01c |
10.78±0.03hi |
11.19±0.02d |
11.33±0.03c |
11.35±0.01c |
11.39±0.01bc |
11.44±0.01ab |
11.49±0.01a |
|
|
|
| |
AD |
10.95±0.02ef |
11.44±0.02ab |
10.39±0.01o |
10.45±0.00no |
10.44±0.01no |
10.49±0.00mn |
10.55±.01klm |
10.59±0.00k |
10.62±0.01jk |
|
|
|
| C18:3 (%) |
CG |
0.11±0.00a |
0.11±0.01ab |
0.10±0.01abc |
0.09±0.01cd |
0.10±0.00bc |
0.10±0.00bc |
0.10±0.00bc |
0.10±0.00bc |
0.09±0.01ef |
*** |
*** |
*** |
| |
GG |
0.10±0.01abc |
0.10±0.00bc |
0.10±.01abc |
0.07±0.00h |
0.08±0.01efg |
0.08±0.00fg |
0.07±0.00h |
0.09±0.01ef |
0.08±0.01gh |
|
|
|
| |
AD |
0.09±0.00de |
0.10±0.00abc |
0.09±0.00cd |
0.10±0.01abc |
0.10±0.00bc |
0.09±0.00de |
0.08±0.00fg |
0.09±0.00ef |
0.08±0.00efg |
|
|
|
| C20:0 (%) |
CG |
0.09±0.00b |
0.08±0.01bc |
0.08±0.01cde |
0.08±0.01bc |
0.06±0.01f |
0.07±0.01ef |
0.07±0.00ef |
0.07±0.01def |
0.07±0.01def |
*** |
*** |
*** |
| |
GG |
0.08±0.01cde |
0.07±0.01def |
0.06±0.00f |
0.07±0.00def |
0.07±0.00ef |
0.07±0.00ef |
0.08±0.00cd |
0.08±0.00cd |
0.07±0.00ef |
|
|
|
| |
AD |
0.08±0.00cde |
0.08±0.00cd |
0.08±0.00bc |
0.06±0.00f |
0.08±0.00cd |
0.08±0.00cd |
0.10±0.00a |
0.10±0.01a |
0.11±0.01a |
|
|
|
| C20:1 (%) |
CG |
0.11±0.00a |
0.10±0.00b |
0.10±0.01b |
0.10±0.00bc |
0.09±0.01cd |
0.10±0.00bc |
0.10±0.00bc |
0.09±0.01de |
0.08±0.01f |
*** |
*** |
*** |
| |
GG |
0.10±0.00bc |
0.10±0.00b |
0.09±0.01cd |
0.05±0.00i |
0.05±0.00i |
0.06±0.00h |
0.05±0.00i |
0.05±0.00i |
0.07±0.00h |
|
|
|
| |
AD |
0.10±0.00b |
0.10±0.01b |
0.10±0.00bc |
0.09±0.00cd |
0.10±0.00bc |
0.09±0.00e |
0.08±0.00f |
0.08±0.00f |
0.10±0.01b |
|
|
|
| C22:0 (%) |
CG |
0.04±0.01cde |
0.04±0.01cde |
0.02±0.01g |
0.04±0.01bc |
0.04±0.00cd |
0.04±0.00cd |
0.04±0.00cd |
0.05±0.00ab |
0.05±0.01a |
*** |
* |
*** |
| |
GG |
0.04±0.01cde |
0.04±0.00cde |
0.04±0.00cde |
0.04±0.01cde |
0.04±0.00cd |
0.03±0.00efg |
0.03±.00efg |
0.03±0.00efg |
0.03±0.01fg |
|
|
|
| |
AD |
0.03±0.00def |
0.04±0.00cd |
0.03±0.00cde |
0.03±0.00efg |
0.03±0.01def |
0.05±0.00ab |
0.04±0.00cd |
0.03±0.00def |
0.03±0.01def |
|
|
|
| C24:1 (%) |
CG |
0.03±0.01bc |
0.02±0.01bcd |
0.02±0.01bcd |
0.04±0.00a |
0.03±0.01bc |
0.02±0.00cd |
0.03±0.00b |
0.02±0.00bcd |
0.02±0.01bcd |
*** |
*** |
*** |
| |
GG |
0.03±0.00b |
0.02±0.00cd |
0.02±0.00bcd |
0.03±0.00b |
0.04±0.00a |
0.04±0.00a |
0.03±0.00b |
0.03±0.00bc |
0.03±0.00bc |
|
|
|
| |
AD |
0.02±0.00bcd |
0.02±0.00bcd |
0.02±0.00bcd |
0.02±0.00cd |
0.03±0.01bc |
0.02±0.01bcd |
0.03±0.00b |
0.02±0.00d |
0.02±0.00d |
|
|
|
| Results are reported as mean value ± standard deviation of three replicate analyses (n=3). Abbreviations: P; parameter, M; drying method, S; storage period, CG; concrete ground, GG; grass ground and AD: artificial drying. Different letters in columns for each different drying method indicate significantly different values among storage times. Significant level; *, **, *** and “ns” indicate significance at p < 0.05, 0.01, 0.001 and “not significant”, respectively between drying and storage time
|
The ratio of saturated (SFA), monounsaturated (MUFA), polyunsaturated (PUFA), unsaturated/saturated fatty acids (MUFA+PUFA SFA), oleic/linoleic acid ratio (O/L), iodine value (IV), free fatty acidity (FFA), rancimat value (RV) and peroxide value (PV) are shown in Table 4.
Table 4. Effects of drying methods on sum of fatty acids and oil oxidation of hazelnuts during 24 months of storage.
| P |
Storage periods (months) |
Sign. |
| M |
0 |
3 |
6 |
9 |
12 |
15 |
18 |
21 |
24 |
M |
S |
SxM |
| SFA (%) |
CG |
5.82±0.03l |
5.86±0.01k |
5.94±0.01j |
6.14±0.02g |
6.17±0.02g |
6.16±0.03g |
6.24±0.02e |
6.23±0.00ef |
6.28±0.03d |
*** |
*** |
*** |
| |
GG |
5.82±0.05l |
5.85±0.01k |
5.86±0.01k |
5.77±0.02mn |
5.77±0.02mn |
5.75±0.01n |
5.80±0.01lm |
5.79±0.01m |
5.66±0.01o |
|
|
|
| |
AD |
5.86±0.01k |
6.04±0.01h |
6.21±0.02f |
6.50±0.01b |
6.46±0.01c |
6.58±0.01a |
6.59±0.02a |
6.58±0.01a |
6.60±0.01a |
|
|
|
| MUFA (%) |
CG |
83.09±0.07b-e |
83.29±0.03abc |
82.94±0.03c-h |
82.78±0.02e-i |
82.74±0.01e-i |
82.89±0.01d-h |
82.77±0.01e-i |
82.66±0.00ghi |
81.55±0.02j |
** |
*** |
*** |
| |
GG |
83.05±0.08b-f |
82.70±0.03f-i |
83.23±0.03bcd |
82.97±0.01c-h |
82.75±0.01e-i |
82.77±0.01e-i |
82.63±0.01ghi |
82.60±0.02hi |
81.91±1.16j |
|
|
|
| |
AD |
83.11±0.17b-e |
82.47±0.04i |
83.38±0.01ab |
83.09±0.03b-e |
82.98±0.01c-g |
82.85±0.01e-h |
82.79±0.01e-i |
82.73±0.00e-i |
82.76±0.01e-i |
|
|
|
| PUFA (%) |
CG |
10.39±0.26p |
10.79±0.01j |
11.05±0.04fg |
10.68±0.03kl |
10.60±0.02lmn |
10.94±0.01hi |
10.97±0.01gh |
10.99±0.01gh |
11.09±0.01f |
*** |
*** |
*** |
| |
GG |
10.94±0.08hi |
11.44±c0.01d |
10.88±0.03ij |
11.25±0.02e |
11.41±0.02d |
11.42±0.01d |
11.46±0.01bcd |
11.52±0.02abc |
11.57±0.01a |
|
|
|
| |
AD |
11.00±0.02gh |
11.54±0.02ab |
10.48±0.02o |
10.55±0.01mno |
10.53±0.02no |
10.58±0.01mn |
10.62±0.01klm |
10.68±0.01kl |
10.70±0.01k |
|
|
|
| MUFA+PUFA/SFA |
CG |
16.09±0.08e |
16.04±0.03e |
15.80±0.02f |
15.20±0.04hi |
15.12±0.05ij |
15.22±0.06h |
15.01±0.05kl |
15.00±0.00l |
14.75±0.06m |
*** |
*** |
*** |
| |
GG |
16.14±0.13de |
16.07±0.03e |
16.05±0.02e |
16.31±0.04bc |
16.31±0.04bc |
16.37±0.03b |
16.23±0.01cd |
16.25±0.03c |
16.50±0.19a |
|
|
|
| |
AD |
15.78±0.06f |
15.55±0.03g |
15.10±0.05jk |
14.39±0.01n |
14.46±0.03n |
14.19±0.01o |
14.17±0.04o |
14.18±0.01o |
14.14±0.01o |
|
|
|
| FFA |
|
|
|
|
|
|
|
|
|
|
|
|
|
| (%, oleic acid) |
CG |
0.12±0.00n |
0.25±0.01j |
0.29±0.01i |
0.24±0.01j |
0.25±0.00j |
0.38±0.00h |
0.45±0.01f |
0.39±0.01gh |
0.64±0.02a |
*** |
*** |
*** |
| |
GG |
0.08±0.01o |
0.22±0.01k |
0.28±0.00i |
0.25±0.00j |
0.20±0.00l |
0.48±0.00e |
0.50±0.00d |
0.44±0.03f |
0.62±0.02b |
|
|
|
| |
AD |
0.06±0.01p |
0.14±0.01mn |
0.27±0.01i |
0.15±0.00m |
0.20±0.00l |
0.27±0.01i |
0.40±0.00g |
0.39±0.02gh |
0.52±0.01c |
|
|
|
| RV (h) |
CG |
4.64±0.01f |
4.54±0.01g |
4.65±0.00f |
4.74±0.01de |
4.78±0.01cd |
3.95±0.01i |
3.40±0.01m |
3.30±0.09n |
2.66±0.09r |
*** |
*** |
*** |
| |
GG |
4.65±0.00f |
4.34±0.01h |
4.64±0.01f |
4.64±0.01f |
4.80±0.01cd |
3.84±0.01j |
3.49±0.01l |
3.15±0.07o |
3.01±0.07p |
|
|
|
| |
AD |
5.12±0.01a |
4.84±0.01c |
4.84±0.01c |
5.05±0.00b |
5.01±0.01b |
4.70±0.01ef |
3.71±0.01k |
3.37±0.06mn |
2.94±0.14q |
|
|
|
| PV (meqO2kg–1) |
CG |
0.00±0.00n |
0.00±0.00n |
0.31±0.01jk |
0.28±0.00kl |
0.00±0.00n |
0.04±0.00mn |
0.85±0.01g |
2.93±0.05b |
1.95±0.07d |
*** |
*** |
*** |
| |
GG |
0.00±0.00n |
0.00±0.00n |
0.31±0.01jk |
0.00±0.00n |
0.08±0.00m |
0.05±0.00mn |
0.71±0.01i |
2.71±0.06c |
3.85±0.12a |
|
|
|
| |
AD |
0.00±0.00n |
0.00±0.00n |
0.35±0.01j |
0.00±0.00n |
0.25±0.00l |
0.05±0.00mn |
0.77±0.01h |
1.38±0.03f |
1.45±0.05e |
|
|
|
| Results are reported as mean value ± standard deviation of three replicate analyses (n=3). Abbreviations: P; parameter, M; drying method, S; storage period, CG; concrete ground, GG; grass ground and AD: artificial drying. SFA; saturated fatty acid, MUFA; monounsaturated fatty acid, PUFA; polyunsaturated fatty acid, MUFA+PUFA/SFA; ratio of fatty acids, FFA; free fatty acids, PV; peroxide value, RV; rancimat value. Different letters in columns for each different drying method indicate significantly different values among storage times. Significant level; *, **, *** and “ns” indicate significance at p < 0.05, 0.01, 0.001 and “not significant”, respectively between drying and storage time. |
In relation to MUFA, as expected, it formed the main fatty acid group (81.55–83.38%), followed by PUFA (10.39–11.57%) and
SFA (5.75–6.60%). Alaşalvar et al., (2010) reported similar results and found that hazelnuts contain low level SFA (7.46–9.59%), medium level PUFA (3.92–13.86%) and high amounts of MUFA (78.10–87.26%). In addition, Turan (2018) reported that MUFA was the principal group of fatty acids (83.56–85.03%), followed by PUFA (9.36–11.17%) and SFA (5.61–6.60%). However, Amaral et al., (2006) reported that SFA and PUFA fatty acids were at an equal level when MUFA formed the main group of fatty acids.
Regarding the effect of drying method on total fatty acids and fat oxidation, significant differences were observed among drying methods (p ˂ 0.001), and the data are given in Table 4. In terms of SFA, the highest value was recorded in AD (5.86%) and the lowest value was recorded for the CG and GG (5.82%) methods and as in the data recorded by Özdemir et al., (2002) on Tombul cv and chestnuts by Delgado et al., (2017). The difference between the drying methods was found significant (p ˂ 0.001; Table 4). However, in walnuts, sun drying and oven drying methods were not found to be effective on palmitic (6.08–6.64%) or stearic acid (1.77–1.71%; Qu et al., 2016). With respect to storage period, although the SFA fluctuated in some periods, a decrease in GG (5.82–5.66%) was observed, while an increase was observed for CG and AD (5.82–6.28%; 5.86–6.60%, respectively) methods and this difference was considered to be significant (p ˂ 0.001). In addition, Ghirardello et al., (2013) reported that the SFA increased in hazelnuts store under ambient conditions (7.69–8.51%), and Belviso et al., (2017) reported that this value differs according to the roasting temperature and cultivar. For example, a decrease was observed in SFA (170 °C–20 min; 9.73–9.32%) with the increase in roasting temperature in the Tonda Gentile Trilobata (TGT) during storage time; whereas it increased in hazelnuts from Ordu (7.37–7.61%).
Concerning MUFA, it was composed mainly of oleic (C18:1) acid, followed by palmitoleic (C16:1), eicosenoic (C20:1), heptadecenoic
(C17:1), and nervonic (C24:01) fatty acids, and significant difference were found among the drying methods (p ˂ 0.01). The highest MUFA was recorded in AD (83.11%); whereas the lowest was recorded for the GG (83.05%) method (Table 4). Özdemir et al., (2002) reported that oleic acid increased with an increase in the drying temperature in Tombul cv (35–50 °C; 81.0–83.3%, respectively); whereas Delgado et al., (2016) reported that this value in chestnuts decreased with an increase in the drying time in addition to the fact that it depended on cultivar (0–10 h; 36.2–32.3%, respectively). Moreover, Delgado et al., (2017) reported that the value changed between 37.95% and 29.9% according to the drying methods. As expected, the MUFA showed a decrease in the range of 83.11–81.55% during the storage period (Table 4) and showed similarities to the results obtained in TGT and Ordu hazelnuts by Belviso et al., (2017). However, Delgado et al., (2017) reported that the MUFA in chestnuts exhibited different behavior according to the method during storage periods [hot air drying (D); 29.9–28.8%; freeze–drying (FD); 29.5–30.4%].
Regarding PUFA, it was reported that linoleic (C18:2) and linolenic (C18:3) acids are the best representatives of PUFA (Delgado et al., 2017) and that linoleic acid is always below 9% of total fatty acids (Ghirardello et al., 2013). In our study, however, no such data (10.28–10.94%) was found for Çakıldak cv (Table 3). Regarding drying methods, the highest PUFA was recorded for AD (11.00%) and the lowest value was recorded for the CG (10.39) method, and was found to be significant (p ˂ 0.001, Table 4), in accordance with Delgado et al., (2017). With respect to storage time, the PUFA both fluctuates and varies according to the drying method (Table 4). There was an increase in the CG and GG methods (10.39–11.09%; 10.94–11.57%, respectively), and decrease in the AD method
(11.00–10.70%) during the storage period and the difference was found to be significant (p ˂ 0.001). Belviso et al., (2017) reported that PUFA increased in roasted hazelnuts during the storage period; while Ghirardello et al., (2013) reported that linoleic acid (C18:2) increased during storage for 12 months under ambient conditions (6.16–6.87%), but linolenic acid (C18:3) decreased (0.13–0.00%).
In relation to unsaturated/saturated (MUFA+ PUFA/SFA), in contrast to the results found by Qu et al., (2016) and Juhaimi et al., (2018), significant differences were found among drying methods (p ˂ 0.001; Table 4) in the present study, and this value was found to be between 15.78–16.14%, and the highest value was recorded for GG and the lowest value was recorded for the AD method. MUFA+PUFA/SFA are used to estimate the shelf-life of the hazelnuts, and a low rate indicates a long shelf-life. From this point, it can be said that the AD method was determined to be the most suitable method for the storage in our study.
With respect to storage time, the effect of drying methods varied. For example, a decrease in MUFA+PUFA/SFA was found in the
CG method (16.09–14.74%) and in the AD (15.78–14.14%) method in accordance with the studies by Koyuncu et al., (2005), Ghirardello et al., (2013), and Belviso et al., (2017), but an increase in the GG method (16.14–16.50%) was recorded (Table 4). These differences may be due to the effects of one or more of the possible factors affecting the composition of fatty acids emphasized by Amaral et al., (2006), Alaşalvar et al., (2010), and Turan (2018). In addition, different drying methods may generate different time–temperature profiles in hazelnuts, and therefore different chemical reactions may occur during each process. In some of these chemical reactions the constituents of the hazelnuts may react with others and these chemical complexes may not be detected in the analyses, leading to the observation of different chemical compositions (Özilgen, 2014). Furthermore, the heterogeneity of the internal part of the nut within a single cultivar or even a single nut causes the plant tissue to be susceptible to various types of thermal, mechanical or enzymatic processes. Technological treatment changes the structure of the raw nut by modifying not only enzymatic reactions occurring in the tissue, but most of all, by affecting the conditions of the heat and mass exchange that occur in the plant material (Janowicz and Lenart, 2018).
3.6. Oxidation of the oilsTOP
Drying process and storage can influence the oil oxidation of hazelnuts which are subjected to oxygen and high temperature, which are also related to MC and aw of hazelnut kernels (Table 2). Lipid oxidation is one of the main causes of quality deterioration during the drying (Wang et al., 2018) and storage periods. The O/L, IV, FFA, PV, and RV of hazelnut oils were monitored to investigate the influences of different drying methods and long–term storage.
Regarding oil oxidation, it is known that oleic (C18:1) and linoleic (C18:2) unsaturated fatty acids are found at a high rate in hazelnut oils and therefore are known to be susceptible to oxidation (Alaşalvar et al., 2010). In addition, the oleic/linoleic acid ratio (O/L) is one of the crucial properties used to evaluate the kernel quality of hazelnuts, and linoleic acid is more susceptible to oxidation than oleic acid (Qu et al., 2016). Therefore, a high O/L ratio is an indication of greater resistance to oxidation (Belviso et al., 2017). In terms of O/L, significant differences were found among methods (p ˂ 0.001; Figure 2A), and the highest value was recorded for CG (8.08) and the lowest value was recorded for the AD (7.61) method. However, Qu et al., (2016) reported that oleic acid (C18:1) increased at an important rate when oven drying was applied (12.52–21.11%, respectively), and that linoleic acid (C18:2) decreased for walnut (70.41–61.05%). These values were higher than for sun drying, in contrast to our findings. Concerning storage time, there was generally a decrease in all drying methods in accordance with the studies by Belviso et al., (2017), and the highest value at the end of the storage period was recorded for the AD (7.76) method.
|
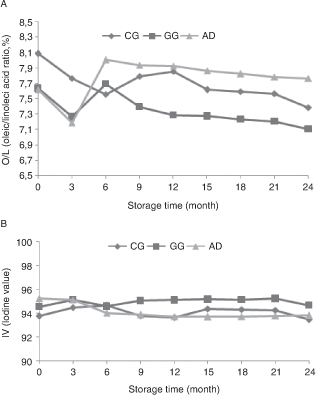 Figure 2. Effect of drying methods on oleic/linoleic acid (A) and iodine value (B) during 24 months storage at 20–25 °C and 70–90% relative humidity. Abbreviations: CG; concrete ground, GG; grass ground and AD; artificial drying. Results are reported as mean value
± standard deviation of three replicate analyses (n=3). Different letters in columns for each different drying method indicate significantly different values among storage times
(p < 0.001). Figure 2. Effect of drying methods on oleic/linoleic acid (A) and iodine value (B) during 24 months storage at 20–25 °C and 70–90% relative humidity. Abbreviations: CG; concrete ground, GG; grass ground and AD; artificial drying. Results are reported as mean value
± standard deviation of three replicate analyses (n=3). Different letters in columns for each different drying method indicate significantly different values among storage times
(p < 0.001).
|
|
Regarding iodine value (IV), it is known to be a measure of the unsaturation of oils and is expressed as the amount of absorbed iodine (Ajith et al., 2015; Belviso et al., 2017; Turan, 2018). In addition, a high IV value is considered to be the reason why the product is more susceptible and unstable against oil oxidation. On the other hand, it is known that IV is lower in hazelnuts with a low rate of unsaturated fatty acids. Özdemir et al., (2002) reported that the IV increased in parallel to the increase in drying temperature in Tombul cv (35–50 °C; 87.7–89.0, respectively). In our study, the effect of drying methods on IV was found to be significant (p ˂ 0.001; Figure 2B), and the highest value was found for AD (95.22) and the lowest value was found for the CG (93.75) method. In relation to storage period, a difference in IV was observed similar to the study carried out by Belviso et al., (2017). Namely, in the CG and AD methods, there was a general decrease together with a slight fluctuation during storage time (93.75–93.45;
95.22–93.81, respectively); while there was a slight increase in the GG method (94.53–94.65).
For free fatty acidity (FFA), the value is regarded as the first indicator of quality loss and is known as a deterioration indicator if FFA is above ≥1% (Turan and İslam, 2016), which means that 1% is the threshold value. Regarding drying, the FFA showed significant difference according to the drying method (p ˂ 0.001; Table 4), and the highest value was recorded for CG (0.12%, oleic acid) and the lowest value was recorded for the AD (0.06%, oleic acid) method (p ˂ 0.001; Table 4). Similar results were found by Fu et al., (2016) and Qu et al., (2016), and it has been reported that fatty molecules in walnuts dried for long periods under sunlight secrete FFA, and therefore its value increases. However, Kashaninejad et al., (2003) reported that drying methods did not affect the FFA value in pistachios. During the storage period, FFA rose and were recorded between 0.06–0.64% and there was a similar change in other studies (Turan and İslam, 2016; Koç Güler et al., 2017). At the end of storage, the highest FFA was recorded for CG (0.64%, oleic acid), and it was an actual result which was below the threshold value (1%, oleic acid) for the deterioration of fats. Consequently, it was observed that Çakıldak cv stored in jute bags under ambient conditions could be preserved for 24 months in terms of FFA.
Concerning the rancimat value (RV), the effect of drying method was found to be significant (p ˂ 0.001; Table 4), and the highest value was recorded for AD (5.12 h), and the lowest values were recorded for the CG and GG (4.64–4.65 h, respectively) methods (p ˂ 0.001; Table 4). Similarly, Turan and İslam (2018) reported that they found lower RV in sun–drying, and therefore artificial drying methods should be preferred due to short drying time and high RV. In addition, the RV decreased as expected and as in other studies (Turan and İslam, 2016; Turan, 2017), and this decrease occurred between 5.12–2.66 h (p ˂ 0.001; Table 4). At the end of the 24 months of storage, the lowest value was found for CG (2.66 h) and the highest value for the GG (3.01 h) method.
Regarding peroxide value (PV), it is one of the substantial traits used by the hazelnut industry in crops to be stored (Ghirardello et al., 2013; Koç Güler et al., 2017), and it is considered to be the most important indicator of oil oxidation in walnuts (Fu et al., 2016). In our study, the effect of drying method on PV was found to be significant (p ˂ 0.001; Table 4), and the lowest values were recorded for AD and the highest values were recorded for the CG and GG methods. For the storage period, the PV showed an increase with general fluctuation (p ˂ 0.001, Table 4), and this change was in the direction of decreasing after reaching a maximum value as in similar studies (Koç Güler et al., 2017; Turan, 2017; Belviso et al., 2017). It is known that this is due to the conversion of PV into secondary oxidation products during storage (Turan, 2017). However, it was observed that PV increased throughout the storage period in other studies (Ghirardello et al., 2013; Raisi et al., 2015). These differences may be due to the interaction of one or more of several factors such as variety, drying method and storage conditions. In our wok, PV showed a remarkable increase at the 21st month and this value was the highest in CG (0.85–2.93 meqO2·kg–1), and the lowest in the AD (0.77–1.38 meqO2·kg–1) method. Moreover, at the end of the 24 months of storage period, the highest PV value was recorded for GG (3.85 meqO2·kg–1) and the lowest was recorded for the AD (1.45 meqO2·kg–1) method.
In conclusion, our data suggest that fatty acid profile and oil oxidation varied depending on drying conditions. In general, decreases in RV and increases in FFA, PV and IV values and corresponding decreases in O/L values were recorded. Moreover,
PV and IV indexes were highlighted as primary oxidation besides the fact that the number of degree of unsaturation of the oils changes proportionally due to the presence of much higher contents of oleic acid (Belviso et al., 2017). These results were supported by previous findings that drying conditions significantly impacted the chemical reactions of hazelnuts (Turan, 2017; Wang et al., 2018).
4. CONCLUSIONSTOP
To the best of our knowledge, this is the first study on the effect of sun drying and artificial drying methods on fatty acid composition, sum of fatty acids and oil oxidation of the Çakıldak cv during long–term storage. The study reported that CG,
GG and AD had different effects on the fatty acid composition, sum of fatty acids and oil oxidation of the Çakıldak cv, throughout the storage period. Again, hazelnut samples from the AD method showed the lowest oxidation values, such as, FFA and PV, followed by the samples subjected to SD. In addition, the AD method had much more SFA, MUFA and RV than those dried by sun drying. Overall, based on this study, the recommended drying method for hazelnut drying is AD.
ACKNOWLEDGMENTSTOP
This study was supported by The Altaş Oil Industry Inc (Ordu, Turkey) and Gürsoy Tarımsal Ürünler Gıda sanayi A.Ş. (Ordu,
Turkey). The author wishes to thank Assist Prof Fatih ÖNER for the statistical analysis.
REFERENCESTOP
| ○ |
Ajith S, Pramod S, Kumari CP, Potty VP. 2015. Effect of storage temperatures and humidity on proximate composition, peroxide value and iodine of raw cashew nuts. J. Food Sci. Technol. 52, 4631–4636. |
| ○ |
Alaşalvar C, Pelvan E, Topal B. 2010. Effect of roasting oil and fatty acid composition of Turkish hazelnut varieties (Corylus avellana L.). Int. J. Food Sci. Nutr. 61, 630–642. https://doi.org/10.3109/09637481003691820
|
| ○ |
Amaral JS, Casal S, Citová I, Santos A, Seabra RM, Oliveira BPP. 2006. Characterization of several hazelnut (Corylus avellana L.) cultivars based in chemical, fatty acid and sterol composition. Eur. Food Res. Technol. 222, 274–280. https://doi.org/10.1007/s00217-005-0068-0
|
| ○ |
AOAC. 1990a. Official Methods and Recommended Practices of the American Oil. Chemist’s Society, 5th ed. American Oil Chemist
Society, USA
|
| ○ |
AOAC. 1990b. Oils and Fats, 15th ed. Official Methods of Analysis of the Association of Official Analytical Chemists, Washington
DC USA pp, 485–518
|
| ○ |
AOAC. 2000. Official Methods of Analysis of AOAC International 17th ed. 40, 1–3
|
| ○ |
Belviso S, Bell BD, Giacosa S, Bertolino M, Ghirardello D, Giordano M, Rolle L, Gerbi V, Zeppa G. 2017. Chemical, mechanical and sensory monitoring of hot air and infrared roasted hazelnuts (Corylus avellana L.) during nine months of storage. Food Chem. 217, 398–408. https://doi.org/10.1016/j.foodchem.2016.08.103
|
| ○ |
Delgado T, Pereira JA, Ramalhosa E, Casal S. 2016. Effect of hot air convective drying on the fatty acid and vitamin E composition of chestnut (Castanea sativa Mill.) slices. Eur. Food Res. Technol. 242, 1299–1306. https://doi.org/10.1007/s00217-015-2633-5
|
| ○ |
Delgado T, Pereira JA, Ramalhosa E, Casal S. 2017. Comparison of different drying methods on the chemical and sensory properties of chestnut (Castanea sativa M.) slices. Eur. Food Res. Technol. 243, 1957–1971. https://doi.org/10.1007/s00217-017-2902-6
|
| ○ |
Ficarra A, Lo Fiego DP, Minelli G, Antonelli A. 2010. Ultra fast analysis of subcutaneous pork fat. Food Chem. 121, 809–814. https://doi.org/10.1016/j.foodchem.2010.01.003
|
| ○ |
Fu M, Qu Q, Yang X, Zhang X. 2016. Effect of intermittent oven drying on lipid oxidation, fatty acids composition and antioxidant activities of walnut. LWT–Food Science and Technol. 65, 1126-1132. https://doi.org/10.1016/j.lwt.2015.10.002
|
| ○ |
Ghirardello D, Contessa C, Valentini N, Zeppa G, Rolle R, Gerbi V, Botta R. 2013. Effect of storage condition on chemical and physical characteristics of hazelnut (Corylus avellana L.). Postharvest Biology and Technol. 81, 37–43. https://doi.org/10.1016/j.postharvbio.2013.02.014
|
| ○ |
Janowicz M, Lenart A. 2018. The impact of high pressure and drying processing on internal scructure and quality of fruit. Eur. Food Res. Technol. 244, 1329–1340. https://doi.org/10.1007/s00217-018-3047-y
|
| ○ |
Juhaimi FA, Özcan MM, Uslu N, Ghafoor K. 2018. The effect of drying temperatures on antioxidant activity, phenolic compounds, fatty acid composition and tocopherol contents in citrus and oils. Eur. Food Res. Technol. 55, 190–197. https://doi.org/10.1007/s13197-017-2895-y
|
| ○ |
Kashaninejad M, Tabil LG, Mortazavi A, Safeordi A. 2003. Effect of drying methods on quality of pistachio nuts. Drying Technol. 21, 821–838. https://doi.org/10.1081/DRT-120021688
|
| ○ |
Kermani AM, Khashehchi M, Kouravand S, Sadeghi A. 2017. Effect of intermittent microwave drying on quality characteristics of pistachio nuts. Drying Technol. 35, 1108–1116. https://doi.org/10.1080/07373937.2016.1232270
|
| ○ |
Koç Güler S, Bostan SZ, Con AZ. 2017. Effects of gamma irradiation on chemical and sensory characteristics of natural hazelnut kernels. Postharvest Biol. Technol. 123, 12–21. https://doi.org/10.1016/j.postharvbio.2016.08.007
|
| ○ |
Koyuncu MA, İslam A, Küçük M. 2005. Fat and fatty acid composition of hazelnut kernels in vacuum packages during storage. Grasas Aceites 56, 263–266. https://doi.org/10.3989/gya.2005.v56.i4.91
|
| ○ |
Özdemir M, Yıldız M, Gürcan TŞ. 2002. Effect of artificial trying air temperature on stability of the major Turkish hazelnut variety Tombul. Gıda. 27, 35–39
|
| ○ |
Özilgen S, 2014. Cooking as a Chemical Reaction: Culinary Science with experiments. CRC Press, USA. |
| ○ |
Qu Q, Yang X, Fu M, Chen Q, Zhang X, He Z, Qiao X. 2016. Effects of three conventional drying methods on the lipid oxidation, fatty acids composition, and antioxidant activities of walnut (Juglans regia L.). Drying Technol. 34, 822–829. https://doi.org/10.1080/07373937.2015.1081931
|
| ○ |
Raisi M, Ghorbani M, Mahoonak AS, Kashani Nejad M. 2015. Effect of storage atmosphere and temperature on the oxidative stability of almond kernels during long-term storage. J. Stored Prod. Res. 62, 16–21. |
| ○ |
Turan A, İslam A. 2016. Çakıldak fındık çeşidinde kurutma ortamları ve muhafaza süresine bağlı olarak meydana gelen değişimler. Ordu Univ. J. Sci. Technol. 6, 272–285. |
| ○ |
Turan A. 2017. Effect of drying methods on nut quality and storage of hazelnut. Ph. D. Thesis, Ordu.
|
| ○ |
Turan A, İslam A. 2018. Effect of drying methods on some chemical characteristics of hazelnuts (Corylus avellana L.) during storage. J. Inst. Sci. Technol. 8, 11–19. https://doi.org/10.21597/jist.458541
|
| ○ |
Turan A. 2018. Effect of drying methods on fatty acid profile and oil oxidation of Hazelnut oil during storage. Eur. Food Res. Technol. 244, 2181–2190. https://doi.org/10.1007/s00217-018-3128-y
|
| ○ |
Tüfekçi F, Karataş Ş. 2018. Determination of geographical origin Turkish hazelnuts according to fatty acid composition. Food Sci. Nutr. 6, 557–562. https://doi.org/10.1002/fsn3.595
|
| ○ |
Velasco J, Anderson ML, Skibsted LH. 2004. Evaluation of oxidative stability of vegetable oils by monitoring the tendency to radical formation. A comparison of electron spins resonance spectroscopy with the rancimat method and differential scanning calorimetry. Food Chem. 85, 623–632. https://doi.org/10.1016/j.foodchem.2003.07.020
|
| ○ |
WAA. 2004. Operating Manual Novasina. AW Sprint TH 500 Water Activity Analyzers.
|
| ○ |
Wang W, Jung J, McGorrin RJ, Traber MG, Leonard GC, Zhao Y. 2018. Investigation of drying conditions on bioactive compounds, lipid oxidation, and enzyme activity of Oregon hazelnuts (Corylus avellanaL.). LWT–Food Science and Technology 90, 526–534. https://doi.org/10.1016/j.lwt.2018.01.002
|