Fatty acid and lipophilic vitamin composition of seaweeds from Antalya and Çanakkale (Turkey)
F. Cafa,*, N. Şen Özdemira, Ö. Yılmazb, F. Durucanc and İ. Akd
aTechnical Science Vocational High School, Bingol University, 12000 Bingol, Turkey.
bDepartment of Biology, Faculty of Sciences, Fırat University, 23119 Elazığ, Turkey.
cIşıklar Caddesi No 16, 17 TR-07100 Antalya, Turkey.
dMarine Sciences and Technology Faculty, Çanakkale Onsekiz Mart University, 17100, Çanakkale, Turkey.
*Corresponding author: fcaf@bingol.edu.tr
| |
SUMMARY
The lipophilic vitamin and fatty acid profiles were determined in five edible seaweeds: Corallina elongata J. Ellis & Solander, 1786; Cystoseira barbata (Stackhouse) C. Agardh, 1820; Jania rubens (Linnaeus) J.V. Lamouroux, 1816; Laurencia obtusa (Hudson) J.V. Lamouroux, 1813 and Sargassum vulgare C. Agardh, 1820. Saturated fatty acids (SFAs) were the major fatty acid group, and16:0 formed the highest SFA content (34–40%). 16:0 was higher in the brown seaweeds (C. barbata, 40.55%; S. vulgare, 37.11%) than in the red seaweeds (C. elongata, 36.5%; L. obtusa, 34.57%; J. rubens, 34.22%). The other major fatty acids in the seaweeds were 18:1n-9 and 16:1n-7 from MUFA in the analyzed species. In addition, EPA was found in significant levels in the red seaweeds, whereas DHA was not detected in the analyzed species. The findings showed that difference among species were not statistically significant (p = 0.09–0.11), yet differences between two families (Sargassaceae and Corallinaceae) were significant (p = 0.006) in the fatty acid profile (p < 0.01). Also, differences between the Corallinaceae and Rhomomelaceae families were partially significant (p = 0.011–0.013) (p < 0.01). K1 and K2 vitamins as well as δ-tocopherol, α-tocopherol and retinol acetate were determined to be present in the seaweed extracts. Finally, ergosterol, stigmasterol and ß-sitosterol were found in all samples in differing ratios per species.
|
| |
RESUMEN
Ácidos grasos y composición de vitaminas lipófilas de algas marinas de Antalya y Çanakkale (Turquía). El perfil de ácidos grasos y vitaminas lipófilas se determinó en cinco algas comestibles: Corallina elongata J. Ellis y Solander, 1786; Cystoseira barbata (Stackhouse) C. Agardh, 1820; Jania rubens (Linnaeus) J.V. Lamouroux, 1816; Laurencia obtusa (Hudson) J.V. Lamouroux, 1813; y Sargassum vulgare C. Agardh, 1820. Los ácidos grasos saturados (AGS) fueron el grupo principal de ácidos grasos, y el C16:0 fué el mayoritario de los AGS (34-40%). El ácido C16:0 fue más elevado en las algas pardas (C. barbata, 40.55%; S. vulgare, 37.11%) que en las algas rojas (C. elongata, 36.5%; L. obtusa, 34.57%; J. rubens, 34.22%). El resto de los ácidos grasos en las algas marinas de las especies analizadas, fueron los MUFA: C18:1n-9 and C16:1n-7. Además, el EPA se encontró en niveles significativos en las algas rojas, mientras que el DHA no se detectó en las especies analizadas. Los resultados mostraron que la diferencia entre las especies no es estadísticamente significativa ( p = 0.09–0.11), aunque las diferencias entre dos familias (Sargassaceae y Corallinaceae) fueron significativas ( p = 0.006) en el perfil de ácidos grasos ( p <0.01). Además, las diferencias entre las familias Corallinaceae y Rhomomelaceae fueron parcialmente significativas ( p = 0.011-0.013) ( p<0.01). Las vitaminas K1 y K2, así como δ-tocoferol, α-tocoferol y acetato de retinol se vió que estaban presentes en los extractos de algas marinas. Finalmente, se encontró ergosterol, estigmasterol y ß-sitosterol en todas las muestras en diferentes proporciones por especie.
|
1. INTRODUCTIONTOP
Seaweed is considered a good source of hydrosoluble vitamins, lipophilic vitamins and long-chain polyunsaturated fatty acids (LCPUFAs) such as omega-3 fatty acids (n-3), especially eicosa pentaenoic acid (EPA;C20:5 n-3) (Khotimchenko et al., 2002; Adharini et al., 2019). Therefore, traditionally seaweeds have been long used as a food source in many regions of the world and have potential as a functional food (Durucan and Turna, 2014).
Marine plants, expecially seaweed have antioxidant properties. Interest in these properties has increased among consumers and researchers (Farasat et al., 2013; Caf et al., 2015). Antioxidants can be of both synthetic and natural origin. Natural antioxidants contain mainly phenolic compounds. The utilization of natural antioxidants from plants generally does not produce negative effects, although some synthetic antioxidants have been found to induce genotoxic effects (Barlow, 1990). The biological effects of highly reactive oxygen species are controlled by a wide spectrum of antioxidant mechanisms (Yu, 1994). Flavonoids are an important group of plant metabolites and also represent the most important group of polyphenolic compounds. They have high chemical and biological activities, including antioxidant and free radical scavenging properties (Kahkonen et al., 1999). In addition, α-tocopherol (vitamin E) is one of the most important lipophilic vitamins because of its high antioxidant effect. In particular, it is effective for preventing lipid peroxidation (LPO) (Houston, 2005).
Furthermore, fatty acids are one of the most important molecules in aquatic ecosystems because of transference among different trophic levels (Filimonova et al., 2016). The main dietary sources of n-3 PUFAs for humans are fish. However, the sustainability of fish as a PUFA source is not certain due to decreasing fish stocks and increasing global demands. Worm et al., (2009) indicated that some fish populations are rapidly being depleted worldwide. Hence, new alternative sources of PUFAs must be found for food and feed applications (Vizetto-Duarte et al., 2015). The interest in the lipid composition of seaweeds has gradually increased because seaweeds contain a high level of PUFAs, especially alpha-linolenic (ALA, 18:3 n-3) arachidonic acid (ARA, 20:4 n-6) and EPA (Dawczynski et al., 2007). In fish, n-3 LCPUFA supplies mainly depend on the primary producers in the marine seafood chain and their supply to fish’s diets (Ivanova et al., 2013a). Producers synthesize LC PUFA from ALA and linoleic acid through desaturation and elongation of the contained fatty acids (Strobel et al., 2012).
Therefore, seaweeds may be a new alternative source of PUFAs for the food industry. Turkey is one of the countries with the highest potential for seaweed production. However, information about the biochemical contents of Turkish seaweeds is limited. Therefore, the aim of this study was to determine the lipophilic vitamin and fatty acid contents in several edible seaweeds in Turkey.
2. MATERIAL AND METHODSTOP
Four seaweeds (C. elongata, J. rubens, L. obtusa and S. vulgare) were collected in April, 2014 from Lara (Antalya, Turkey), and C. barbata was collected in May, 2012 from Kepez (Çanakkale, Turkey). The epiphytes, epizoons, sediment particles and additional organic matter in the seaweeds were removed using sea water. Cleaned seaweed samples were kept in the freezer (–80 °C) until analysis.
2.1. Lipid extraction and fatty acid analysesTOP
According to Hara and Radin (1978), lipids were extracted using a hexane/isopropanol mixture (3:2 v/v). Briefly, the mixture was centrifuged at 6000 rpm for 10 min, and the supernatant was taken from the samples. Then, the supernatant was placed in sample tubes and added with 2% H2SO4 (in methanol). The mixture was heated to 55 °C for 12 h in the oven. It was then cooled to room temperature (25 °C), and 5% NaCl was added. Hexane was used for the fatty acid methyl esters (FAMEs) (Christie, 1990). A 2% KHCO3 solution was then added to the mixture. The samples were dried under a N2 stream. The products were then extracted into hexane and stored at -20 °C for FAME analysis. The FAMEs were dissolved in 1 mL hexane and transferred to autosampler vials for GC analysis.
The FAMEs were analyzed using gas chromatography (GS) (Shimadzu, GC-17, Ver. 3). The total duration of the GC analysis was 35 min. A Machery-Nagel (Germany) capillary column with a length of 25 m, an inner diameter of 0.25 μm, and a thickness of 25 micron film was used. The column temperature was maintained at 120–220 °C, and the injection temperature was 240 °C. The detector temperature was held at 280 °C. The column temperature was adjusted to 120–220 °C, and the temperature was increased by 5 °C/min until reaching 200 °C and then increased by 4 °C/min until reaching 220 °C. The final temperature was held at 220 °C for 8 min. N2 was used as carrier gas. Peaks were identified using retention times from standards purchased from Supelco:37 component FAME mix.
2.2. Analysis of lipophilic vitamins (A, D, E, K) and sterolsTOP
The samples were homogenized with a 3:2 hexane:isopropanol solution (v/v), and 5% KOH was added to the supernatant. Then, the samples were heated for 15 min in the oven at 85 °C. Phytosterol extraction was performed using 10 mL hexane, which was evaporated under N2. The samples were dissolved in 1 mL asetonitril/metanol mixture (50% + 50%, v/v) and transferred to autosampler vials for High-performance liquid chromatography (HPLC) (Shimadzu) analysis. HPLC was used for sterol analysis in conjunction with Class VP software (Shimadzu, Kyoto, Japan). A UV detector and a Supelcosil LC 18 column (Sigma, United States; 15×4.6 cm, 5 μm) were used. The column length was 15 m. A LC-10 ADVP (UV visible) pump was used in addition to a SPD-10AVP detector, CTO-10ASVP column oven, SIL-10ADVP autosampler and DGU-14A degasser unit (Shimadzu). Acetonitrile:methanol (60/40 v/v) was used for the mobile phase at aflow rate of 1 mL. The vitamin peaks were determined at different wavelengths (e.g. Vitamin E at 202 nm and Vitamin A at 326 nm) (Katsanidis and Addis, 1999). Values were expressed μg/g of dry weight.
2.3. Statistical analysisTOP
Three replicates were analyzed per sample. The results were given as mean ± standard error of the mean (SEM). The PRIMER-v7 software, which is often used for analyzing ecological data, was used to determine the fatty acid relationships among species. Additional multivariate statistics were applied, including analysis of similarities (ANOSIM), multivariate non-parametric analogue of univariate ANOVA tests, non-parametric multi-dimensional scaling (nMDS) and similarity of percentages analysis (SIMPER). These were used to identify the fatty acids that primarily discriminated the observed sample clusters. Additionally, a permutational multivariate analysis of variance (PERMANOVA) was used to analyze the average similarity between/within groups.
3. RESULTSTOP
3.1. Fatty acid profilesTOP
The fatty acids found in the seaweeds were C14:0, C16:0, C16:1, C18:0, C18:1n-9, C18:2n-6, C18:3n-3, ARA and EPA. The fatty acid content of each seaweed species ranged as follows: 47.42–57.13% saturated fatty acids (SFAs), 19.41–25.86% monounsaturated fatty acids (MUFAs), 18.13–29.03% PUFAs and 10.47–24.95% highly unsaturated fatty acids (HUFAs). The main fatty acid in the studied species was 16:0, followed by 16:1 and 18:1.
We implemented a multivariate approach using PRIMER 7 to investigate the relationships among fatty acids. PRIMER provides a determination of similarity between/within sample groups as well as graphic representations of data based on MDS analysis (Clarke and Warwick, 2001). MDS, ANOSIM, SIMPER and PERMANOVA are available in open source R package, vegan (Oksanen et al., 2013). R is a free software environment for statistical computing and graphics (Parrish et al., 2015). The samples plotted were factored by species (C. barbata, J. rubens, L. obsuta and S. vulgare), family (Corallinaceae, Rhomomelaceae and Sargassacea) and location (Çanakkale and Antalya). The samples in the MDS plot were identified by species. Figure 1 shows the two-dimensional representation of the MDS plot analysis of a resemblance matrix of fatty acid data. MDS was used to determine spatial differences among the species in fatty acids. The degree to which the two-dimensional configuration plot disrupts the sample relationship is known as “stress.” Our stress value was 0.01; values below 0.05 were defined by Clarke and Warwick (2001) to have “excellent representation”. In addition, Figure 1 shows the importance of 16:0, 18:1 n-9, 20:3 n-6 and 18:2 n-6c in C. barbata. Thirteen fatty acids were identified in the samples (n = 3) by the multivariate analyses. The lower triangular matrix was created using Bray-Curtis similarity coefficients (cut-off level for low contributions: 70%).
|
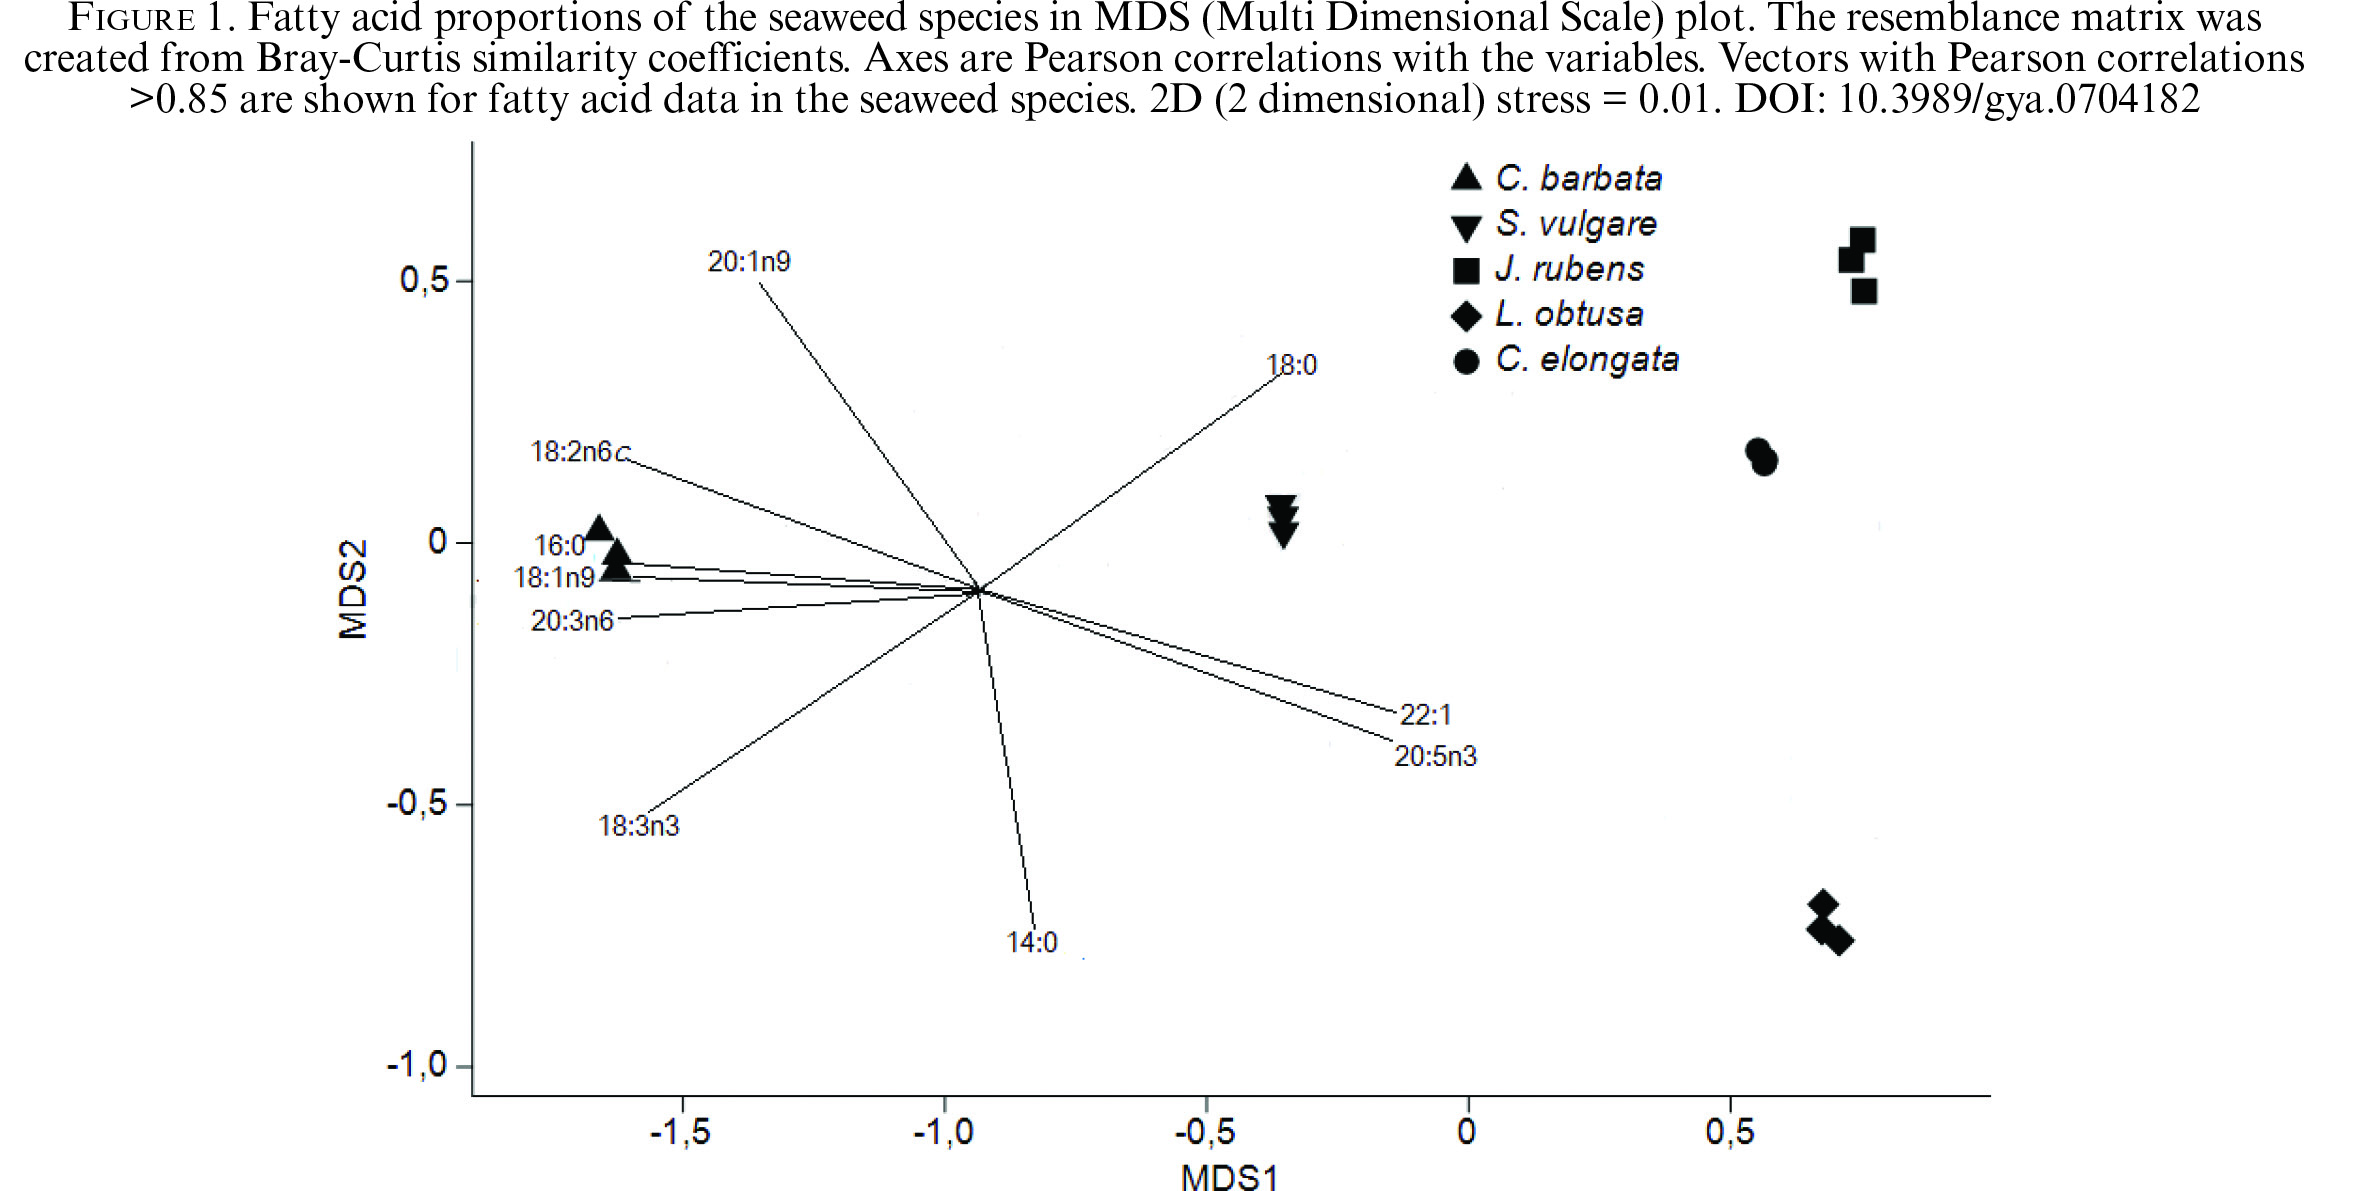 Figure 1. Fatty acid proportions of the seaweed species in MDS (Multi Dimensional Scale) plot. The resemblance matrix was created from Bray-Curtis similarity coefficients. Axes are Pearson correlations with the variables. Vectors with Pearson correlations >0.85 are shown for fatty acid data in the seaweed species. 2D (2 dimensional) stress = 0.01. Figure 1. Fatty acid proportions of the seaweed species in MDS (Multi Dimensional Scale) plot. The resemblance matrix was created from Bray-Curtis similarity coefficients. Axes are Pearson correlations with the variables. Vectors with Pearson correlations >0.85 are shown for fatty acid data in the seaweed species. 2D (2 dimensional) stress = 0.01.
|
|
One-way SIMPER analysis showed the average similarity of fatty acids based on location, species and family. 16:0 was the main contributor in all species, varying from 35–42% (extreme values correspond with C. barbata and J. rubens, respectively).
Table 2 shows the average similarities found in pairwise tests between/within species using one-way analysis. The PERMANOVA + add-on to PRIMER v7 was used to highlight significant differences in dispersion among the groups. Significant differences (p < 0.01) in pairwise comparisons were not found among species (p = 0.09–0.11). However, a significant difference was found between the location groups (p = 0.003) (p < 0.01). With respect to family, Sargassaceae and Corallinaceae have significant differences, whereas partial differences were found among the other families (p = 0.011–0.013) (p < 0.01). Table 2 was generated from the same add-on. These data correspond with the data of the SIMPER analysis. The degrees of similarity were the same because the SIMPER and ANOSIM R values were the same (R = 1) among all the species. The highest similarity was found between C. elongata and J. rubens (92.2%), and the lowest similarity was found between J. rubens and C. barbata (75.6%). Within species, S. vulgare had the highest similarity (98.2%). Among families, Sargassaceae and Corallinaceae as well as Sargassaceae and Rhomomelaceae were more similar (R < 0.83) than Corallinaceae and Rhomomelaceae (R = 1).
Table 1. Fatty acid contents of different seaweed species (% total defined FAME) (n = 3)
| Fatty Acids (%) |
C. barbata (mean ± SD)
|
S. vulgare (mean ± SD)
|
J. rubens (mean ± SD)
|
L. obtusa (mean ± SD)
|
C. elongata (mean ± SD)
|
| C14:0 |
4.31±0.26 |
4.53±0.31 |
3.53±0.36 |
5.3±0.12 |
4.58±0.43 |
| C16:0 |
40.55±0.48 |
37.11±0.15 |
34.22±0.59 |
34.57±0.50 |
36.5±0.58 |
| C16:1n-7
|
11.12±0.40 |
12.50±0.48 |
8.33±0.61 |
11.41±0.10 |
8.72±0.51 |
| C18:0 |
2.56±0.08 |
15.48±0.64 |
17.26±0.32 |
8.55±0.43 |
13.81±0.35 |
| C18:1n-9
|
13.27±0.45 |
11.29±0.18 |
8.38±0.56 |
8.60±0.39 |
9.03±0.63 |
| C18:2n-6c
|
9.42±0.30 |
4.08±0.17 |
4.57±0.30 |
2.39±0.32 |
4.35±0.24 |
| C18:3n-3
|
3.45±0.21 |
2.20±0.25 |
nd |
1.67±0.11 |
nd |
| C20:5n-3 (EPA)
|
3.36±0.41 |
2.19±0.21 |
9.0±0.50 |
15.09±0.19 |
11.74±0.63 |
| C20:1n-9
|
1.46±0.13 |
0.94±0.09 |
1.10±0.12 |
nd |
1.37±0.27 |
| C20:3n-6
|
1.29±0.34 |
nd |
nd |
nd |
nd |
| C20:4n-6
|
4.40±0.49 |
5.77±0.28 |
4.36±0.37 |
6.44±0.46 |
5.25±0.27 |
| C22:1 |
nd |
nd |
1.6±0.10 |
2.52±0.23 |
1.28±0.32 |
| C22:2 |
4.76±0.61 |
2.50±0.39 |
6.15±0.26 |
3.41±0.13 |
3.33±0.16 |
| SFA |
47.42±0.34 |
57.13±0.51 |
55.01±0.51 |
48.42±0.48 |
54.90±0.22 |
| MUFA |
25.86±0.39 |
24.73±0.42 |
19.41±0.21 |
22.55±0.62 |
20.41±0.47 |
| PUFA |
26.71±0.52 |
18.13±0.21 |
25.57±0.31 |
29.03±0.70 |
24.68±0.44 |
| HUFA |
13.83±0.96 |
10.47±0.64 |
19.51±0.18 |
24.95±0.52 |
20.33±0.42 |
| PUFA/SFA |
0.56±0.01 |
0.31±0.01 |
0.46±0.01 |
0.6±0.02 |
0.45±0.01 |
| nd: not detected, SD: Standart Deviation, EPA: Eicosapentaenoic Acid, SFA: Saturated Fatty Acid, MUFA: Monounsaturated Fatty Acid, PUFA: Polyunsaturated Fatty Acid, HUFA: High Unsaturated Fatty Acids |
Table 2. SIMPER and ANOSIM R values in fatty acid proportions of the seaweed species (C. barbata, S. vulgare, J. rubens, L. obtusa) samples. R statistics are for pairwise tests with C. barbata; Significance level of sample statistic 0.1 %
| Average similarity between/within groups (%) |
| |
C. barbata |
S. vulgare |
J. rubens |
L. obtusa |
C. elongata |
C. barbata |
| C. barbata |
97.5 |
|
|
|
|
|
| S. vulgare |
83.3 |
98.2 |
|
|
|
1 |
| J. rubens |
75.6 |
85.2 |
96.5 |
|
|
1 |
| L. obtusa |
76.3 |
82.8 |
83.8 |
95.9 |
|
1 |
| C. elongata |
77.8 |
88.0 |
92.2 |
88.7 |
98.1 |
1 |
Table 2 shows the SIMPER and ANOSIM R values for the fatty acid proportions of seaweed species (C. barbata, S. vulgare, J. rubens and L. obtusa). The R statistics correspond to pairwise tests with C. barbata. The significance level of the sample statistic was 0.1%.
3.2. Lipophilic vitamin and phytosterol contentsTOP
Table 3 shows the lipophilic vitamin and phytosterol contents of the seaweed species. K1 and K2 vitamins, δ-tocopherol, α-tocopherol and retinol acetate were present in the seaweed extracts. Ergosterol, stigmasterol and ß-sitosterol were found in all samples although in different ratios per species.
Table 3. Lipophilic vitamin and phytosterol content of the seaweed species (μg/g) (n = 3)
| ADEK vitamins and phytosterols |
C. barbata (mean ± SD)
|
S. vulgare (mean ± SD)
|
J. rubens (mean ± SD)
|
L. obtusa (mean ± SD)
|
C. elongata (mean ± SD)
|
| Vitamin K1 |
nd |
2.32±0.15 |
nd |
0.73±0.10 |
6.35±0.45 |
| Vitamin K2 |
0.82±0.1 |
0.8±0.1 |
0.25±0.05 |
0.8±0.08 |
0.25±0.05 |
| δ- tocopherol |
1.00±0.10 |
0.54±0.08 |
0.35±0.05 |
0.85±0.05 |
0.04±0.007 |
| α- tocopherol |
4.40±0.37 |
15.45±1.01 |
15.17±1.00 |
20.46±0.77 |
1.65±0.15 |
| Ergosterol |
75.05±1.63 |
0.004±0.0007 |
12.68±0.4 |
137±1.41 |
0.00±0.00 |
| Stigmasterol |
0.74±0.08 |
0.004±0.0005 |
0.004±0.0005 |
0.023±0.015 |
43.23±0.75 |
| ß-sitosterol |
0.82±0.14 |
58.57±1.22 |
4.43±0.19 |
8.16±0.24 |
6.1±0.27 |
| Retinol acetate |
0.003±0.001 |
0.005±0.001 |
0.043±0.005 |
0.15±0.05 |
0.12±0.02 |
| nd: not dedected, SD: Standard Deviation |
In Table 3, the lipophilic vitamin and phytosterol contents of the seaweed species (μg/g) are presented.
4. DISCUSSIONTOP
The predominant fatty acids in five seaweed species (C. barbata, C. elongata, J. rubens, L. obtusa and S. vulgare) were studied. The 16:0 fatty acid was detected in C. barbata at 40.55%, in C. elongata at 36.5%, in J. rubens at 34.22%, in L. obtusa at 34.57% and in S. vulgare at 37.11%. 18:1n-9 and 16:1n-7 were the most abundant MUFAs in the analyzed species. A study by Gressler et al., (2010), showed that 16:0 was the most predominant fatty acid in seaweed. Our findings showed that total PUFA contents were higher than total MUFA contents in the seaweed species, except for S. vulgare. We found that PUFAs were the highest in L. obtusa from Rhodophyta whereas it was the lowest in S. vulgare from Phaeophyta. PUFA content was higher in C. barbata (26.71%) taken from Çanakkale than S. vulgare (18.13%) taken from Antalya station. This difference can be related to location, seasonal differences etc. Frikha et al., (2011) and Vizetto-Duarte et al., (2015) reported that 16:1n-7 and 18:1n-9 were the main MUFAs in C. barbata. Our results are in accordance with the literature. Moreover, diets rich in MUFAs were found to decrease the total and low-density lipoprotein (LDL) cholesterol levels in plasma (Degirolamo and Lawrence, 2011).
All seaweeds also contained 18:2n-6. LA was most abundant in C. barbata compared to the other seaweeds. Regional differences may cause high 18:2n-6 in C. barbata, which was collected from Çanakkale, whereas the other seaweeds were collected from Antalya. Multivariate analysis showed differences among the locations (p = 0.003) (p < 0.01). The biochemical composition of seaweeds is directly related to season and location (Renaud and Luong-Van, 2006). Also, fatty acid content can depend on environmental and genetic differences (Nelson et al., 2002). Notably, 18:3n-3 was found in all brown seaweeds; in red seaweeds, 18:3n-3 was found in C. elongata and J. rubens. The eicosanoid precursors ARA and EPA were also detected in all species. EPA was found in significant levels in the red seaweeds, and ARA was found at similar levels in the red and brown seaweeds. In addition, HUFA was higher in red seaweeds than in brown seaweeds (Table1). Simiarly, we encountered significant differences between Sargassaceae (brown seaweed) and Corallinaceae (red seaweed) (p = 0.006) (p < 0.01) and partial differences between Sargassaceae (brown seaweed) and Rhomelaceae (red seaweed) (p = 0.013) (p < 0.01) according to multivariate analysis. However, no differences among the seaweed species as a whole were found (p = 0.09–0.11) (p < 0.01).
Several studies indicated the presence of a reverse correlation between the PUFA:SFA ratios and cardiovascular diseases. Greater concentrations of PUFA relative to SFA in the human diet were found to decrease problems associated with cardiovascular diseases (Simopolous, 2000; Erkkila et al., 2008). Therefore, the PUFA:SFA ratio was an important parameter in our study. Also, the British Department of Health suggested that the average ratio of PUFA:SFA should be 0.45 or higher. In this study, the PUFA:SFA ratio of the seaweeds was determined to range from 0.31–0.60 (extreme values corresponding with S. vulgare and L. obtusa, respectively), and all analyzed species demonstrated a favorable PUFA: SFA ratio except for S. vulgare (Table 1).
Dawczynski et al., (2007) reported that HUFA synthesis pathways have not been studied in seaweeds to date. Seaweeds can produce high levels of ARA and EPA but generally have low levels of or completely lack DHA (C22:6 n-3, Docosahexaenoic acid). EPA and DHA are major components of membranes. EPA and DHA are basically derived from ALA by elongation and desaturation reactions (Narayan et al., 2006). They are also necessary precursors to bioactive compounds such as eicosanoids (Lee and Hirota, 1973). In the present study, DHA was not present in the analyzed species; in different phaeophytes, DHA is generally absent or exists at low levels (Li et al., 2002). Meanwhile, red and brown seaweeds usually have a high content of fatty acids with 20 carbons such as EPA and ARA (Banerjee et al., 2009). We observed that PUFAs had the highest relative concentration in the red seaweeds, and EPA ranged from 9–15.09% of the total determined fatty acid content.
We also evaluated the lipophilic vitamin content of the five seaweed species. The results clearly indicated that all tested seaweeds possessed vitamins. Specifically, α-tocopherol, δ-tocopherol, vitamin K1, vitamin K2, stigmasterol, ß-sitosterol and ergosterol were detected. Seaweeds were previously found to be a significant source of vitamins (Sanchez-Machado et al., 2004). In this study, α-tocopherol was the most important lipophilic vitamin, ranging from 1.65 to 20.46 μg/g. d.w. in L. obtusa, which contained the highest content. We determined that α-tocopherol was generally low in C. barbata (4.40 μg/g). Similarly, Panayotova et al., (2013a) and Panayotova et al., (2013b) reported that C. barbata had high amounts of α-tocopherol (15.77 ± 0.21 mg/g, 29.13 mg/g; respectively). In addition, Durmaz et al., (2008) found that Cystoseira spp. had an α-tocopherol content of 17.10 μg/g in the Black Sea of Turkey. The vitamin composition of seaweed is affected by species, algal growth level, geographical region, salinity, season and temperature (Škrovánková, 2011); yet, overall, α-tocopherol is the most abundant lipophilic vitamin in seaweeds (Škrovánková, 2011). In the present study, α-tocopherol content was found to be higher than δ-tocopherol content. The α-form has a higher antioxidant effect than other forms (Yamamoto et al., 2001). Also, α-tocopherol is associated with decreased blood pressure and the prevention of lipid peroxidation in biological systems, which is its main function (Houston, 2005).
Finally, we examined sterols, which are one of the main components of lipid classes phytosterols (C28 and C29 sterols) are essential for the synthesis of some vitamins. For instance, ergosterol is necessary for the synthesis of vitamin D2 and cortisone (Ibañez et al., 2011). We observed that ergosterol was the main sterol in L. obtusa (137±1.41 μg/g). β-sitosterol was the main sterol in S. vulgare, and stigmasterol was the main sterol in C. elongata (43.23 μg/g) (see Table 3).
5. CONCLUSIONTOP
Important bioactive molecules from marine resources can be used in many fields, including the drug, cosmetic and food industries, as they have been found to have positive effects on human health (Hamed et al., 2015). Our findings showed that seaweeds can be used in different industries because of their biochemical contents. In particular, the high PUFA content of seaweeds has increased their importance in the food industry. PUFA concentration was high, especially C20, ARA and EPA in the studied species. However, they did not contain DHA. C. barbata, S. vulgare from Phaeophyta presented the lowest contents of EPA (> 2%) whereas J. rubens, L. obtusa and C. elongata from Rhodophyta presented the highest contents of EPA (> 9%). These contents vary according to different factors, such as species, location and family. In addition, α-tocopherol had the highest amount within lipophilic vitamins. These species can use instead of synthetic antioxidants because of their high antioxidant effect.
Our results showed that species, family and location had an important effect on the biochemical contents of the studied seaweeds. Further research on different marine seaweed species is necessary, including the applications of seaweed species in the health and food industries in Turkey. The findings will be useful as a guide to further studies.
ACKNOWLEDGEMENTSTOP
This study was financially supported by Firat University, FUBAP (Firat University, Scientific Research Projects Unit) with the project no. FF.13.02.
REFERENCESTOP
| ○ |
Adharini RA, Suyono EA, Suadi, Jayanti AD, Setyawan AR. 2019. A comparison of nutritional values of Kappaphycus alvarezii, Kappaphycus striatum, and Kappaphycus spinosum from the farming sites in Gorontalo Province, Sulawesi, Indonesia. J. Appl. Psychol. 31, 725–730. https://doi.org/10.1007/s10811-018-1540-0 |
| ○ |
Barlow SM. 1990. Toxicological aspects of antioxidants used as food additives, In Hudson BJF (Ed.): Food Antioxidants 253-307. Barking, England: Elsevier Science Publishers Ltd.
|
| ○ |
Caf F, Yilmaz Ö, Durucan F, Şen Özdemir N. 2015. Biochemical components of three marine macroalgae (Padina pavonica, Ulva lactuca and Taonia atomaria) from the Levantine Sea Coast of Antalya, Turkey. JBES 6, 401-411.
|
| ○ |
Christie WW. 1992. Gas chromatography and lipids, a practical guide (3rd ed.) Ayr. The Oily Press. 320pp. |
| ○ |
Clarke KR, Warwick RM. 2001. Change in Marine Communities: An Approach to Statistical Analysis and Interpretation. 2nd Edition,
PRIMER-E, Ltd., Plymouth Marine Laboratory, Plymouth.
|
| ○ |
DawczynskiC, Schubert R, Jahreis G. 2007. Amino acids, fatty acids, and dietary fiber in edible seaweed products. Food Chem. 103, 891–899. https://doi.org/10.1016/j.foodchem.2006.09.041 |
| ○ |
Degirolamo C, Lawrence LR. 2010. Dietary Monounsaturated Fatty Acids Appear Not to Provide Cardioprotection. Curr. Atheroscler Rep. 12, 391-396. https://doi.org/10.1007/s11883-010-0133-4 |
| ○ |
Durmaz Y, Duyar H, Gokpinar S, Taskaya L, Ogretmen Y, Bandarra N, Nunes M. 2008. Fatty Acids, α-tocopherol and Total Pigment
Contents of Cystoseira spp., Ulva spp. and Zostera spp. from Sinop Bay (Turkey). IJNES 2, 111-114.
|
| ○ |
Durucan F, Turna II, 2014. Antalya İli Batı Kıyıları (Lara - Kalkan)’nın Ekonomik Amaçlı Deniz Algleri. SDU. J. Sci. 9, 1-11.
|
| ○ |
Erkkila A, Mello V de, Risirus U, Laaksonen D. 2008. Dietary fatty acids and cardiovascular disease: An epidemiological approach.
Prog. Lipid Res. 47, 172–187. https://doi.org/10.1016/j.plipres.2008.01.004 |
| ○ |
Farasat M, Khavari-Nejad RA, Nabavi SM, Namjooyan F. 2013. Antioxidant Properties of two Edible Green Seaweeds From Northern
Coasts of the Persian Gulf. Jundishapur J. Nat. Pharm. Prod. 8, 47-52.
|
| ○ |
Filimonova V, Goncalves F, Marques JC, De Trochc M, Goncalves AMM. 2016. Biochemical and toxicological effects of organic
(herbicide Primextra® Gold TZ) and inorganic (copper) compounds on zooplankton and phytoplankton species. Aquat. Toxicol. 177, 33–43.
|
| ○ |
Frikha F, Kammoun M, Hammami N, Mchirgui RA, Belbahri L, Gargouri Y, Miled N, Ben-Rebah F. 2011. Chemical composition and
some biological activities of marine algae collected in Tunisia. Cienc. Mar. 37, 113–124.
|
| ○ |
Gressler V, Yokoya N, Fujii M, Colepicolo P, Filho J, Torres R, Pinto E. 2010. Lipid, fatty acid, protein, amino acid and
ash contents in four Brazilian red algae species. Food Chem. 120, 585–590. https://doi.org/10.1016/j.foodchem.2009.10.028 |
| ○ |
Hamed I, Özogul F, Özogul Y, Regenstein JM. 2015. Marine Bioactive Compounds and Their Health Benefits. Compr. Rev. Food Sci. Food Saf. 14, 446–465. https://doi.org/10.1111/1541-4337.12136 |
| ○ |
Hara A, Radin NS. 1978. Lipid extraction of tissues with a low-toxicity solvent. Anal. Biochem. 90, 420-426. https://doi.org/10.1016/0003-2697(78)90046-5
|
| ○ |
Houston MC. 2005. Nutraceuticals, Vitamins, Antioxidants, and Minerals in the Prevention and Treatment of Hypertension. Prog. Cardiovasc. Dis. 47, 396-449. https://doi.org/10.1016/j.pcad.2005.01.004 |
| ○ |
Ibañez E, Herrero M, Mendiola JA, Castro-Puyana M. 2011. Extraction and characterization of bioactive compounds with health
benefits from marine resources: macro and micro algae, cyanobacteria, and invertebrates. In: Hayes M (Ed.) Marine bioactive compounds: sources, characterization 58–62. New York: Springer.
|
| ○ |
Ivanova V, Stancheva M, Petrova D. 2013. Fatty acid composition of black sea Ulva rigida and Cystoseira crinita. Bulg. J. Agric. Sci. 19, 42–47.
|
| ○ |
Kahkonen MP, Hopia AI, Vuorela HJ, Rauha JP, Pihlaja K, Kujala TS, Heinonen M. 1999. Antioxidant activity of plant extracts
containing phenolic compounds. J. Agric. Food Chem. 47, 3954-3962.
|
| ○ |
Katsanidis E, Addis PB. 1999. Novel HPLC analysis of tocopherols and cholesterol in tissue. Free Radic. Biol. Med. 27, 1137-1140. https://doi.org/10.1016/S0891-5849(99)00205-1 |
| ○ |
Lee RF, Hirota J. 1973. Wax esters in tropical zooplankton and nekton and geographical distribution of wax ester in marine
copepods. Limnol. Oceanogr. 18, 227-239. https://doi.org/10.4319/lo.1973.18.2.0227 |
| ○ |
Li X, Fan X, Han L, Lou Q. 2002. Fatty acids of some algae from the Bohai Sea. Phytochemistry 59, 157–161. https://doi.org/10.1016/S0031-9422(01)00437-X |
| ○ |
Menotti A, Kromhout D, Blackburn H, Fidanza F, Buzina R, Nissinen A. 1999. Food intake patterns and 25 year mortality from
coronary heart disease: cross-cultural correlations in the Seven Countries Study. The Seven Countries Study Research Group.
Eur. J. Epidemiol. 15, 507–515.
|
| ○ |
Mouritsen OG, Dawczynski C, Duelund L, Jahreis G, Vetter W, Schröder M. 2013. On the human consumption of the red seaweed
dulse (Palmaria palmataL.). Weber & Mohr. J. Appl. Physiol. 25, 527-534. https://doi.org/10.1007/s10811-013-0014-7 |
| ○ |
Narayan B, Miyashita K, Hosakawa M. 2006. Physiological efffects of eicosapentaenoic acid (EPA) and docosahexaenoic acid (DHA).
Food Rev. Int. 22, 291-307. https://doi.org/10.1080/87559120600694622 |
| ○ |
Nelson MM, Phleger CF, Nichols PD. 2002. Seasonal lipid composition in macroalgae of the northeastern Pacific Ocean. Bot. Marina 45, 58–65. https://doi.org/10.1515/BOT.2002.007 |
| ○ |
Oksanen J, Blanchet FG, Kindt R, Legendre P, Minchin PR, O’Hara RB, Simpson GL, Solymos P, Henry M, Stevens HH, Wagner H.
2013. Package ‘vegan’: Community Ecology Package. http://cran.r-project.org/web/packages/vegan/index.html |
| ○ |
Panayotova V, Stancheva M. 2013a. Fat soluble vitamins and fatty acids composition of black sea Cystoseira barbata, Cbu International Conference On Integration And Innovation In Science And Education, Prague. 362-367. (in Czech Republic).
|
| ○ |
Panayotova V, Stancheva M, Debreva D. 2013b. Alpha-tocopherol and ergocalciferol content of some macro algae from Bulgarian
Black Sea coast. Ovidus University Annals Chem. 24, 13-16.
|
| ○ |
Parrish CC, Nichols PD, Pethybridge H, Young JW. 2015. Direct determination of fatty acids in fish tissues: quantifying top
predator trophic connections. Ocealogia 177, 85-95. https://doi.org/10.1007/s00442-014-3131-3 |
| ○ |
Renaud SM, Luong-Van, JT. 2006. Seasonal variation in the chemical composition of tropical Australian marine macroalgae. J. Appl. Phycol. 18, 381-387. https://doi.org/10.1007/s10811-006-9034-x |
| ○ |
ˇSkrovánková S. 2011. Seaweed vitamins as neutraceuticals. In: Kim SW (ed) Advanced in Food and Nutrition Research. Elsevier,
Amsterdam, pp. 357–369.
|
| ○ |
Sánchez-Machado DI, López-Cervantes J, López-Hernández J, Paseiro-Losada P. 2004. Simultaneous determination of thiamine and
riboflavin in edible marine by high-performance liquid chromatography. J. Chromatogr. Sci. 42, 117–120. https://doi.org/10.1093/chromsci/42.3.117 |
| ○ |
Simopoulos A, Leaf A, Salem N. 2000. Workshop statement on the essentiality of and recommended dietary intakes for omega-6
and omega-3 fatty acids. Prostaglandins Leukot. Essent. Fatty Acids 63, 119–121. https://doi.org/10.1054/plef.2000.0176 |
| ○ |
Strobel C, Jahreis, G, Kuhnt K. 2012. Survey of n-3 and n-6 polyunsaturated fatty acids in fish and fish products. Lipids Health and Dis. 11, 144. https://doi.org/10.1186/1476-511X-11-144 |
| ○ |
Vizetto-Duarte C, Pereira H, Bruno de Sousa C, RauterAP, Albericio F, Custódio L, Barreira L, Varela J. 2015. Fatty acid profile
of different species of algae of the Cystoseira genus: a nutraceutical perspective. Nat. Prod. Res. 29, 1264-1270. https://doi.org/10.1080/14786419.2014.992343 |
| ○ |
Worm B, Hilborn R, Baum JK, Branch TA, Collie JS, Costello C, Fogarty MJ, Fulton EA, Hutchings JA, Jennings S, Jensen OP,
Lotze HK, Mace PM, McClanahan TR, Minto C, Palumbi SR, Parma AM, Ricard D, Rosenberg AA, Watson R, Zeller D. 2009. Rebuilding
Global Fisheries. Science 325, 578–585. https://doi.org/10.1126/science.1173146 |
| ○ |
Yamamoto Y, Fujisawa A, Hara A, Dunlap WC. 2001. An unusual vitamin E constituent (α-tocomonoenol) provides enhanced antioxidant
protection in marine organisms adapted to cold-water environments. Proc. Natl. Acad. Sci. 98, 13144-13148. https://doi.org/10.1073/pnas.241024298 |
| ○ |
Yu BP. 1994. Cellular defenses against damage from reactive oxygen species. Physiol. Rev. 74, 139–162.
|