Change in fatty acid composition and evaluation of lipids and protein oxidation in the commercial cooked clams (Ruditapes decussatus)
S. Bejaouia, *, I. Rabeha, F. Ghribia, F. Aouinia, I. Chetouia, K. Telahiguea, N. Soudania and M. El Cafsia
aUniversity of Tunis El Manar, Faculty of Sciences of Tunis, Biology Department, Ecology, Biology and Physiology of aquatic organisms’ laboratory, 2092, Tunis, Tunisia.
*Corresponding author: safa.BEJAOUI@fst.utm.tn
| |
SUMMARY
This study aimed to provide information about the changes in fatty acid composition and quality in Ruditapes decussatus tissue after four culinary treatments (steamed, baked, grilled and fried). All treated samples showed a significant decrease in moisture and protein. In contrast, a significant increase in fat content resulted from the grilled and fried treatments. Saturated fatty acid was significantly higher in fresh clams than all cooking processes, except in fried ones. Monounsaturated fatty acid and polyunsaturated fatty acid varied significantly between fresh and cooked clams with high values recorded for fried clams. The n-3/n-6 ratio, peroxide index, EPA+DHA and atherogenicity index decreased significantly after the cooking processes particularly in fried clams. The mineral levels (Mg, Ca and Mn) of cooked clams decreased considerably with grilled and fried treatments. The impacts of cooking on the fatty acid composition and protein content in clam tissue was evaluated by lipid peroxidation (TBARS, PV, FFA, TOR) and protein oxidation (AOPP and PCO), which varied statistically in fried, steamed, grilled and baked samples; indicating alterations in cooked clam tissues structure. Based on our results, steaming is recommended for the preparation of clams because it preserves the most nutritional tissue quality.
|
| |
RESUMEN
Cambios en la composición de los ácidos grasos y evaluación de la oxidación de lípidos y proteínas en almejas comerciales (Ruditapes decussatus) cocinadas. El presente estudio tuvo como objetivo proporcionar información innovadora sobre los cambios en la composición y calidad de los ácidos grasos presentes en el tejido de Ruditapes decussatus tras cuatro tratamientos culinarios distintos (vapor, horno, parrilla y fritura). Todas las muestras tratadas mostraron una disminución significativa en el contenido de humedad y proteínas. Por el contrario, los tratamientos a la parrilla y frito resultaron en un aumento significativo de la cantidad de grasa. El contenido en ácidos grasos saturados fue significativamente mayor en las almejas frescas comparado con todas las almejas cocinadas, a excepción de las fritas. Los ácidos grasos mono- y poliinsaturados variaron significativamente entre las almejas frescas y cocinadas, mostrando el valor más alto en las almejas fritas. La relación n-3/n-6, el índice de peróxidos, el contenido de EPA + DHA y el índice de aterogenicidad disminuyeron significativamente después de todos los procesos de cocción, especialmente en las almejas fritas. Los niveles de minerales (Mg, Ca y Mn) de las almejas cocinadas disminuyeron considerablemente tras los tratamientos a la parrilla y frito. El impacto del cocinado sobre la calidad de los ácidos grasos y las proteínas se evaluó mediante la medida de la peroxidación de lípidos (TBARS, PV, FFA, TOR) y la oxidación de proteínas (AOPP y PCO), valores que variaron significativamente en las muestras fritas, al vapor, a la parrilla y al horno, indicando una alteración de la estructura de los tejidos de la almeja cocinada. De acuerdo a los resultados obtenidos, se recomienda la cocción al vapor para la preparación de las almejas, ya que es el tratamiento que mejor preserva calidad nutricional de los tejidos.
|
1. INTRODUCTIONTOP
Seafood is considered as a very healthy food because it is a great source of protein, minerals, carbohydrates and fatty acids that are essential for human health (Ojea et al., 2004). Nowadays, the importance of diet supplementation with polyunsaturated (PUFA) omega-3 fatty acids such as eicosapentaenoic (EPA; 20:5n-3) and docosahexaenoic (DHA; 22:6n-3) by consuming seafood like fish, mollusks, and crustaceans is widely recognized (Neff et al., 2014; Costa et al., 2015a). Hence, foods with an appropriate content of these fatty acids contribute to the prevention and treatment of several diseases such as cardiovascular disease or depression (Pao-Yen et al., 2012; Ab Latif et al., 2015) and the maintenance of good health (El Reffaei et al., 2014). Within seafood, bivalves provide a great proportion of omega-3-fatty acids, protein content, vitamin B12, essential elements and a low amount of saturated fatty acids (Ghribi et al., 2017). Among bivalves, clams are widely used for human consumption in Mediterranean countries, especially the grooved carpet shell clam.
In Tunisia, Ruditapes decussatus are the only exploited bivalve species from a natural environment. The major part of its production is exported to the European Union (Amri et al., 2011). This species is native to Tunisian coasts and widely appreciated by consumers for its taste and low fat content (Ojea et al., 2004). However, data on the relation between food consumption and fitness are based only on raw food, without taking into account food processing.
Preparation procedures for culinary treatments cause many modifications to nutrient structures (Graci-Arisa et al., 2003). Temperature can cause several alterations, such as impoverishment of fatty acid quality and changes in the protein fractions due to the oxidation phenomena (Ansorena et al., 2010). Therefore, a reduction in the nutritional value of food has been observed. It is evident that long-chain polyunsaturated fatty acids (LC-PUFAs) are more vulnerable to deterioration during heating as compared to saturated fatty acids. The effects of frying, baking, grilling and boiling treatments on the nutritional quality of many fish species have been widely studied (Candela et al., 1997; Graci-Arisa et al., 2003).
Nevertheless, there are few data about the effects of culinary processes on the proximate composition and fatty acid profile of bivalve mollusks. The investigation of the nutritional quality of cooked shellfish is even more important than that of raw shellfish, especially if we consider that this type of seafood is a frequently diffused ingredient (in soup, pizza, pasta, etc.). Furthermore, in recent decades the culinary art of cooking shellfish has evolved with the introduction of new methods that are used both in ordinary or gourmet cuisine worldwide.
Therefore, the aim of this study was (i) to determine the effect of four cooking methods (baking, steaming, grilling and frying) on the biochemical composition and fatty acid profile of the shellfish R. decussatus from Tunisian coasts and (ii) to evaluate the lipid and protein degradation of clam tissue after cooking through a battery of biomarkers: peroxide value (PV), free fatty acid (FFA), thiobabituric acid (MDA), advanced oxidation protein product (AOPP) and protein carbonyls (PCO).
2. MATERIALS AND METHODSTOP
2.1. Sample preparation and cooking process TOP
A total of 150 natural commercial Mediterranean clams, R. decussatus (Length: 44.78 ± 3.56 mm; Weight: 13.25 ± 1.89 g) were obtained in March 2016 from Louza site (N35°0‘44.10” E11°0‘47.48’’), located in the Tunisian littoral. They were kept in a cooler containing local seawater with an aeration system and directly transported to the laboratory within 5 hours from collection. The specimens were cleaned by washing with distillated water several times to eliminate adhering sediments and waste. The clams were then dissected using scalpels in order to remove the soft tissue from the shells. The samples were divided into five groups of 30 clams. Within each group, the clams were further divided into 3 sets of 10 and each set was cooked individually. All the clams in the first group were uncooked (control), while the four others were cooked by various methods (frying, steaming, grilling and baking). For the frying treatment, about 250 ml of corn oil (the most commonly used oil in Tunisia) and a deep fryer (MOULINEX AF123111 UNO M, France) were used on an electrical heating unit for 5–6 min (pre-heating to 190 ºC). For steaming, the samples were positioned in a steamer (Buy Tefal VC101616 Steamer) and steamed for 3–5 min. Grilled clams were prepared on a griddle (S.E.C.-XH-4423, PRC) with the thermostat set at 98 °C. After the set temperature was attained, the clams were grilled for 10–15 min. The last group was baked in the oven (250 °C, 17 min). The cooking steps have been tried and standardized in pre-experiments ences, due to a lack of information about cooking processes of bivalve tissues.
2.2. Proximate compositionTOP
The proximate compositions of cooked and uncooked R. decussatus were determined in ten replicates for moisture, protein, meat yield and fat. The moisture content was determined gravimetrically according to Horwitz and Latimer (2005). Tissues were initially weighed then dried at 110 °C to constant weight and meat yield (MY) was determined according to Parisi et al., (2005). Water content was expressed as percentage of initial tissue mass. Protein was extracted by Tris-HCl buffer (pH 7.4) and centrifuged at 10.000 for 25 minutes. Then the obtained supernatant was used to determine protein contents using bovine serum albumin as standard according to Lowry et al., (1951). Total lipids were extracted following the method of Folch et al., (1957) using chloroform/methanol (2:1 v/v) solvent containing 0.01% butylatedhydroxyl toluene (BHT) as antioxidant. The organic solvent was evaporated under a stream of nitrogen and the lipid content was determined gravimetrically. Then, the extracted lipids were suspended in chloroform/methanol (2:1 v/v) and stored at -30 °C prior to analysis by gas chromatography.
2.3. Fatty acid analysis TOP
According to Cecci et al., (2017) after evaporation to dryness, the lipid extracts of six clams were trans-esterified. Briefly, 20 µl of lipid extract were evaporated with azote, then dissolved in hexane (2 ml), sulfuric acid (500 µl), sodium methoxide (500 µl) and sodium chloride (2 ml). An internal standard, namely methyl nonadecanoate C19:0 (Belefonte PA, USA, CRM47885) was added to the samples to facilitate the qualitative identification of the resulting fatty acids (Beccaria et al., 2015b). The previous mixture was centrifuged at 3500×g for 10 min and the obtained supernatants were evaporated and concentrated with pure hexane until injection. FAMEs were separated using an HP 6890 gas chromatograph with a split/splitless injector equipped with a flame ionization detector at 275 °C, and a 30 m HP Innowax capillary column with an internal diameter of 250 µm and a 0.25 µm film thickness. The Injector temperature was set at 250 °C. The oven was programmed to rise from 50 to 180 °C at a rate of 4 °C/min, from 180 to 220 °C at 1.33 °C/min and to stabilize at 220 °C for 7 min. The carrier gas was nitrogen at a flow rate of 493 m/s and an inlet pressure of 2.5 ml/min at 25 °C and 1 atm. The identification of FAMEs was based on the comparison of their retention times with those of a mixture of methyl esters (SUPELCO PUFA-3) to well-characterized fish oil (Menhaden oil by SUPELCO). Fatty acid peaks were integrated and analyzed using HP chemstation software. Fatty acids are expressed as mg/g ww.
2.4. Nutritional quality index (NQI)TOP
From the composition of fatty acids and their reported biological activities, some parameters were assessed to define the Nutritional Quality Index (NQI). From the result of the fatty acid composition, the following were calculated:
Atherogenicity index (AI): was based on the relationship between the pro-atherogenic (saturated fatty acids) and the anti-atherogenic (unsaturated fatty acids) according to Ulbricht and Southgate, (1991). This index demonstrates the adhesion and the good circulation of the blood system such as the modification of esterified fatty acid levels (like cholesterol, phospholipids…). The following equation was applied:
IA= ((12:0+ (4×14:0) +16:0)) / (ΣMUFAs+PUFAn6+PUFAn3)
Thrombogenicity index (TI): is established as the relationship between the pro-thrombogenetic (saturated) and the anti-thrombogenetic fatty acids (Fernández et al., 2007):
IT= (C14:0+C16:0+C18:0) / (0.50*MUFA) + (0.5*PUFA n-6) + (3* PUFA n-3) + (PUFA n-3 /PUFA n-6)
From the fatty acid results, PUFA/SFA-stearic acid, EPA+DHA; PUFA/SFA, MUFA/SFA and n-3/n-6 PUFA ratios (Marques et al., 2010) were also determined.
2.5. Minerals contents TOP
Ca, Mg and Mn contents were determined according to Carvalho et al., (2000). The soft tissue fractions for mineral analysis were rinsed with bi-distilled water, dried for 48 h at 60 °C and ground with an agate mortar. Powders (0.5g) were mineralized in Teflon bombs with nitric acid (69%) and hydrogen peroxide (37%) using a programmable microwave Touch Control Terminal 320 system (Milestone, type Ethos). The mineralized solution was gauged with water at 50 ml until analysis by inductively coupled with plasma mass spectrometry (ICP-MS) equipped with a graphite furnace using dynamic reaction cell (DRC) equipment. To check the analytical accuracy, standards and reference materials (NIST 1566b; NIST 2976) were processed. Concentrations of Ca, Mg and Mn are expressed as g. kg−1 of dry weight.
2.6. Biochemical measurementsTOP
Samples of 10 clams were homogenized by 10% in a Tris-HCl buffer (20mM, pH 7.4) containing EDTA (1mM) then centrifuged at 10.000g for 25 min at 4 °C. Supernatant aliquots were stored at -80 °C for further lipid and protein oxidation analyses.
2.6.1. Lipid peroxidation TOP
The thermal oxidation was carried out according to El Reffaei et al., (2014) and fixed as a ratio between C22:6n-3 and C16:0.
The thiobarbituric acid (TBA) measurement of lipid peroxidation was determined by employing the 2-thiobarbituric acid (TBA) assay of AOCS (1989). Each group was mixed with 0.5 ml of 30% trichloroacetic acid (TCA) and then homogenized and centrifuged at 3500 ×g at 4 °C for 15 min. After that, 1 ml of the supernatant was added to 1 ml of TBA solution and left in a boiling water bath at 100 °C for 30 min. Then the absorbance was measured at 532 nm by spectrophotometer (Jenway 6280 Fluorimeter). A standard solution with malonaldehyde was used to obtain a calibration curve and absorbance values were correlated with this curve in order to calculate the quantity of malonaldehyde (MDA). TBAR values were expressed as mg/kg ww.
Free fatty acid (FFA) measurement. The FFA fraction was analyzed according to the AOCS (1989) method. Approximately 1 ml of extraction was homogenized with 5 ml absolute ethanol and phenolphthalein, and the mixture was vortexed for 10 min under high heat (50–60 °C). A pink color was obtained under titration with KOH solution (0.1N).
The acid value index was calculated as follow: FFA= (Te-Tb) × N × M/ w
Where, Te is the sample titration, Tb is the blank titration, N is the normality of ml of KOH solution used, M is the molar weight of KOH, and W is the weight of the sample.
Peroxide value (PV) measurement. PV was determined according to the method of AOCS (1989). Samples were mixed with 5ml chloroform and glacial acetic acid. The reaction was initiated by the addition of a saturated solution of potassium iodide to obtain a yellow coloration. Before titration with a sodium thiosulfate solution (0.1N), 1ml of the starch solution was added to the present mixture (blue coloration).
Peroxide value = (S - B) × N thiosulfate × 1000/ weight of sample
S: titration of sample, B: titration of blank
2.6.2. Protein oxidationTOP
Advanced protein product oxidation (AOPP) measurement. AOPP was carried out f according to the Kayali et al., (2006) method. The reaction was measured at 340 nm and each concentration was calculated using the extinction coefficient of 261 cm−1 mM−1 and expressed as nmols/mg of protein.
Protein carbonyl (PCO) measurement. PCO determination was performed as described by Reznick and Packer, (1994) based on the reaction of carbonyls with dinitrophenylhydrazine- forming yellow compound (DNPH). Two volumes of DNPH (10 mM in HCl) were added to 200 µl of supernatant and incubated for 1h in the dark. The mixture was centrifuged after the addition of TCA (20%) at 14000 rpm for 5 min. After that, the pellet was washed with ethanol-ethyl acetate and re-suspended in guanidine (6M), vortexed and incubated in 60 °C for 15min. After centrifugation, the supernatant was used to measure the absorbance at 370 nm. Calculations were made using the extinction coefficient 22.000 and results were reported as nmols/mg of protein and represented as percent of control values.
2.7. Statistical analysisTOP
The results were given as the mean ±SD of the three replicated cooking processes. The data was examined by the normality test (Kolmogorov Smirnov test) using Statistical software analysis. To define the significance of differences in proximate value, fatty acid content and nutritional quality before and after cooking, analysis of variance (ANOVA) using one way followed by Tukey’s significant difference test (p < 0.05). All data are expressed as mean ± standard deviation. Differences in the compositions of the five groups were explored by principal component analysis (PCA).
3. RESULTS AND DISCUSSIONTOP
3.1. Proximate composition TOP
Changes in proximate composition (moisture, protein, meat yield and fat content) of R. decussatus before and after cooking are given in Table 1. The composition of the raw clam was comparable to the findings of other researchers (Ojea et al., 2004, Costa et al., 2017). The moisture content of the whole tissue of clams ranged from 61.3% to 88.9%, which decreased after cooking. The minimum moisture value was characteristic of fried tissue (61.3 ± 6.91%) and maximum moisture was found in the raw clams at (88.900 ± 9.084%). The decrease in moisture content has been defined as the greatest prominent change that is revealed by a significant increase in the fat content in cooked fish and seafood. Grilling and baking lowered the moisture content, which was highest after steaming, indication the water preservation ability of this method. Analogous studies on cooked mammals have demonstrated that the loss in moisture content is in opposite relation to the original temperature raise (Choi et al., 2017).
Table 1. Proximate compositions of raw and cooked clams
| Parameters & treatments |
Raw clams |
Steamed clams |
Baked clams |
Grilled clams |
Fried clams |
| Moisture (percent) |
88.900±9.084 |
80.390±8.631** |
74.480±6.271** |
71.840±7.088*** |
61.300±6.917*** |
| Lipids (mg/g) |
41.0±7.5 |
42.7±5.8 |
87.5±0.40.3 *** |
106.0±22.4 *** |
219.8±71.6 *** |
| Proteins (mg/g) |
13.57±1.79 |
11.41±2.01 |
10.28±1.55 ** |
10.20±0.96 ** |
7.52±0.70 *** |
| Meat yet (percent) |
37.468±1.817 |
35.922±5.528 |
20.133±2.097 ** |
24.732±2.990 ** |
11.590±3.281*** |
Results are expressed as means ± SD (n=10).
Significant difference among steamed, baked, grilled and fried with respect to raw are detected 5%: **p < 0.01 and ***p < 0.001 using ANOVA (Tukey-Kramer HSD test). |
The decrease in moisture caused a parallel reduction in the protein content in most cooking methods applied; the highest reduction was observed after frying at 44%. However, no change was recorded between raw and steamed clams. Our results were in contrast with those found for fish muscles, where an increase in protein content was instead observed after cooking (Ktari et al., 2015). This increase was correlated with the decrease in moisture. On the other hand, many authors indicated that cooking temperature may negatively influence the quality of cooked fish, due to cell damage, protein denaturation and lipid peroxidation (Ghribi et al., 2017).
In this regard, the meat yield (MY) index is of interest to many farms and meat companies to have information about the potential value of treated animals (Bugeon et al., 2010). The MY index has been used in many studies carried out on cooked fish. Our findings showed that baking and grilling caused a loss in MY corresponding to 46% and 33%, respectively. A significant reduction was detected in the MY index of fried clams
(p < 0.001), while MY did not vary significantly after steaming. Similar results were demonstrated by Ktari et al., (2015) in Salaria basilisca after cooking.
Dietary fat is an essential nutrient and a source of energy required for many functions in the body. Changes in the fat contents were observed in all cooking processes (p < 0.001) except for steaming. Based on this finding, the latter process appears to be the most beneficial to human health, since the fat content is preserved. The increase in fat content in fried clams is most likely related to both oil absorption during the cooking process and partial loss of water by evaporation (Saguy and Dana, 2003).
3.2. Changes in fatty acid compositionTOP
Table 2 shows the fatty acid compositions of the raw and cooked clams R. decussatus after different culinary methods as well as the frying-oil compositions before and after the cooking processes (Table 2). The fatty acids analyzed were assembled as saturated (SFA), monounsaturated (MUFA) and polyunsaturated fatty acids (PUFA). Thirty-two fatty acids were identified and difference in fatty acid contents among the five groups varied according to cooking method. The fatty acid profiles of fresh clams were characterized by high levels of polyunsaturated (PUFA) (46.02 mg/g) and monounsaturated (16.84 mg/g) followed by minor amounts of saturated fatty acids (12.91 mg/g). In fact, palmitic acid (16:0)
was the principal saturated fatty acid followed by stearic (C18:0) and myristic fatty acids (C14:0), contributing 8.44 mg/g;
4.01 mg/g and 3.79 mg/g, respectively, to the total saturated fatty acids in fresh clams. However, palmitoleic acid (C16:1)
was the most prominent monounsaturated fatty acid found with a level of 6.16 mg/g. Docosahexaenoic acid (C22:6n-3; 22.63 mg/g)
was the prominent PUFA in raw clams, followed by eicosapentaenoic acid (C20:5n-3; 3.47 mg/g). Similar results were described by Bejaoui et al., (2019).
Table 2. Fatty acid contents of cooked and uncooked clams expressed as mg per g of w weights.
| Fatty acids |
Raw clams |
Steamed clams |
Baked clams |
Grilled clams |
Fried clams |
Corn oil before Frying |
Corn oil after Frying |
| C14:0 |
3.79±0.48 |
9.31±2.59* |
1.21 ± 0.18** |
2.20 ± 0.16** |
12.41 ± 5.78** |
0.485 |
0.231 |
| C14:1 |
0.15±0.01 |
0.12±0.04 |
0.19 ± 0.05 |
0.22 ± 0.08 |
0.60 ± 0.43 |
- |
- |
| C15:0 |
0.43±0.05 |
0.34±0.05 |
0.74 ± 0.22* |
0.52 ± 0.11* |
1.30 ± 0.59* |
0.304 |
0.187 |
| C15:1 |
0.45±0.04 |
0.42±0.16 |
0.84 ± 0.33 |
6.23 ± 6.40 |
1.18 ± 0.49* |
0.370 |
0.111 |
| C16:0 |
8.44±1.46 |
14.08±5.82 |
31.84 ± 2.29*** |
16.09 ± 7.55* |
77.74 ± 16.90*** |
11.584 |
5.392 |
| C16:1 |
6.16±1.45 |
6.02±2.77 |
14.31 ± 3.51* |
3.53 ± 1.62* |
9.03 ± 4.39 |
0.332 |
0.211 |
| C16:2 |
2.58±0.40 |
2.61±0.19 |
1.97 ± 0.22 |
2.80 ± 0.71* |
2.68 ± 0.25 |
0.209 |
0.157 |
| C16:3 |
1.80±0.03 |
0.39±0.13 |
0.32 ± 0.04* |
0.80 ± 0.26 |
0.79 ± 0.19 |
0.049 |
0.040 |
| C16:4 |
0.96±0.21 |
0.34±0.11 |
0.74 ± 0.23 |
2.09 ± 0.90 |
0.44 ± 0.18 |
0.000 |
0.000 |
| C18:0 |
4.01±0.81 |
2.69±0.75 |
7.72 ± 1.18* |
7.07 ± 1.19* |
12.04 ± 2.21** |
2.842 |
1.237 |
| C18:1 |
5.29±1.04 |
3.40±1.10 |
15.82 ± 0.95*** |
5.73 ± 1.73 |
168.68 ± 32.45*** |
20.571 |
8.732 |
| C18:2n-6 |
1.35±0.23 |
1.91±0.50 |
3.91 ± 1.33 |
3.12 ± 1.33 |
39.81 ± 7.51*** |
39.748 |
16.907 |
| C18:3n-6 |
0.19±0.50 |
0.27±0.10 |
0.74 ± 0.30 |
0.81 ± 0.61 |
0.86 ± 0.23** |
0.207 |
0.100 |
| C18:3n-3 |
1.53±0.09 |
1.69±0.60 |
4.06 ± 1.68 |
2.06 ± 0.81 |
5.00 ± 1.57* |
4.093 |
1.712 |
| C18:4n-3 |
1.48±0.30 |
1.16±0.54 |
3.27 ± 1.42 |
1.09 ± 0.85* |
2.97 ± 1.32 |
- |
- |
| C20:0 |
0.06±0.01 |
0.02±0.00 |
0.04 ± 0.01 |
0.35 ± 0.33 |
0.83 ± 0.19 |
- |
- |
| C20:1 |
0.82±0.09 |
1.10±0.33 |
2.15 ± 0.78 |
1.11 ± 0.32 |
2.46 ± 0.62 |
- |
- |
| C20:2n-6 |
1.01±0.14 |
0.63±0.04* |
0.58 ± 0.13* |
0.74 ± 0.17** |
0.45 ± 0.064* |
- |
- |
| C20:3n-6 |
0.53±0.03 |
0.44±0.05 |
0.38 ± 0.05* |
0.83 ± 0.40 |
0.24 ± 0.048** |
- |
- |
| C20:4n-6 |
0.97±0.11 |
1.50±0.34 |
2.35 ± 0.65* |
2.59 ± 0.36** |
2.15 ± 0.53** |
- |
- |
| C20:3n-3 |
0.11±0.00 |
0.06±0.02 |
0.26 ± 0.088 |
0.23 ± 0.08 |
0.10 ± 0.04*** |
- |
- |
| C20:4n-3 |
0.37±0.06 |
0.31±0.06 |
0.35 ± 0.09 |
0.85 ± 0.59 |
0.25 ± 0.058** |
- |
- |
| C20:5n-3 |
3.47±0.85 |
3.05±0.76 |
1.59 ± 0.53* |
4.65 ± 0.19 |
3.57 ± 1.57 |
- |
- |
| C22:0 |
0.08±0.01 |
0.09±0.02 |
0.06 ± 0.01 |
0.10 ± 0.02 |
0.04 ± 0.00* |
- |
- |
| C22:1 |
0.01±0.01 |
0.06±0.03 |
0.09 ± 0.03* |
0.68 ± 0.69 |
0.12 ± 0.01** |
- |
- |
| C22:5n-6 |
1.40±0.15 |
1.14±0.24 |
1.16 ± 0.23 |
1.17 ± 0.14** |
0.94 ± 0.16** |
- |
- |
| C22:5n-3 |
7.32±0.88 |
1.41±1.10** |
0.95 ± 0.25*** |
0.76 ± 0.12*** |
0.48 ± 0.18*** |
- |
- |
| C22:6n-3 |
22.63±0.50 |
15.57±0.45*** |
10.02 ± 0.82*** |
9.06 ± 1.63*** |
5.84 ± 0.65*** |
- |
- |
| Σ SFA |
12.91±2.47 |
11.15±4.31 |
28.79±5.40* |
13.22 ± 8.25 |
117.95 ± 25.25*** |
15.370 |
7.109 |
| Σ MUFA |
16.84±1.66 |
26.56±9.04 |
37.93±3.25*** |
25.64 ± 9.93 |
64.06 ± 9.96** |
21.273 |
9.055 |
| Σ PUFA |
46.02±1.88 |
32.56±4.01* |
30.78±6.33* |
36.69 ± 4.98* |
46.79 ± 6.45 |
44.308 |
18.918 |
| Σ PUFA (n-3) |
36.93±1.53 |
23.28±2.44** |
20.52±3.63** |
16.75 ± 1.43*** |
13.89 ± 1.76** |
4.093 |
1.712 |
| Σ PUFA (n-6) |
5.35±0.23 |
5.91±1.16 |
9.15±2.48* |
8.02 ± 1.69* |
37.95 ± 0.39** |
39.956 |
17.008 |
Results are expressed as means ± SD (n=6).
Significant differences among steamed, baked, grilled and fried with respect to raw are detected at 5%: *p <0.05; **p < 0.01 and ***p < 0.001 using ANOVA (Tukey-Kramer HSD test). SFA = saturated fatty acid; MUFA = monounsaturated fatty acids; PUFA = polyunsaturated fatty acids. |
The fatty acid composition of cooked R. decussatus by different methods ranged from 11.15 to 117.95 mg/g for SFA; 26.56 to 64.06 mg/g for MUFA and 30.78 to 46.79 mg/g for PUFA.
The SFA content increased significantly after frying (821%) and baking (123%), but remained stable after the steaming and grilling processes. Palmitic (C16:0) and oleic (C18:0) acids were the major SFA in the raw and cooked clams, with a significant increase during baking (820% and 92%, respectively), grilling (90% and 79%, respectively) and frying (277% and 200%, respectively) processes, producing the most important induction in cooked clams. Those results are in harmony with other findings by Rombenso et al., (2015) and Costa et al., (2017). This increase could be due to the richness of corn oil with C16:0 and C18:0, which increased after cooking, indicating, consequently, the important absorption of those major SFA in R. decussatus tissue (Table 2).
The MUFA content increased after the baking (55%) and frying (280%) processes, but remained stable after steaming and grilling. Such increase was confirmed by a remarkable accumulation of oleic acid (C18:1) after the same processes. Therefore, this can be explained by the higher oil penetration during frying, which has a high amount of C18:1 (Table 2). This phenomenon of fatty acid exchange reproduces a gradient equilibrium between the fried tissue and the corn oil used for cooking. A similar increase was reported by Al-Saghir et al., (2004) after fried salmon as compared to the raw one.
The amounts of PUFA in all the cooked clams were statistically different as compared to the raw ones (p < 0.05). The lower PUFA value was detected with the steamed (29%), baked (33%) and grilled (19%) processes. Therefore, fried clams had the highest amount of linoleic acid (C18: 2n-6) (p < 0.001). Nonetheless, no change was observed during the steamed, grilled or baked processes as compared to the raw one. In agreement with our results a significant increase in C18:2n-6 after culinary oil frying was reported by Candela et al., (1997) for sole (Solea solea) and hake (Merluccius merluccius), by Al-Saghir et al., (2004) for salmon (Salmon salar) and by Hosseini et al., (2014) for Kutum roach (Rutilus frisii Kutum).
The n-3 PUFA group decreased after all cooking treatments. The decrease after steaming, baking, grilling and frying processes, respectively, was assessed to be significant at 36%, 44%, 54% and 62%. The same results were shown after culinary treatments by Domiszewski et al., (2011) for Pangasius hypophthalmus tissue. It appears that oil penetration by seafood is the best feature, which reduced the n-3 content during frying. In this present study, the amount of DHA decreased significantly after the four cooking methods, which can be related mostly to oxidation. However, only during the baked treatment did the EPA content decrease significantly by 54%. As compared to n-3 PUFA, the n-6 PUFA content increased significantly after the baked, grilled and fried treatments with 71%, 49% and 609%, respectively, compared to theuncooked groups. EPA and DHA were the most sensitive FA influenced significantly by heat treatment as shown in other findings (Candela et al., 1997). The major investigations on cooking process showed that changes in fatty acid contents after different cooking methods had significant effects on the major FA, inducing reductions in n-3 PUFA, EPA and DHA and increases in n-6 PUFA and SFA (Housseini et al., 2014; Neff et al., 2014).
Therefore, when corn oil is retained in cooked clams, it would be expected to raise the total fatty acid contents such as C16:0, C18:1 and C18:2n-6 and decrease the amounts of DHA and EPA. Conversely, the fatty acid profile of corn oil, and its retention in the soft tissue of cooked clams, explains some of the observed differences in fatty acid content between cooked and uncooked tissue, as well as the variation among different cooking methods.
The differences among cooking processes in fatty acid composition can also be influenced by temperature in addition to other parameters relative to those culinary methods such as the amount of tissue interruption and the nature of chemical reactions developed during cooking (Weber et al., 2008).
3.3. Nutritional quality index (NQI)TOP
Depending on the perceived differences in fatty acid content and composition between fresh and cooked clams, some lipid quality indices were determined. However, the nutritional quality indices of fresh and cooked clams are registered in Table 3. Recent research has pointed out the importance of compensation of the ratio of n-3/n-6 fatty acids which is beneficial when the n-3 group is higher than the n-6 group (Neff et al., 2014). Our results show that the greatest content in n-3/n-6 ratio was detected in raw samples with 6.97±0.53. Nevertheless, changes in the n-3/n-6 ratio were more prominent in the steamed, baked, grilled and fried tissue, which decreased significantly by 41%, 62%, 65% and 94%, respectively, in comparison to the raw groups (Table 3). These results were in agreement with the findings of Hosseini et al., (2014) and Neff et al., (2014) for fish. The n-3/n-6 fatty acid ratio has been recommended to be a beneficial indicator for associating the relative nutritional values of fish oils. Despite the decrease in this ratio during frying, all clams had an n-3/n-6 ratio higher than 0.25, which is recommended for health benefits by the British Nutrition Foundation (1992), by Nutritional recommendations for the French population (2001) and by German-Austrian-Swiss recommendations (2008).
Table 3. Indices of nutritional quality (NQI) in raw and cooked clams.
| NQI |
Raw clams |
Steamed clams |
Baked clams |
Grilled clams |
Fried clams |
| n-3/n-6 |
6.97±0.53 |
4.10±0.29 ** |
2.61±0.35 *** |
2.39±1.07 * |
0.37±0.06** |
| PUFA/SFA (Stearic) |
13.34±2.65 |
13.41±1.76 |
4.83±0.96** |
23.41±6.19 ** |
6.02±0.06** |
| EPA+DHA
|
26.10±1.16 |
18.63±0.38*** |
11.61±0.61** |
9.75±1.55** |
7.93±0.52** |
| AI |
0.46±0.03 |
0.93±0.07** |
0.73±0.10 * |
0.31±0.03 * |
0.86±0.10** |
| TI |
0.12±0.01 |
0.26±0.05* |
0.49±0.05 * |
0.17±0.48 |
0.72±0.02 ** |
| Results are expressed as means ± SD (n=6). Significant difference among steamed, baked, grilled and fried with respect to raw are detected 5%: **p < 0.01 and ***p < 0.001 at 5%: *p < 0.05; **p < 0.01 and ***p < 0.001 using ANOVA (Tukey-Kramer HSD test). EPA = eicosapentaenoic acid; DHA = docosahexaenoic acid; SFA = saturated fatty acid; MUFA = monounsaturated fatty acids; PUFA = polyunsaturated fatty acids; AI= Atherogenicity index; TI= Thrombogenicity index. |
Considering the health benefits of the PUFA/SFA ratio, the highest amount was observed for grilled clams at 75%. However, a clear decrease was recorded after the baked (63%) and fried (54%) treatments. No statistical difference was observed between steamed and raw clams for this ratio. It has been suggested that this ratio is a good standard to compare the nutritional value of the oil present in cooked seafood (Neff et al., 2014).
Essential fatty acids, especially EPA and DHA, are long chain n-3 fatty acids which play an important role in biological processes
(Hosseini et al., 2014). The EPA+DHA sum is one of the greatest imperative nutritional quality indices. In our study, all cooking methods statistically
(p < 0.01) reduced their EPA + DHA contents. However, the fried method produced the lowest reduction (69%). The highest EPA+
DHA value was found in the raw clams in the order of 26.10 ± 1.16 mg/g ww. Our results were in agreement with El Reffaei et al., (2014). In this context, British Nutrition Foundation (1992) recommended that a person who has a balanced, healthy diet consume 0.2 g of EPA and DHA daily.
The investigation on the nutritional index and lipid quality of fresh and cooked clams revealed the immense health benefits that this culinary process can provide. Our results showed a significate variation in the PUFA/stearic ratio, which ranged from 13.34 to 4.83 mg/g, respectively, for cooked and uncooked treatments. Indeed, steamed and baked treatments had significant effects on the PUFA/stearic acid ratios. However, the PUFA/stearic ratio in fried tissue was three times higher than fresh clams (Table 3). The same results were presented by Ojagh et al., (2010) for three cooked farm fish.
The atherogenicity (AI) and thrombogenicity (TI) indices reflect the risks associated with heart disease and therefore must be kept at a low level. Regarding lipid quality indices (table 3), all cooked methods did not change their TI as compared to the raw clams. The same variation was observed in cooked clams with respect to the AI index, but it increased significantly (p < 0.05) by 86% during the frying process. The lower values for both indices showed the best nutritional quality of fatty acids; therefore, nourishment with low AI and TI values could reduce the potential risk of coronary heart disease (CHD).
3.4. Mineral analysisTOP
The results for minerals contents in cooked and uncooked clams are presented in Table 4. The Ca, Mg and Mn levels in the raw, steamed and baked clams were not significantly different (p > 0.01). In general, grilled and fried treatments led to significant reductions in most mineral contents such as Ca, Mg and Mn (p < 0.01). This was also confirmed by the investigation of Gokoglu et al., (2004) on cooked Oncorhynchus mykiss.
Table 4. Effect of different cooking methods on mineral contents (manganese; calcium and magnesium) in clam tissue (Ruditapes decussatus ).
| Minerals (mg/kg ww) |
Raw clams |
Steamed clams |
Baked clams |
Grilled clams |
Fried clams |
| Magnesium |
2.312±0.086 |
2.238±0.069 |
2.300±0.021 |
2.185±0.026* |
2.026±0.089** |
| Manganese |
2.064±0.056 |
2.022±0.022 |
1.997±0.017 |
1.935±0.062 * |
1.864±0.043 ** |
| Calcium |
1.990±0.088 |
1.909±0.138 |
1.887±0.022 |
1.787±0.019 ** |
1.704±0.027 ** |
| Results are expressed as means ± SD (n=10). Significant differences among steamed, baked, grilled and fried with respect to raw are detected at 5%: *p < 0.05 and **p < 0.01 using ANOVA (Tukey-Kramer HSD test). |
3.5. Degradation indicesTOP
A clear influence of culinary processes on the clam tissues (R. decussatus) in relation with the fried oil was detected, inducing alterations in lipid and protein portions.
3.5.1. Lipid peroxidationTOP
PUFA autooxidation is catalyzed by many ways (heat, light, trace metals or enzymes) and consequently involves free radical generation which reacts with oxygen to form hydroperoxides. Several measurements were used in our study to evaluate the extent of oxidation (TBARS, FFA, PV) (Ojagh et al., 2010).
Thiobarbituric acid (TBA). Cooking is one of the processes that changes the physical structure of foods, thus accelerating lipid peroxidation reactions. These results show that there was no difference in the lipid peroxidation of steamed clams when compared to the raw ones (Table 5). Nonetheless, baked, grilled and fried processes have a significant effect (p < 0.05) on the development of major oxidation products, with higher TBA levels (30.629 mg/kg) obtained for fried than raw clams (8.250 mg/kg) (Table 5). Such an increase is probably due to the high PUFA level in this oil, especially C18:2n-6, which probably accelerated this phenomenon. However, it is known that lipid oxidation susceptibility increases with the number of unsaturation in the molecule
(Ansorena et al., 2010). This phenomenon was also observed by Bakar et al., (2008). The increase in TBARs after baking, grilling and frying possibly happened due to the high temperature that induced lipid peroxidation.
Table 5. Effect of different cooking methods on lipid peroxidation (Thiobarbituric acid, thermal oxidation ratio, free fatty acid, peroxide value) and protein oxidation (advanced oxidation protein products, protein carbonyls) in clam tissue (Ruditapes decussatus).
| |
Parameters |
Raw clams |
Steamed clams |
Baked clams |
Grilled clams |
Fried clams |
| Lipid peroxidation |
TBARSα |
8.250±0.426 |
8.583±0.915 |
10.076±1.713* |
12.125±1.161*** |
30.629±3.702*** |
| |
TOR |
0.554±0.079 |
0.545±0.111 |
0.410±0.012*** |
0.525±0.056 |
0.401±0.052*** |
| |
FFAβ |
200.200±8.140 |
215.360±18.348 |
236.880±8.460 *** |
237.82±13.326 *** |
299.400±7.096 *** |
| |
PV£ |
34.995±3.070 |
46.247±9.159 |
52.439±4.518 * |
88.936±7.445 *** |
98.739±7.445 *** |
| Protein oxidation |
AOPP¥ |
0.133±0.038 |
0.150±0.091 |
0.241±0.083 *** |
0.253±0.091 *** |
0.387±0.096 *** |
| |
PCO¥ |
59.413±7.968 |
68.248±8.996* |
104.557±28.830 *** |
105.995±20.535 *** |
158.444±25.051 *** |
Results are expressed as means ± SD (n=10).
Significant differences among steamed, baked, grilled and fried clams with respect to raw are detected at 5%: *p < 0.05 and ***p < 0.001 using ANOVA (Tukey-Kramer HSD test).
α: mg/kg ww
β: percent
£: ml/g
¥: nmol/mg of protein |
Thermal oxidation ratio (TOR). Table 5 presents the thermal oxidation ratio in the different cooking processes for clams: raw, steamed, grilled, baked and fried. This ratio decreased significantly (p < 0.05) after the baking (26%) and frying processes (92%) as compared to fresh clams. However, a similar variation was observed among steamed, grilled and raw clams as reported in table 5. Our findings are similar to the research by El Reffaei et al., (2014), which shows a decrease in the thermal oxidation ratio after cooking fish.
Free fatty acid (FFA). After cooking, there was a decrease in FFA as a function of heating time as the percentage of oil increased (Table 5). The average amount of FFA was higher in the uncooked clams (200.20%) and increased significantly by 236%, 237% and 299%
in baked, grilled and fried clams, respectively. This decrease probably occurred during heating, and could be explained by the deactivation of enzymes or by dilution in the corn oil or FFA. Indeed, this would prevent the release of FFA due to lipase activity in the cooked samples. Our results were in agreement with Al Saghir et al., (2004) and Weber et al., (2008), who studied salmon and catfish with different cooking methods.
Peroxide value (PV). PV is a widely used indicator for the assessment of the degree of lipid oxidation (Ansorena et al., 2010). In Table 5, the PV values for different cooked processes are presented. The uncooked clams have the lowest PV value at about 34.99 ml/g. However, the PV of the cooked clams showed a gradual increase (p < 0.05). The steamed, baked and grilled method had high values for PV at about 32%, 49% and 154%, respectively, compared to the uncooked bivalves. From these results, it is clear that frying was very effective in promoting lipid oxidation especially in PV. PV exhibited the highest amount after frying with 2.8 times as high as the raw clams. This remarkable amount may be attributed to the high degree of PUFA n-6 groups.
The susceptibility of clam tissue to lipid oxidation can be attributed to a number of factors such as the level of polyunsaturated fatty acids present in the particular tissue system. The casual lipid radical formation of unsaturated fatty acids with molecular oxygen is thermodynamically unfavorable and facilitates the generation of species able to abstract a proton from an unsaturated fatty acid and cause the propagation of lipid oxidation by catalyzing the breakdown of lipid hydro-peroxides (Hsieh and Kinsella, 1989).
3.5.2. Protein oxidationTOP
The oxidation of cooked clams leads to a significant change in their nutritional quality in terms of availability and digestibility of oxidized clam proteins. In this study, protein oxidation was confirmed by AOPP and PCO, which were used as a measurement of the extent of oxidative reactions affecting clam protein during cooking processes.
Advanced protein product oxidation (AOPP). The formation of AOPP compounds is one of the most important changes taking place during the oxidation of proteins. The AOPP level of different cooked groups is mentioned in Table 5. The AOPP level was considerably more intense in the other cooked processes that progressed protein oxidation by increasing the amount of AOPP. Comparing uncooked clams with the others, showed that the lowest level of AOPP was detected in the steamed groups (p > 0.05). However, there was no significant difference in the AOPP level between the control and steamed groups. The amounts of AOPP significantly increased by about 1.8 fold after baking and grilling clams. The greatest accumulation of AOPP mainly occurred after frying clam, with the highest amount being detected in the order of 189% as compared to uncooked clams.
Proteins carbonyls (PCO). The oxidative deterioration of proteins in bivalves during cooked processes is shown in Table 5. The amount of PCO was increased significantly as compared to uncooked clams (p < 0.05). However, the protection offered against the formation of PCO followed this order: uncooked<steamed<baked<grilled<fried. In fact, differences were significantly higher after all culinary processes, which increased the PCO by about 1.1 and 1.7
fold up in steamed, baked and grilled, respectively. The most important production of PCO was detected after the frying method, indicating that this process gave the largest increase in protein oxidation products. Indeed, fried clams were characterized by an elevated amount of PCO, which increased by 166% compared to the uncooked ones. The results are consistent with volatile oxidation products, suggesting a possible relationship between the protein carbonyl formation and volatiles. The formation of protein carbonyl compounds has been reported to be the second sign of protein oxidation due to proteins interacting with secondary lipid oxidation products (Sabeena et al., 2001).
The onset of this oxidation in cooked foods and the impact of these reactions on fish (Lund et al., 2001) have been extensively studied, however, research on cooked bivalves was absent.
3.6. Principal component analysis (PCA)TOP
For a more accurate statistical evaluation, PCA was examined in our study to clarify changes in the intact lipid content during treatments (Figure 1). PCA explained 83.64% of the variations (Factor 1= 68.64%; Factor 2=15.00%) among cooking processes. As shown in Fig.1, three clusters were represented: The first cluster of raw and steamed clams was related to a high amount of EPA+DHA, n-3/n-6, moisture, n-3, protein and minerals, which correlated negatively with factor 1. However, cluster two, grouping fried and baked clams, was characterized by high contents of MUFA, SFA, TBARS, AOPP, PCO, PV and n-6, which were correlated positively with factor 1. Cluster three re-groups grilled clams as correlated with the highest PUFA/SFA and h/H ratios. Our results were similar to previous studies by Bakar et al., (2008), who showed differences among the fatty acid compositions of raw and fried samples, and almost identical contents after steaming, grilling and baking processes.
|
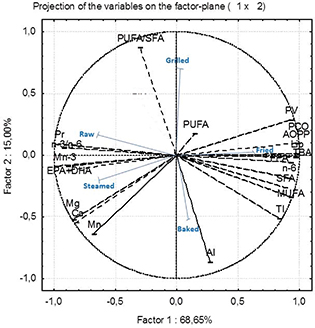 Figure 1. Principal component analysis (PCA) among fatty acid groups, nutritional quality and degradation indices of the uncooked and cooked Ruditapes decussatus tissue. EPA: eicosapentaenoic acid; DHA: docosahexaenoic acid; SFA: saturated fatty acid; MUFA: monounsaturated fatty acids; PUFA: polyunsaturated fatty acids; AI: Atherogenicity index; TI: Thrombogenicity index; Pr: protein; Lip: lipids; Mn:magnesium; Mg: manganese; Ca: calcium: PV: peroxide value; TBA: thiobarbaturic acid; FFA: free fatty acids; PCO: protein carbonyl; AOPP: advanced oxidation protein products. Figure 1. Principal component analysis (PCA) among fatty acid groups, nutritional quality and degradation indices of the uncooked and cooked Ruditapes decussatus tissue. EPA: eicosapentaenoic acid; DHA: docosahexaenoic acid; SFA: saturated fatty acid; MUFA: monounsaturated fatty acids; PUFA: polyunsaturated fatty acids; AI: Atherogenicity index; TI: Thrombogenicity index; Pr: protein; Lip: lipids; Mn:magnesium; Mg: manganese; Ca: calcium: PV: peroxide value; TBA: thiobarbaturic acid; FFA: free fatty acids; PCO: protein carbonyl; AOPP: advanced oxidation protein products.
|
|
4. CONCLUSIONTOP
The results showed statistically significant modifications in the changes in the proximate compositions of uncooked and cooked clam tissues. The lipid portion in raw clams was characterized by a high level of n-3 PUFA, predominantly EPA and DHA, reflecting the fatty acid composition of the fresh clams. Frying clams in corn oil decreased n-3 PUFA and increased n-6 PUFA, in detriment to the beneficial effects of the great n-3 PUFA level in fresh clams. Nutritional quality indices, such as PUFA/stearic acid and EPA+DHA, showed variations among baking, steaming, and grilling processes and fresh clams. However, fried clams changed significantly in all nutritional quality indexes during our study. The grilling and frying treatments changed the mineral contents of clam tissue. Fried clams had a lower level of Mg, Ca and Mn than raw or other cooked treatments. It was found that FFA, PV, TBA, TOR, AOPP and PCO varied significantly during the frying treatment. It can be concluded that the frying process is not recommended for cooking and steaming is more valuable and healthier because it preserves omega 3 fatty acids that are less affected by the oxidation process.
Conflict of interestTOP
All co-authors agree with the content of the manuscript and have no conflict of interest to declare.
Author Contributions (required)TOP
This study is part of the M.Sc. thesis of the first author (Dr. S BEJAOUI), who collected the samples, conducted the analysis, interpreted the data and wrote the manuscript. Dr. I RABEH, Dr. F GHRIBI and Dr. F AOUINI assisted with the analysis, figures and the writing of the manuscript. Dr. CHETOUI and Dr. K. TLAHIGUE contributed to data collection fatty acids and mineral extraction. Dr. N SOUDANI and Pr. M ELCAFSI co-directed the research and participated in the manuscript revision. All authors read and approved the final manuscript.
ACKNOWLEDGMENTSTOP
This work was supported by the Physiology and Aquatic Environment Laboratory, Faculty of sciences, University of Tunisia El Manar. We would like to thank the entire laboratory team and Mr. Hssan Mejri for his technical assistance with the Gas chromatography analysis.
REFERENCESTOP
| ○ |
Ab Latif W, Sajad AB, Anjum A. 2015. Omega-3 fatty acids and the treatment of depression: a review of scientific evidence. Integr. Med. Res. 4, 132–141. https://doi.org/10.1016/j.imr.2015.07.003 |
| ○ |
Al Saghir S, Thurner K, Wagner KH, Frisch G, Luf W, Razzazi FEF, Elmadfa I. 2004. Effects of different cooking procedures on lipid quality and cholesterol oxidation of farmed salmon fish (Salmon salar). J. Agric. Food Chem. 52, 5290–5296. https://doi.org/10.1021/jf0495946 |
| ○ |
Amri I, Hmaied F, Loisy F, Lebeau B, Barkallah I, Saidi M, Slim A. 2009. Hepatitis A virus detection in shellfish from Tunisia by reverse transcription-nested PCR –investigation of a correlation between viral and bacterial contamination. Pathol. Biol. 59, 217–21. https://doi.org/10.1016/j.patbio.2009.10.009 |
| ○ |
Ansorena D, Guembe A, Mendizabal T, Astiasaran I. 2010. Effect of fish and oil Nature on Frying Process and Nutritional Product Quality. J. Food Sci. 75, 62–7. https://doi.org/10.1111/j.1750-3841.2009.01472.x |
| ○ |
AOCS. 1989. Official Methods and Recommended Practices of the American Oil Chemists’ Society, 4th edn. Firestone, D. (Ed.). Champaign, CA: American Oil Chemists’ Society. Pp. 5a–40. |
| ○ |
Bakar J, Zakipour RE, Cheman YB. 2008. Lipid characteristics in cooked-chillreheated fillets of Indo-Pacific King Mackerel
(Scomberomorous guttatus). Food Sci. Technol. 41, 2144–2150 https://doi.org/10.1016/j.lwt.2007.12.004 |
| ○ |
Beccaria M, Costa R, Sullini G, Grasso E, Cacciola F, Dugo P, Mondello L. 2015b. Determination of the triacylglycerol fraction in fish oil by comprehensive liquid chromatography techniques with the support of gas chromatography and mass spectrometry data. Anal. Bioanal. Chem. 407, 5211–5225. https://doi.org/10.1007/s00216-015-8718-y |
| ○ |
Bejoui S, Boussefa D, Telahigue K, Chetoui I, Ghribi F, Rabeh I, El Cafsi M. 2019. Geographic variation in fatty acid composition and food source of the commercial clam (Ruditapes decussatus, Linnaeus, 1758), from Tunisian coasts: Trophic links. Grasas Aceites 70, e289. https://doi.org/10.3989/gya.0580181 |
| ○ |
British Nutrition Foundation. 1992. Unsaturated fatty acids nutritional and physiological significance, Report of the British Nutrition Foundation’s Task Force, London: Chapman & Hall. |
| ○ |
Bugeon J, Lefevre F, Cardinal M, Uyanik A, Davenel A, Haffray P. 2010. Flesh quality in large rainbow trout with high or low fillet yield. J. Muscle. Foods 21, 702–721. https://doi.org/10.1111/j.1745-4573.2010.00214.x |
| ○ |
Candela M, Astiasaran I, Bello J. 1997. Effects of frying and wambolding on fatty acids and cholesterol of sole (Solea solea), codfish (Gadus moubua) and hake (Meduccius medussius). Food Chem. 58, 227–231. https://doi.org/10.1016/S0308-8146(96)00169-0 |
| ○ |
Cecchi G, Basini S, Castano C. 2017. Méthanolyse rapide des huiles en solvant. Revue Francaise des Corps Gras 32, 163–164. |
| ○ |
Choi EJ, Park HW, Chung YB, Park SH, Kim JS, Chun HH. 2017. Effect of tempering methods on quality changes of pork loin frozen by cryogenic immersion. Meat. Sci. 124, 69–75. https://doi.org/10.1016/j.meatsci.2016.11.003 |
| ○ |
Costa R, Beccaria M, Grasso El, Albergamo A, Oteri M, Dugo P, Fasulo S, Mondello L. 2015a. Sample preparation techniques coupled to advanced chromatographic methods for marine organisms’ investigation. Anal. Chim. Acta 22, 41–53, ISSN: 0003-2670. |
| ○ |
Costa R, Albergamo A, Piparo M, Zaccone G, Capillo G, Manganaro A, Dugo P, Mondello L. 2017. Multidimensional gas chromatographic techniques applied to the analysis of lipids from wild-caught and farmed marine species. Europ. J. Lipid Sci. Technol. 119, 1600043. https://doi.org/10.1002/ejlt.201600043 |
| ○ |
Domiszewski Z, Bienkiewicz G, Plust D. 2011. Effects of different heat treatments on lipid quality of striped catfish (Pangasius hypophthalmus). Acta. Sci. Pol. Technol. Alim. 10, 359–373. |
| ○ |
El Reffaei WHM, Abbas NS, Atwa M, Abulhamd EM, Rasha EA. 2014. Nutritional value and fatty acid composition of household cooking on fish fatty acids profile using atherogenicity and thrombigenicity indices. J. Food Chem. Nut. 02, 27–41. |
| ○ |
Fernández M, Ordóñez JA, Cambero I, Santos C, Pin C, de la Hoz L. 2007. Fatty acid compositions of selected varieties of Spanish ham related to their nutritional implication. Food Chem. 101, 107–112. https://doi.org/10.1016/j.foodchem.2006.01.006 |
| ○ |
Folch J, lees M, Stanley GHS. 1957. A simple method for the isolation and purification of total lipids from animal tissues. J. Biol. Chem. 226, 497–509. |
| ○ |
Ghribi F, Bejaoui S, Rabeh I, Aouini F, Chetoui I, El Cafsi M. 2017. Effects of Culinary Methods on Nutritional Characteristics of the Edible Shellfish Noah’s Ark (Arca noae L., 1758) from Tunisian Coasts, J. Aqua. Food Prod. Technol. https://doi.org/10.1080/10498850.2017.1390714 |
| ○ |
Gokoglu N, Yerlikaya P, Cengiz E. 2004. Effects of cooking methods on the proximate composition and mineral contents of rainbow trout (Oncorhynchus mykiss). Food Chem. 84, 19–22. https://doi.org/10.1016/S0308-8146(03)00161-4 |
| ○ |
Graci-Arisa MT, Pontes EA, Linares MCG, Garcia-Fernandez MC, Sanchez-Muniz FJ. 2003. Cooking-freezing-reheating (CFR) of sardine
(Sardinapilchardus) fillets: Effect of different cooking and reheating procedures on the proximate and fatty acid compositions. Food Chem. 83, 349–356. https://doi.org/10.1016/S0308-8146(03)00095-5 |
| ○ |
Horwitz W, Latimer GW. 2005. Official methods of analyses of the association of analytical chemists international (18th ed). Washington, Gaithersburg, Md.
|
| ○ |
Hosseini H, Mahmoudzadeh M, Rezaei M, Mahmoudzadeh L, Khaksar R, Khosroshahi NK, Babakhani A. 2014. Effect of different cooking methods on minerals, vitamins and nutritional quality indices of Kutum roach (Rutilus frisii kutum). Food Chem. 148, 86–91. https://doi.org/10.1016/j.foodchem.2013.10.012 |
| ○ |
Hsieh RJ, Kinsella JE. 1989. Oxidation of polyunsaturated fatty acids: mechanisms, products and inhibition with emphasis on fish. Ad. Food Nut. Res. 33, 233–341. https://doi.org/10.1016/S1043-4526(08)60129-1 |
| ○ |
Kayali R, Cakatay U, Akcay T, Altug T. 2006. Effect of alpha-lipoic acid supplementation on markers of protein oxidation in post-mitotic tissues of ageing rat. Cell Biochem. Func. 24, 79–85. https://doi.org/10.1002/cbf.1190 |
| ○ |
Ktari N, Trabelsi I, Ben Slama R, Ben Salah R, Nasri M, Souissi N. 2015. Effects of cooking methods on physicochemical and microbiological characteristics of Zebra Blenny (Salaria basilisca) fillets. Adv. Tech. Biol. Med. 3, 136. https://doi.org/10.4172/2379-1764.1000136 |
| ○ |
Lira GM, Barros-Silva KW, Figueiredo BC, Bragagnolo N. 2014. Impact of smoking on the lipid fraction and nutritional value of sea bob shrimp (Xiphopenaeus Kroyeri, Heller, 1862). Food Sci. Technol. 58, 183–187. https://doi.org/10.1016/j.lwt.2014.02.057 |
| ○ |
Lowry OH, Rosebrough NJ, Farr AL, Randall RJ. 1951. Protein Measurement with the Folin Phenol Reagent. J. Biol. Chem. 193, 265–275. |
| ○ |
Lund MN, Heinonen M, Baron CP, Estevez M. 2001. Protein oxidation in muscle foods: A review. Mol. Nut. Food Res. 55, 83–95. https://doi.org/10.1002/mnfr.201000453 |
| ○ |
Marques A, Teixeira B, Barrento S, Anacleto P, Carvalho ML, Nunes ML. 2010. Chemical composition of Atlantic spider crab Maja brachydactyla: human health implication. J. Food Comp. Anal. 23, 230–237. https://doi.org/10.1016/j.jfca.2009.10.007 |
| ○ |
Neff MR, Bhavsar SP, Braekevelt E, Arts MT. 2014. Effect of different cooking methods on fatty acid profiles in four freshwater fishes from Laurentian Great lakes region. Food Chem. 164, 544–550. https://doi.org/10.1016/j.foodchem.2014.04.104 |
| ○ |
Ojagh SM, Rezaei M, Razavi SH, Hosseini SMH. 2010. Effect of chitosan coatings enriched with cinnamon oil on the quality of refrigerated rainbow trout. Food Chem. 120, 193–198. https://doi.org/10.1016/j.foodchem.2009.10.006 |
| ○ |
Ojea J, Pazos AJ, Martinez D, Novoa S, Sanchez JL, Abad M. 2004. Seasonal variation in weight and biochemical composition of the tissues of Ruditapes decussatus in relation to the gametogenic cycle. Aqu. 238, 451–468. https://doi.org/10.1016/j.aquaculture.2004.05.022 |
| ○ |
Pao-Yen L, David M, Marlene P F, Yutaka M, Joseph H, RH B, Kuan-Pin S. 2012. Are omega-3 fatty acids anti-depressants or just mood-improving agents? Mol. Psychiatry 17, 1161–1163. https://doi.org/10.1038/mp.2012.111 |
| ○ |
Parisi G, Giorgi G, Messini A, Poli BM. 2005. Growth performance and quality traits of mussel (Mytillus galloprovincialis, Lamarck) reared in two different sites in Tuscany. Italian J. Ani. Sci. 4, 612–614. |
| ○ |
Reznick AZ, Packer L. 1994. Oxidative damage to proteins: Spectrophotometric methods for carbonyl assay. Methods. Enzymol. 233, 357–63. https://doi.org/10.1016/S0076-6879(94)33041-7 |
| ○ |
Rombenso AN, Trushenski JT, Jirsa D, Drawbridge M. 2015. Successful fish oil sparing in white sea bass feeds using saturated fatty acid rich soybean oil and 22/6n3 DHA supplementation. Aqu. 448, 176–185. https://doi.org/10.1016/j.aquaculture.2015.05.041 |
| ○ |
Sabeena FKH, Grejsen HD, Jacobsen C. 2011. Potato peel extract as a natural antioxidant in chilled storage of minced horse mackerel (Trachurus trachurus): Effect on lipid and protein oxidation. Food Chem. 131, 843–851. https://doi.org/10.1016/j.foodchem.2011.09.056 |
| ○ |
Saguy IS, Dana D. 2003. Integrated approach to deep fat frying: engineering, nutrition, health and consumer aspects. J. Food Eng. 56, 143–152. https://doi.org/10.1016/S0260-8774(02)00243-1 |
| ○ |
Ulbricht TLV, Southgate DAT. 1991. Coronary heart disease: seven dietary factors. Lancet 338, 985–992. |
| ○ |
Weber J, Bochi VC, Ribeiro CP, Victorio AM, Emanuelli E. 2008. Effect of different cooking methods on the oxidation, proximate and fatty acid composition of silver catfish (Rhamdia quelen) fillets. Food Chem. 1, 140–146. https://doi.org/10.1016/j.foodchem.2007.05.052 |