Monitoring of the enzymatic activity of intracellular lipases of Ustilago maydis expressed during the growth under nitrogen limitation and its correlation in lipolytic reactions
M.G. Araiza-Villanuevaa, D.R. Olicón-Hernándeza,b, J.P. Pardob, H. Vázquez-Mezab and G. Guerra-Sáncheza,*
aInstituto Politécnico Nacional. Escuela Nacional de Ciencias Biológicas, Departamento de Microbiología. Carpio y Plan de Ayala S/N, col Santo Tomás, 11340 Ciudad de México, México
bUniversidad Nacional Autónoma de México, Facultad de Medicina, Departamento de Bioquímica. Circuito interior S/N Ciudad Universitaria, 04510 Cd de México, México
*Corresponding author: lupegs@hotmail.com; mguerras@ipn.mx
| |
SUMMARY
Under nitrogen starvation, Ustilago maydis forms lipid droplets (LDs). Although the dynamics of these organelles are known in the literature, the identity of the lipases implicated in their degradation is unknown. We determined lipase activity and identified the intracellular lipases expressed during growth under nitrogen starvation and YPD media by zymograms. The results showed that cytosolic extracts exhibited higher lipase activity when cells were grown in YPD. Under nitrogen starvation, lipase activity was not detected after 24 h of culture, resulting in lipid accumulation in LDs. This suggests that these lipases could be implicated in LD degradation. In the zymogram, two bands, one of 25 and the other of 37 kDa, presented lipase activity. The YPD extracts showed lipase activity in olive and almond oils, which contain triacylglycerols with mono and polyunsaturated fatty acids. This is the first report about U. maydis cytosolic lipases involved in LD degradation.
|
| |
RESUMEN
Monitoreo de la actividad enzimática de las lipasas intracelulares de Ustilago maydis expresada durante el crecimiento en limitación de nitrógeno y su correlación en reacciones lipolíticas. En ausencia de nitrógeno, Ustilago maydis forma cuerpos lipídicos (LDs). Aunque se conoce la dinámica de estos organelos, se desconoce la identidad de las lipasas implicadas en su degradación. En este estudio se determinó la actividad de lipasa, y se identificaron las lipasas intracelulares expresadas durante el crecimiento sin nitrógeno y en YPD mediante zimogramas. Los extractos citosólicos de células en YPD exhibieron mayor actividad de lipasa. En medio sin nitrógeno no se detectó actividad de lipasa después de 24 h de cultivo, presentándose acumulación de lípidos en los LDs. Esto sugiere que estas lipasas podrían implicarse en la degradación de los LDs. En el zimograma bandas de 25 y 37 kDa, presentaron actividad de lipasa. Los extractos de células cultivadas en YPD hidrolizaron triacilgliceroles compuestos de ácidos grasos mono y poliinsaturados. Este es el primer reporte sobre lipasas citosólicas de U. maydis implicadas en la degradación de LDs.
|
1. INTRODUCTIONTOP
The synthesis and accumulation of lipids are two processes that fulfill several functions in cells, such as growth, cell division, and energy storage (Klug and Daum, 2014). Nutritional stress induces a change in the metabolic fluxes of yeast cells, stopping the synthesis of proteins and nucleic acids and increasing the synthesis of lipids from available sources of carbon. Depletion of the nitrogen source has the greatest impact on lipid accumulation (Li et al., 2015). To avoid the lipotoxicity caused by an excess of sterols and fatty acids (FA), yeast cells convert both compounds into neutral lipids such as triacylglycerols (TAGs) and sterol esters (SE). These neutral molecules are stored in specialized organelles called lipid droplets (LD) and can be mobilized and used as an energy source or as precursors to membrane lipids (Klug and Daum, 2014). Oleaginous yeasts, such as Yarrowia lipolytica and Rhodosporidium toruloides, accumulate lipids as TAGs in response to nitrogen and phosphorus limitation (Kerkhoven et al., 2016; Zhu et al., 2015). Other non-oleaginous yeasts, such as Saccharomyces cerevisiae and Ustilago maydis, accumulate lipids as LDs in response to nitrogen starvation (Grillitsch et al., 2011; Romero-Aguilar et al., 2017).
U. maydis is a basidiomycete that belongs to the Ustilagenaceae family, which is composed of fungi that are related to the infection of several types of crops. It is studied because of its biotechnological potential for producing value added compounds such as organic acids, enzymes, lipids, and bio-surfactants, among others, with applications in the pharmaceutical, cosmetic, and food industries (Chavan and Smith, 2014; Paulino et al., 2017). As a biotrophic organism, U. maydis requires the plant to continue its growth, transiting between two forms during its cell cycle, a yeast-like saprophytic phase and a filamentous phytopathogenic phase (Chavan and Smith, 2014).
The opposite of LD formation is the process of lipolysis, which is carried out when high amounts of energy are required. The degradation of LDs takes place in two ways, One is through lipophagy, and the other by the local lipolysis of TAGs, catalyzed by cytosolic lipases (Welte, 2015). Lipases (glycerol ester hydrolases, E.C. 3.1.1.-) are hydrolases that act on the carboxyl ester bonds of the acyl-glycerols, resulting in the release of fatty acids and glycerol. In non-oleaginous yeasts, such as S. cerevisiae, it has been reported that lipases control the homeostasis between the synthesis and degradation of TAGs (Schmidt et al., 2014).
The qualitative determination of LDs in cells can be obtained through the lipid recovery of fluorescence (LRF), in which the LD index is calculated as the ratio between the fluorescence emitted by lipid droplets (stained with BODIPY® 493/503) and the cell density, measured at 600 nm. During the growth of S. cerevisiae, the LD index increases in the exponential phase and declines during the stationary phase (Bozaquel-Morais et al., 2010). This behavior was also observed for U. maydis when cultured in a YPD medium. Moreover, in this microorganism, nitrogen starvation led to a large lipid accumulation that was reverted when cells were transferred to a medium containing a nitrogen source, suggesting that TAGs can be mobilized by lipases (Romero-Aguilar et al., 2017).
In a previous work, we reported that LDs are dynamic organelles that can be mobilized when a nitrogen source is present, and we suggested that under these conditions the lipase activity should be enhanced (Romero-Aguilar et al., 2017). Here we found that LD index and lipase activity are inversely related. This suggests that lipids in LDs are degraded by lipases and then used in the growth process as an energy source (Rambold et al., 2015). Also, we detected that the intracellular extracts of cells cultured in YPD exhibited lipase activity in olive and almond oils, which suggests that these extracts hydrolyze TAGs composed of mono- and polyunsaturated FAs. This is the first report on U. maydis cytosolic lipases involved in the lipid metabolism.
2. MATERIALS AND METHODSTOP
2.1. Strains and growth conditionsTOP
U. maydis FB2 (a2b2) cells were kept in 25% glycerol at −70 °C, streaked on YPD plates (1.0% glucose, 0.25% peptone, 0.5% yeast extract and 2.0% agarose), and incubated at 28 °C for 24 h. The strain was pre-inoculated in 100 ml YPD medium (1.0% glucose, 0.25%
peptone, and 0.5% yeast extract) and shaken at 175 rpm at 28 °C for 24 h. Then, the cells were harvested by centrifugation at 1000 g for 10 min, washed twice with H2O, and inoculated in a new medium with an initial optical density at 600 nm (OD600) of 0.05 units. The yeast strain was grown in a YPD medium (yeast peptone dextrose), minimal medium without a nitrogen source
(MM-N) (1.0% glucose, 0.02% of mineral solution [5 g/L boric acid, 6.4 g/L manganese chloride tetrahydrate, 2 g/L zinc chloride, 2 g/L Ferric chloride hexahydrate, 0.4 g/L molybdic acid, 0.4 g/L copper sulfate pentahydrate and 10 g/L citric acid] with
0.5% of salt solution [32 g/L potassium phosphate, 8 g/L sodium sulfate, 16 g/L magnesium sulfate and 2 g/L calcium chloride]), and a minimal medium with nitrate (MM+N) (1.0% glucose, 0.02% of mineral solution, 0.5% of salts solution, and 0.3% NH4NO3) (Saavedra et al., 2008) at 28 °C for 72 h. For growth kinetics, 18 aliquots of cell cultures were taken every 2 h in the first 24 h, and afterwards every 3 h, measuring the OD600 in a Genesys 20 spectrophotometer (Z376035, Sigma-Aldrich, St. Louis, USA).
2.2. Lipid droplet identificationTOP
A U. maydis FB2 strain was stained with 2 μM of BODIPY 493/503 (D3922, Thermo Fisher Massachusetts, USA) and 1μg/ml of Nile Red (N1142, Thermo Fisher Massachusetts, USA); both dyes were used to stain neutral lipids in LDs. The samples were observed in an inverted Olympus Flouview™ FV1000 laser scanning with a confocal microscope with an argon laser. The Green Fluorescence Protein (GFP) filter was adjusted to excitation, 488 nm and emission 505-525 nm for the visualization of BODIPY. The Red Fluorescence Protein (RFP) filter was set to excitation, 543 nm and emission, 560-660 nm to visualize Nile Red. The software FV10-ASW (version 04.02.01.20 Olympus) was used to analyze the images.
2.3. Cell fixationTOP
To determine the LD dynamics of U. maydis FB2 grown in YPD and MM-N, aliquots were collected from the cultures and cells were fixed with formaldehyde (final concentration
3.7% v/v) for 15 min at 25 °C. The cells were then centrifuged and washed twice with HEPES buffer at pH 7.4. Finally, the cells were suspended in water and adjusted to an OD600 of 5 and stored at 4 °C until use (Bozaquel-Morais et al., 2010).
2.4. Liquid fluorescence recovery assay (LFR assay)TOP
LD dynamics were determined by the detection of the recovered fluorescence of quenched BODIPY once 5 μl of fixed cell suspension were added to 200 μl of quenched reading buffer containing 5 μM BODIPY and 500 mM KI, in 96-well black/clear flat bottom polystyrene microplates (3603, Corning, New York, USA). Samples were read in a Varioskan™ Lux (VL0000D0, Thermo Scientific, Massachusetts, USA) and the settings for fluorescence measurements were excitation at 480 nm, emission at 510 nm. At the same time, in each fluorescence reading, the cell density was determined by measuring the OD600. Each sample was read five times by adding subsequent 5-μl aliquots of the formaldehyde-fixed cell suspension to the same well. Reading blanks were prepared by incubating the reading buffer for 15 min at 30 °C without the addition of cells. Fluorescence and absorbance measurements were recorded, and the linearity of the curves was analyzed. The LD index was determined as the relative fluorescence by optical density unit (IF/IA) (Bozaquel-Morais et al., 2010).
2.5. Preparation of cytoplasmic extractTOP
Cells were disrupted with glass beads in a phosphate buffer at pH 7.0, using a bead-beater. The phosphate buffer was used instead of a conventional lysis buffer to avoid the inhibition of lipase activity by the chelator agent EDTA and the serine protease inhibitor PMSF (Snellman et al., 2002; Kanwar et al., 2005). The homogenate was centrifuged at 100,000g for 1 h at 4 °C to obtain a cell-free extract. Total protein concentration in the extract was assayed according to the Lowry method (Lowry et al., 1951).
2.6. Fluorescence-based lipase activity assays on platesTOP
To screen the lipase/esterase activity in the cytoplasmic extracts, a methylumbelliferyl-butyrate (MUF-butyrate 19362, Sigma-Aldrich, St. Louis, USA) diffusion plate assay was used. To prepare the plates, a thin base of 2% base agar (autoclaved and adjusted to pH 7.0) was poured. To prepare the top coat of the plates, MUF butyrate (25 mM stock solution) was dissolved in molten agar (cooled at 60 °C) to obtain a final concentration of 250 μM. Wells (5 mm in diameter) were obtained using a 200 μl pipet tip. Then, 40 μg of each cytoplasmic extract or the positive (Candida rugosa lipase L1754, from Sigma-Aldrich, St. Louis, USA) and negative (phosphate buffer pH 7.0) controls, were poured into each well.
The stock solution of MUF-butyrate (MUB) was made by dissolving 100 mg of MUB in 10 ml of dimethyl sulfoxide (472301, Sigma-Aldrich, St. Louis, USA) to which 100 μl of Triton X-100 were added, and stored at -70 °C.
2.7. Lipase activity assay with p-nitrophenyl palmitate (pNPP)TOP
Lipase activity was determined using a modification of the protocol of p-nitrophenyl palmitate (pNPP) described by Gupta et al., (2002). For this assay, a 0.5 mM pNPP solution was prepared by first dissolving 18 mg of pNPP in 10 ml of isopropanol and 100 μl of Triton X-100. Next, 207 mg of sodium deoxycholate were added to 90 mL of a 50 mM sodium phosphate buffer, at pH 7.0. The dissolved pNPP solution was then poured drop by drop onto the phosphate buffer with continuous vortex agitation and sonication.
Triton X-100 was added to a final concentration of 2%.
The reaction was performed at 25 °C, and it was started with the addition of 0.1 ml of the cytosolic extract to 2.4 ml of the reaction mixture. The enzymatic activity was measured by the release of p-nitrophenol which is estimated spectrophotometrically at 410 nm every 10 min for 30 min.
We determined the molar extinction coefficient (ε) of p-nitrophenol (pNP), under the conditions described, from the absorbance at λ = 410 nm of standard solutions of pNP (0.01 to
0.1 mmol/ml) (ε410= 5.01x10³ M-1cm-1).
Suitable controls were made for each experiment. One unit of enzyme activity was expressed as the amount of enzyme that catalyzes the release of 1 nmol of p-nitrophenol per minute under the assay conditions.
2.8. ZymogramTOP
Electrophoretic separation in sodium dodecyl sulfate (SDS)-polyacrylamide gels has been widely used to study lipases. A fluorescence-based assay for lipase activity detection in SDS-polyacrylamide gels was performed without the treatment of the sample with β-mercaptoethanol and using 5% and 10% polyacrylamide for the stacking and resolving of the gels, respectively. After protein separation, SDS was removed from the gels by soaking them for 30 min in a 2.5% Triton X-100 solution at room temperature. The gels were then briefly washed (5 min) in 50-mM phosphate buffer, at pH 7.0 and then covered with a solution of 100 μM MUF-butyrate in the same buffer. After UV illumination, fluorescent bands became visible in 30s. Following the zymogram analysis, the protein bands were visualized using Coomassie Brilliant Blue R250 (Brabcova et al., 2013).
2.9. Rhodamine plate assay for lipase detectionTOP
To identify the lipase activity on agar plates by this method, the use of trioleoylglycerol or a substitute such as olive oil is common. The catalytic activity of lipases on TAGs present in olive and almond oils was revealed with the Rhodamine dye which produced an orange fluorescence that was detected by UV irradiation (Kouker and Jaeger, 1987).
For this assay, a stock solution of Rhodamine B (1 mg/ml) was prepared in distilled water and subsequently sterilized by filtration.
The plate was constructed in two layers. The bottom one contained 2% sterile agar (pH 7.0). The top coat medium was made with cooled 2% agar with olive or almond oil to a final concentration of 2.5% and rhodamine B to a final concentration of 0.001%.
Before pouring the top layer, it was vigorously stirred and emulsified by sonication. We added 100 μg of the extract and positive
(C. rugosa) and negative (Phosphate buffer) controls, into the wells.
3. RESULTSTOP
3.1. The growth of U. maydis is different in rich medium and under nitrogen starvation.TOP
In this study, U. maydis was grown for 72 hours in YPD and minimal medium without a nitrogen source (MM-N) (Figure 1). The cells were also grown in a minimal medium with nitrate as nitrogen source (MM+N) (data not shown). In YPD, the cells exhibited an exponential growth during the first 10-12 h, with a duplication time of 2.6 ± 0.3 h, and reached the stationary phase at 24 h (Figure 1A). Similar results were obtained in MM+N, with cells reaching the stationary phase at 24 h and a duplication time of 2.8 ±
0.2 (data not shown). In MM-N, the cells showed a short exponential phase with a duplication time of 4.9 ± 0.7 h, and then at 24 h stopped their growth (Figure 1A). This suggests that cells without nitrogen sources used glucose as the carbon source and stopped their growth because of the lack of nitrogen. Since no differences were detected between the growth rate in YPD and MM+N, the work was continued with the rich YPD and MM-N to compare the growth, LD index, and lipase activity.
|
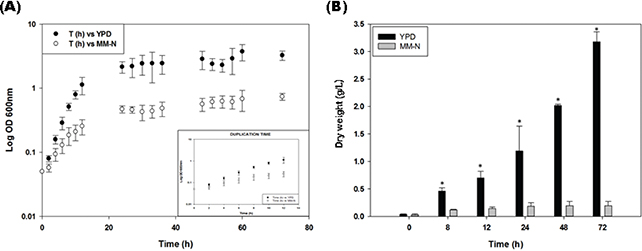 Figure 1. Growth of Ustilago maydis FB2 wt. (A) Growth curve (OD) in YPD medium (black dots) and in a minimal medium without nitrogen (MM-N) (white dots). (B) Dry weight (g/L) in YPD medium (black bars), and in MM-N (white bars). Figure 1. Growth of Ustilago maydis FB2 wt. (A) Growth curve (OD) in YPD medium (black dots) and in a minimal medium without nitrogen (MM-N) (white dots). (B) Dry weight (g/L) in YPD medium (black bars), and in MM-N (white bars).
The experiment was carried out in triplicate. The Student’s t-test was used for comparison of means. Values are given as mean ±SD of three batches. Significant difference at a level of P < 0.001 between U. maydis FB2 cells grown in YPD and MM-N in each time is designated by “*”.
|
|
The large difference in cell growth between YPD and MM-N is better appreciated by plotting the dry weight. Figure 1B shows the increase in biomass associated with cell growth. It can be appreciated that the final biomass obtained in the YPD medium at 72 h of incubation was 16 times larger than the biomass of cells cultured without a nitrogen source. At 8 h of growth there was a small difference (4 times), from 12 -24 h the differences in biomass started to rise because the dry weight of the cells cultured in MM-N remained constant.
3.2. Accumulation of neutral lipids in LDs is influenced by nitrogen availabilityTOP
We previously reported the accumulation of lipids as LDs in U. maydis under nitrogen starvation (MM-N) (Zavala-Moreno et al., 2014). Also, the dynamics of LDs under different nitrogen sources were analyzed (Romero-Aguilar et al., 2017). To have a better understanding of the dynamics of the formation and degradation of LDs, both processes were studied separately under the conditions mentioned above (YPD and MM-N).
To study the accumulation of lipids a liquid recovery of fluorescence assay (LRF) was performed, using the fluorophore BODIPY 493/503, which has a high affinity to neutral lipids. The results showed that in cells growing in YPD medium there was a small increase in the LD index associated with the exponential phase, followed by a decrease in this index during the stationary phase (Figure 2, black dots). However, under nitrogen starvation the LD index increased steadily throughout the 72 h of growth (Figure 2, white dots), suggesting that in MM-N a large accumulation of lipids occurred. This can be corroborated by observing the cells under confocal microscopy. Cells were cultured in MM-N for 72 hours and stained with BODIPY and Nile Red, which were used to stain neutral lipids (TAGs). As shown in figure 3A, the cells displayed large refracting structures by light microscopy. LDs were visualized by confocal microscopy after the incubation of the cells with Nile red and BODIPY (Figure 3B, C). Figure 3D shows the colocalization of the signals coming from both dyes, indicating that LDs are made mainly of neutral lipids. Under electronic microscopy, transmission (Figure 3E) and scanning (Figure 3F) micrographs show that the LDs accumulated in the cytosol did not affect the shape of the cells.
|
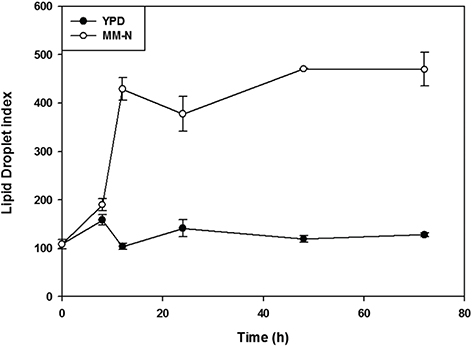 Figure 2. Lipid droplet index (LD index) of U. maydis FB2 wt grown in YPD medium (black) and in MM-N (white). The experiment was carried out in triplicate. Values are given as mean ±SD of three batches. Figure 2. Lipid droplet index (LD index) of U. maydis FB2 wt grown in YPD medium (black) and in MM-N (white). The experiment was carried out in triplicate. Values are given as mean ±SD of three batches.
|
|
|
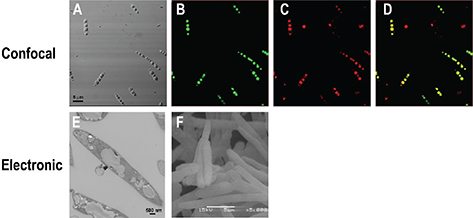 Figure 3. Microscopy of U. maydis FB2 wt grown in MM-N at 72 hours. (A) Light microscopy; confocal microscopy of cells stained with BODIPY (B) and Nile Red (C), and the merged image (D); transmission electron microscopy (E) and scanning electron microscopy (F). Figure 3. Microscopy of U. maydis FB2 wt grown in MM-N at 72 hours. (A) Light microscopy; confocal microscopy of cells stained with BODIPY (B) and Nile Red (C), and the merged image (D); transmission electron microscopy (E) and scanning electron microscopy (F).
|
|
3.3. Cytosolic lipase activity is related to the accumulation of LDs TOP
To detect the lipase/esterase activity in the cytoplasmic extracts, a fluorescence plate assay that contained the substrate MUF-butyrate was used. Figure 4 shows the activity of lipase in extracts obtained from 8 to 72 hours of culture in both YPD and MM-N media. Cytosolic extracts from YPD had a higher lipase activity than those from MM-N. Only the MM-N extracts obtained at 8 and 12 hours exhibited activity.
To corroborate the presence of lipase activity in these extracts, a biochemical assay was performed as indicated in the Materials and Methods section. Figure 5 shows that lipase activity increased throughout the culture time in the YPD medium, in comparison with the nitrogen starvation condition, in which there was no activity after 24 h. Taking together the results of LD index and lipase activity, suggests that the formation and degradation of LD are two processes that are connected and regulated by the lipase activity.
|
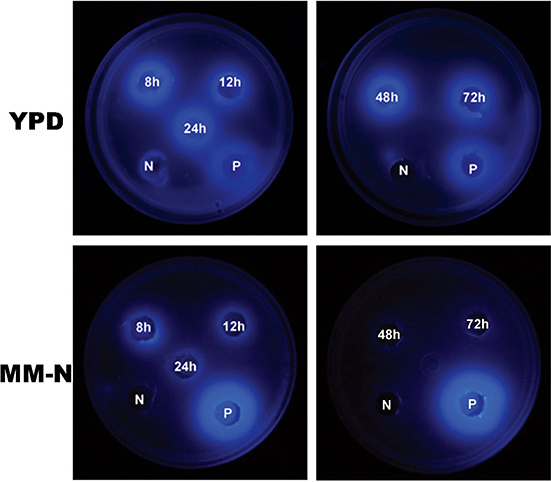 Figure 4. Lipase activity of cytoplasmic extracts from U. maydis FB2 wt grown in YPD medium and MM-N. MUF-butyrate at a final concentration of 250 μM was used as substrate. Positive control (P): C. rugosa lipase (L1754 from Sigma-Aldrich, St. Louis, USA). Negative control (N): Phosphate buffer pH 7.0. Figure 4. Lipase activity of cytoplasmic extracts from U. maydis FB2 wt grown in YPD medium and MM-N. MUF-butyrate at a final concentration of 250 μM was used as substrate. Positive control (P): C. rugosa lipase (L1754 from Sigma-Aldrich, St. Louis, USA). Negative control (N): Phosphate buffer pH 7.0.
|
|
|
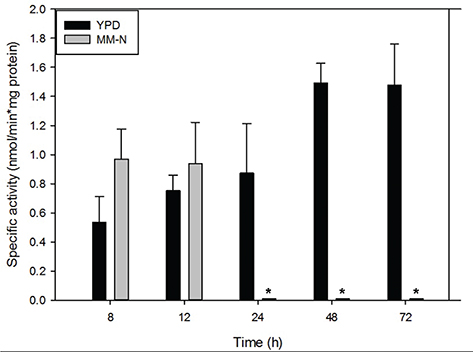 Figure 5. Specific lipase activity of cytoplasmic extracts from U. maydis FB2 wt grown in YPD medium (black bars) and MM-N (grey bars). The experiment was carried out in triplicate. The Student’s t-test was used for comparison of means. Values are given as mean ±SD of three batches. Significant difference at a level of P < 0.001 between U. maydis FB2 cells grown in YPD and MM-N in each time is designated by “*”. Figure 5. Specific lipase activity of cytoplasmic extracts from U. maydis FB2 wt grown in YPD medium (black bars) and MM-N (grey bars). The experiment was carried out in triplicate. The Student’s t-test was used for comparison of means. Values are given as mean ±SD of three batches. Significant difference at a level of P < 0.001 between U. maydis FB2 cells grown in YPD and MM-N in each time is designated by “*”.
|
|
3.4. Detection of two bands with lipase activity by a zymogramTOP
To visualize the lipase activity contained in the cytosolic extracts of cells grown in YPD and MM-N media, zymograms with MUF-butyrate as substrate were performed. Two bands of around 25 and 37 kDa with lipase/esterase activity were observed in the gel (Figure 6 lane 3-7). The lipase of C. rugosa, used as control, exhibited good activity by this method, demonstrating that the assay is accurate; in addition, it is important to mention that the band with the activity corresponding to the C. rugosa lipase had a different molecular weight than the two bands observed in the U. maydis extracts (Figure 6). In YPD, the band of 37 kDa showed up at 8 h of culture and increased its activity at longer times. The lipase activity of the 25 kDa band was approximately the same along the growth curve. In the MM-N extracts there was lower lipase activity than in YPD, and only at 12 h of culture were the two bands present.
|
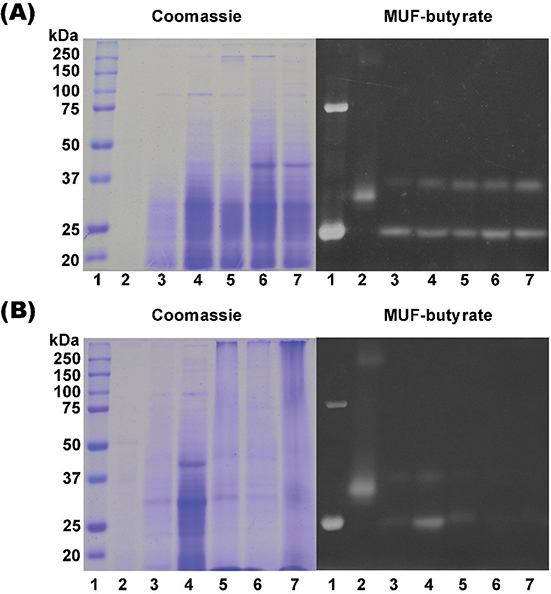 Figure 6. Zymogram analysis. Cytoplasmic extracts from U. maydis FB2 wt grown in YPD medium (A) and MM-N (B) at different times (lanes 3-7: 8h, 12h, 24h, 48h, 72h) were loaded (100 μg) without boiling and β-mercaptoethanol on a 10% SDS-polyacrylamide gel and analyzed for activity using 100μM MUF-butyrate (right) and subsequently stained with Coomassie® Brillant Blue R-250 (left). (B) Precision Plus Protein Standards Dual Color molecular weight marker was used (lane 1). Control: C. rugosa lipase (L1754 from Sigma-Aldrich, St. Louis, USA) (lane 2). Figure 6. Zymogram analysis. Cytoplasmic extracts from U. maydis FB2 wt grown in YPD medium (A) and MM-N (B) at different times (lanes 3-7: 8h, 12h, 24h, 48h, 72h) were loaded (100 μg) without boiling and β-mercaptoethanol on a 10% SDS-polyacrylamide gel and analyzed for activity using 100μM MUF-butyrate (right) and subsequently stained with Coomassie® Brillant Blue R-250 (left). (B) Precision Plus Protein Standards Dual Color molecular weight marker was used (lane 1). Control: C. rugosa lipase (L1754 from Sigma-Aldrich, St. Louis, USA) (lane 2).
|
|
3.5. Cytoplasmic extracts from cells cultured in YPD exhibited lipase activity in TAGs from olive and almond oils.TOP
The Rhodamine plate assay using olive, almond, and avocado oils was used to explore the specificity of the lipase activity.
These oils contain TAGs with palmitic, oleic and linoleic fatty acids. The extracts presented lipase activity in both, olive and almond oils, but the activity was better detected when olive oil was used. The highest activity was obtained from 8 to
24 h in olive oil, and for almond oil it was at 12 and 24 h (Figure 7). Avocado oil was also tested, but with this oil there was no activity (data not shown).
|
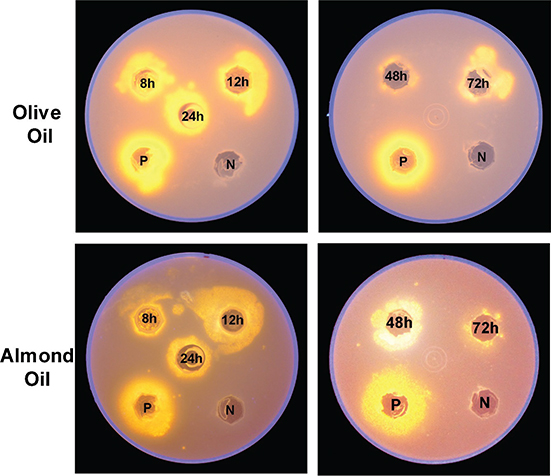 Figure 7. Identification of lipase activity on rhodamine B with 2.5% olive (upper panel) or almond (lower) oil agar plates using cytoplasmic extracts obtained from U. maydis FB2 wt grown in YPD medium at different times (8, 12, 24, 48, 72 h). After incubation for 48 h at 28 °C plates were subjected to UV irradiation (350 nm) and photographed. Positive control (P): C. rugosa lipase (L1754 from Sigma-Aldrich, St. Louis, USA). Negative control (N): Phosphate buffer pH 7.0. Figure 7. Identification of lipase activity on rhodamine B with 2.5% olive (upper panel) or almond (lower) oil agar plates using cytoplasmic extracts obtained from U. maydis FB2 wt grown in YPD medium at different times (8, 12, 24, 48, 72 h). After incubation for 48 h at 28 °C plates were subjected to UV irradiation (350 nm) and photographed. Positive control (P): C. rugosa lipase (L1754 from Sigma-Aldrich, St. Louis, USA). Negative control (N): Phosphate buffer pH 7.0.
|
|
4. DISCUSSIONTOP
U. maydis is an aerobic fungus that can grow under different nutritional conditions. It has been reported that U. maydis yeasts grown in YPD, MM+N and MM-N accumulate different concentrations of lipids (Zavala-Moreno et al., 2014). In a previous study, it was reported that cells grown in YPD and MM+N exhibited similar growth kinetics and duplication times (around 2.5 h) (Romero-Aguilar et al., 2017). Also, cells cultured in YPD and MM+N exhibited, within the experimental error, the same changes in the LD index during the growth curve, in comparison with the large increase in LD index in cells cultured in MM-N (Romero-Aguilar et al., 2017). Since we did not see any difference between YPD and MM+N in this study, it was decided to compare the growth rate, LD index and lipase activity of cells grown in rich YPD and MM-N media.
Cells in YPD exhibited a duplication time of 2.6 ± 0.3 h and reached the stationary phase at 24 h. On the other hand, cells grown in MM-N showed a short exponential phase with a duplication time of 4.9 ± 0.7 h (Figure 1A). In this condition, an increase of six times the initial biomass (0.0322 g) occurred in the first 24 h, and then there was no change in the biomass, measured as dry weight. This result suggests that cells cultured under nitrogen starvation stopped their growth due to nitrogen deficiency. The early increase in biomass is probably due to the autophagic processes in which the degradations of ribosomes, RNA and cytosol proteins have been described (Rambold et al., 2015).
The growth of U. maydis in the absence of a nitrogen source induced a large accumulation of lipids inside the cell (Zavala-Moreno et al., 2014), a response that has been observed in other organisms, including R. toruloides (Li et al., 2015; Zhu et al., 2015). The lipid index is a well-established technique for the qualitative measurement of neutral lipids in cells (Bozaquel-Morais et al., 2010), and the accumulation of LDs in U. maydis under nutritional nitrogen stress was clearly detected by the increase in LD index and by confocal microscopy, using Nile Red and BODIPY, two specific dyes for neutral lipids stored in LDs
It has been shown that one lipase is included in the structure of U. maydis LDs, but it was not assayed (Romero-Aguilar et al., 2017). However, this study was performed to analyze cytosolic lipases that are present in the intracellular extracts of U. maydis cells grown under different nutritional conditions. The methods reported for lipase activity are based on the ability of these enzymes to hydrolyze the ester bond between a fatty acid and a compound that can be detected by changes in fluorescence or absorbance (Kumar et al., 2012; Perez et al., 2011; Brabcova et al., 2013). First, the presence of intracellular lipases was investigated using the fluorescent dye MUF-butyrate on agar plates, and for quantitative determinations, pNP-palmitate was used. The use of p-nitrophenyl palmitate as a substrate to quantitatively determine lipase activity has been shown to be efficient in Bacillus sp. strain DVL2 (Kumar et al., 2012). With these assays it was demonstrated that cells grown in YPD contained higher lipase activity than those cultured without a nitrogen source. Using MUF-butyrate as substrate, two bands displayed lipase activity in the zymogram. The molecular masses of these proteins are higher than the C. rugose lipase. The rhodamine assay was adapted by using agar plates covered with a mixture of agar, rhodamine, and vegetal oils to study the specificity of U. maydis lipases. This method has been widely used to detect extracellular and intracellular lipases in organisms such as Bacillus sp. strain DVL2 bacteria (Kumar et al., 2012). The activity in the YPD extracts was higher at 12 h in olive and almond oils. The main FAs in the TAGs of olive oil are represented by oleic acid, a monounsaturated omega-9 FA (55 to 83%), with an amount of saturated FAs, palmitic (7.5 to 20%)
and stearic (0.5 to 5%) acids, and an adequate presence of polyunsaturated FAs, linoleic acid (3.5 to 21%) and α-linolenic acid (0 to 1.5%) (Table 1) (Bermudez et al., 2011). The most prevalent TAG in olive oil is the one containing oleic-oleic-oleic (OOO), followed by palmitic-oleic-oleic (POO), oleic-oleic-linoleic (OOL), palmitic-oleic-linoleic (POL), and stearic-oleic-oleic (SOO) (Ortega et al., 2012). Almond oil is the conventional nut oil with the highest content in TAGs, about 98%; in the almond lipid fraction, five fatty acids are predominant: oleic, linoleic, palmitic, palmitoleic and stearic acids (Roncero et al., 2016). Givianrad et al., (2013) found a TAG profile very similar to olive oil in oil from wild almonds, observing the following composition which goes from high to low contents: OOO > POO+SOL > OOL+ PLnP, where O represents oleic acid, L linoleic acid, P palmitic acid, S stearic acid and Ln linolenic acid.
Table 1. Lipid content of fatty acids and triacylglycerols in olive oil, almond oil, and avocado oil.
| FATTY ACIDS |
Olive Oila (%) |
Almond Oilb (%) |
Avocado oilc (%) |
| Saturated |
| Palmitic acid (16:0) |
7.5-20.0 |
5.2-6.7 |
16.9 |
| Stearic acid (18:0) |
0.5-5.0 |
0.2-1.7 |
0.8 |
| Mono-unsaturated |
| Palmitoleic acid (C16:1) |
1.2 |
0.3-0.6 |
7.7 |
| Oleic acid (C18:1) |
55.0-83.0 |
57.5-78.7 |
50.3 |
| Poly-unsaturated |
| Linoleic acid (C18:2 ω6) |
3.5-21.0 |
12.0-33.9 |
10.5 |
| Linolenic acid (ALA)g (C18:3 ω3) |
0-1.5% |
- |
0.6 |
| OILS |
TRIACYLGLYCERIDE COMPOSITION |
| Olive Oild |
OOO>POO>OOL>POL>SOOh |
| Almond Oile |
OOO > POO+SOL > OOL > PLnPh |
| Avocado Oilf |
Malaysia avocado: POO> POL > OOO > PPOh
Hass avocado: OOO > POO > OOL > POLh |
* Source: aBermudez et al. (2011), bRoncero et al. (2016), cVingering et al. (2010), dOrtega et al. (2012), eGivianrad et al. (2013) and fYanty et al. (2011).
gAlpha linolenic acid.
hOleic acid: O, Stearic acid: S, Palmitic acid: P, Linoleic acid: L, Linolenic acid: Ln. |
Of the three oils used in this study, avocado oil contains the highest concentration of palmitic acid (Vingering et al., 2010). The triglyceride profile of avocado oil from various cultivars in Malaysia was POO, followed by POL, OOO and PPO, while the major triglycerides in the Hass avocado variety imported from Australian were OOO, followed by POO, OOL and POL. In comparison with olive and almond oils, the major TAGs in avocado oil are composed of palmitic acid, which is a saturated FA (Yanty et al., 2011). The specific composition of avocado oil is a likely explanation for the lack of activity of U. maydis cytosolic lipases when this oil was used as substrate, a result that contrasts with that obtained with the almond and olive oils.
By proteomic analysis, it was found that U. maydis contains a lipase associated with the LDs (Romero-Aguilar et al., 2017). This enzyme could participate in the mobilization of LDs. In silico analysis of the U. maydis genome reported 21 genes with codes to hypothetical lipases, but only two lipases, CalA and CalB, have been characterized, and neither of these two enzymes has been implicated in the mobilization of LDs in this yeast (Brundiek et al., 2012; Buerth et al., 2014). However, it is not unreasonable to think that TAGs stored in the LDs are degraded by a cascade of hydrolytic reactions that converts TAGs into diacylglycerol (DG), monoacylglycerol (MG) and finally glycerol and fatty acids (FA) that could be used for β-oxidation in mitochondria (Rambold et al., 2015), suggesting that the full degradation of TAGs might be carried out by a group of lipases. Further studies are required to identify and characterize the lipases implicated in the mobilization of TAGs from LDs.
Most of the industrial enzymes are of microbial origin, mainly because of their economic and environmental advantages such as easy handling, faster growth, and less waste production, compared with pluricellular organisms (Berhanu and Amare, 2012). In this sense, lipases and esterases are relevant in biotechnology because of their wide industrial and medical applications. Lipases have been described and characterized in many bacteria such as Marinobacter lipolyticus SM19, in which an intracellular lipase with a molecular mass of 45.3 kDa has been reported (Pérez et al., 2011).
Lipases have also been described in several yeasts. S. cerevisiae contains three lipases that are related to the mobilization of TAGs: Tgl3p, Tgl4p, and Tgl5p (Athenstaedt and Daum, 2003; Athenstaedt and Daum, 2005). Tgl3p was discovered in LDs through proteomic studies (Athenstaedt and Daum, 2003). Another lipase described in this yeast was Ypr147cp, which is also located in LDs, playing an important role in the mobilization of TAGs from LDs (Manda et al., 2017). It is known that one of the major TAG lipases, Tgl3p, preferentially uses TAGs that contain C14:0, C16:0 and C26:0 fatty acids (Athenstaedt and Daum, 2003). Another yeast, Y. lipolytica possesses 16 genes coding for lipases, but only three isoenzymes, Lip2p, Lip7p, and Lip8p have been characterized (Fickers et al., 2011).
Microbial lipases have applications in the pharmaceutical field. Y. lipolytica lipase LIP2p has been proposed as replacement therapy for the treatment of pancreatic exocrine deficiency (Benarouche et al., 2014). However, intracellular lipases of U. maydis have not been studied or characterized, opening the possibility that these enzymes might have biotechnological and pharmacological interest.
An alternative source of energy is biodiesel, which has been produced chemically using oil from various plants. The conversion of vegetable oil to methyl- or other short-chain alcohol esters is catalyzed by lipases. Some microbial lipases are used for this purpose in the industry, one is the lipase (LipSB 25-4) of Streptomyces bambergiensis OC 25-4, which displayed high activity under thermophilic conditions and is stable in the presence of organic solvents. LipSB 25-4 catalyzed the biodiesel production from olive oil through transesterification reactions (Ugur et al., 2014). Cytoplasmic lipases of U. maydis could be proposed as an alternative in the generation of biodiesel.
CONCLUSIONSTOP
In this study we reported that U. maydis grown under nitrogen starvation increased its lipid droplet index but decreased lipase activity in comparison with cells cultured in a YPD medium, which decreased their lipid droplet index and increased lipolytic activity, indicating that the accumulation and degradation of lipids are opposed processes that maintain lipid homeostasis in the cell. The lipases detected by zymogram showed a molecular mass of 25 and 37 kDa. U. maydis lipases hydrolyzed TAGs present in olive and almond oils, which are composed principally of mono and polyunsaturated fatty acids. This indicates that intracellular lipases of U. maydis have hydrolytic activity in TAGs, suggesting that they could be involved in the mobilization of the neutral lipids accumulated in LDs.
ACKNOWLEDGMENTSTOP
This work is part of the Ph.D. studies of Minerva Georgina Araiza Villanueva who received a scholarship from CONACYT-México (290934). This work was supported by grants IPN-SIP-20160999 and 20180625, Programa de Apoyo a Proyectos de Investigación e Innovación Tecnológica (PAPIIT IN222117), Universidad Nacional Autónoma de México (UNAM), and Consejo Nacional de Ciencia y Tecnología (CONACyT 256520-GGS and 254904-JPP).
We thank the Unidad de Microscopía Avanzada (UMAC) of the Centro de Investigación Científica y de Educación Superior de Ensenada, Baja California (CICESE) and Dr. Diego Álvarez Delgado for technical support with the Confocal Microscopy.
REFERENCESTOP
| ○ |
Athenstaedt K, Daum G. 2003. YMR313c/TGL3 encodes a novel triacylglycerol lipase located in lipid particles of Saccharomyces cerevisiae. J. Biol. Chem. 278, 23317–23323. https://doi.org/10.1074/jbc.M302577200 |
| ○ |
Athenstaedt K, Daum G. 2005. Tgl4p and Tgl5p, two triacylglycerol lipases of the yeast Saccharomyces cerevisiae are localized to lipid particles. J. Biol. Chem. 280, 37301–37309. https://www.ncbi.nlm.nih.gov/pubmed/16135509 |
| ○ |
Benarouche A, Point V, Carriere F, Cavalier JF. 2014. An interfacial and comparative in vitro study of gastrointestinal lipases and Yarrowia lipolytica LIP2 lipase, a candidate for enzyme replacement therapy. Biochimie 102, 145–153. https://doi.org/10.1016/j.biochi.2014.03.004 |
| ○ |
Berhanu A, Amare G. 2012. Microbial lipases and their industrial applications: Review. Biotechnology 11, 100–118. https://doi.org/10.3923/biotech.2012.100.118 |
| ○ |
Bermudez B, Lopez S, Ortega A, Varela LM, Pacheco YM, Abia R, Muriana FJG. 2011. Oleic acid in olive oil: from a metabolic framework toward a clinical perspective. Current Pharmaceutical Design 17, 831–843. https://doi.org/10.2174/138161211795428957 |
| ○ |
Bozaquel-Morais BL, Madeira JB, Maya-Monteiro CM, Masuda CA, Montero-Lomeli M. 2010. A new fluorescence-based method identifies protein phosphatases regulating lipid droplet metabolism. PLoS One 5, e13692. https://doi.org/10.1371/journal.pone.0013692 |
| ○ |
Brabcova J, Prchalova D, Demianova Z, Bucankova A, Vogel H, Valterova I, Pichova I, Zarevucka M. 2013. Characterization of neutral lipase BT-1 isolated from the labial gland of Bombus terrestris males. PLoS One 8, e80066. https://doi.org/10.1371/journal.pone.0080066 |
| ○ |
Brundiek H, Sass S, Evitt A, Kourist R, Bornscheuer UT. 2012. The short form of the recombinant CAL-A-type lipase UM03410
from the smut fungus Ustilago maydis exhibits an inherent trans-fatty acid selectivity. Appl. Microbiol. Biotechnol. 94, 141–150. https://doi.org/10.1007/s00253-012-3903-9 |
| ○ |
Buerth C, Kovacic F, Stock J, Terfruchte M, Wilhelm S, Jaeger KE, Feldbrugge M, Schipper K, Ernst JF, Tielker D. 2014. Uml2
is a novel CalB-type lipase of Ustilago maydis with phospholipase A activity. Appl. Microbiol. Biotechnol. 98, 4963–4973. https://doi.org/10.1007/s00253-013-5493-6 |
| ○ |
Chavan S, Smith SM. 2014. A rapid and efficient method for assessing pathogenicity of Ustilago maydis on maize and teosinte lines. J. Vis. Exp. 83. e50712. https://doi.org/10.3791/50712 |
| ○ |
Fickers P, Marty A, Nicaud JM. 2011. The lipases from Yarrowia lipolytica: genetics, production, regulation, biochemical characterization and biotechnological applications. Biotechnol. Adv. 29, 632–644. https://doi.org/10.1016/j.biotechadv.2011.04.005 |
| ○ |
Givianrad MH, Saber-Tehrani M, Jafari Mohammadi SA. 2013. Chemical composition of oils from wild almond (Prunus scoparia) and wild pistachio (Pistacia atlantica). Grasas Aceites 64 (1), 77–84. |
| ○ |
Grillitsch K, Connerth M, Kofeler H, Arrey TN, Rietschel B, Wagner B, Karas M, Daum G. 2011. Lipid particles/droplets of the yeast Saccharomyces cerevisiae revisited: lipidome meets proteome. Biochim. Biophys. Acta 1811, 1165–1176. https://doi.org/10.1016/j.bbalip.2011.07.015 |
| ○ |
Gupta N, Rathi P, Gupta R. 2002. Simplified para-nitrophenyl palmitate assay for lipases and esterases. Analytical Biochemistry 311, 98–99. https://doi.org/10.1016/s0003-2697(02)00379-2 |
| ○ |
Kanwar SS, Kaushal RK, Jawed A, Gupta R, Chimni SS. 2005. Methods for inhibition of residual lipase activity in colorimetric assay: a comparative study. Indian J. Biochem. Biophys. 42, 233–237. |
| ○ |
Kerkhoven EJ, Pomraning KR, Baker SE, Nielsen J. 2016. Regulation of amino-acid metabolism controls flux to lipid accumulation in Yarrowia lipolytica. Npj Systems Biology and Applications 2, 16005. https://doi.org/10.1038/npjsba.2016.5 |
| ○ |
Klug L, Daum G. 2014. Yeast lipid metabolism at a glance. FEMS Yeast Res. 14, 369–388. https://doi.org/10.1111/1567-1364.12141 |
| ○ |
Kouker G, Jaeger KE. 1987. Specific and sensitive plate assay for bacterial lipases. Appl. Environ. Microbiol. 53, 211–213. |
| ○ |
Kumar D, Kumar L, Nagar S, Raina C, Parshad R, Gupta V. 2012. Screening, isolation and production of lipase/esterase producing
Bacillus sp. strain DVL2 and its potential evaluation in esterification and resolution reactions Arch. Appl. Sci. Res. 4, 1763–1770. |
| ○ |
Li D, Song JZ, Li H, Shan MH, Liang Y, Zhu J, Xie Z. 2015. Storage lipid synthesis is necessary for autophagy induced by nitrogen starvation. FEBS Lett. 589, 269–276. https://doi.org/10.1016/j.febslet.2014.11.050 |
| ○ |
Lowry OH, Rosebrough NJ, Farr AL, Randall RJ. 1951. Protein measurement with the Folin phenol reagent. J. Biol. Chem. 193, 265–275. |
| ○ |
Manda NK, Thunuguntla VBSC, Bokka C, Singh BJ. 2017. Ymr210wp leads to the accumulation of phospholipids and steryl esters in yeast. Bioinformation 13, 360–365. https://doi.org/10.6026/97320630013360 |
| ○ |
Ortega A, Varela LM, Bermudez B, Lopez S, Muriana FJG, Abia R. 2012. Nutrigenomics and atherosclerosis: The postprandial and long-term effects of virgin olive oil ingestion, in Parthasarathy S (ed) Atherogenesis. IntechOpen, Shangai, 135–160. https://doi.org/10.5772/26141 |
| ○ |
Paulino BN, Pessoa MG, Molina G, Kaupert Neto AA, Oliveira JVC, Mano MCR, Pastore GM. 2017. Biotechnological production of value-added compounds by ustilaginomycetous yeasts. Appl. Microbiol. Biotechnol. 101, 7789–7809. https://doi.org/10.1007/s00253-017-8516-x |
| ○ |
Perez D, Martin S, Fernandez-Lorente G, Filice M, Guisan JM, Ventosa A, Garcia MT, Mellado E. 2011. A novel halophilic lipase, LipBL, showing high efficiency in the production of eicosapentaenoic acid (EPA). PLoS One 6, e23325. https://doi.org/10.1371/journal.pone.0023325 |
| ○ |
Rambold AS, Cohen S, Lippincott-Schwartz J. 2015. Fatty acid trafficking in starved cells: regulation by lipid droplet lipolysis, autophagy, and mitochondrial fusion dynamics. Dev. Cell 32, 678–692. https://doi.org/10.1016/j.devcel.2015.01.029 |
| ○ |
Romero-Aguilar L, Pardo JP, Montero-Lomeli M, Luqueño-Bocardo OI, Juarez Oropeza MA, Guerra Sanchez G. 2017. Lipid droplets accumulation and other biochemical changes induced in the fungal pathogen Ustilago maydis under nitrogen-starvation. Arch. Microbiol. 199, 1195–1209. https://doi.org/10.1007/s00203-017-1388-8 |
| ○ |
Roncero JM, Álvarez-Ortí M, Pardo-Giménez A, Gómez R, Rabadán A, Pardo JE. 2016. Virgin almond oil: Extraction methods and composition. Grasas Aceites 67, e143. https://doi.org/10.3989/gya.0993152 |
| ○ |
Saavedra E, Ramos-Casillas LE, Marin-Hernandez A, Moreno-Sanchez R, Guerra-Sanchez G. 2008. Glycolysis in Ustilago maydis. FEMS Yeast Res. 8, 1313–1323. https://doi.org/10.1111/j.1567-1364.2008.00437.x |
| ○ |
Schmidt C, Athenstaedt K, Koch B, Ploier B, Korber M, Zellnig G, Daum G. 2014. Defects in triacylglycerol lipolysis affect synthesis of triacylglycerols and steryl esters in the yeast. Biochim. Biophys. Acta 1842, 1393–1402. https://doi.org/10.1016/j.bbalip.2014.07.001 |
| ○ |
Snellman EA, Sullivan ER, Colwell RR. 2002. Purification and properties of the extracellular lipase, LipA, of Acinetobacter sp. RAG-1. European Journal of Biochemistry 269, 5771–5779. https://doi.org/10.1046/j.1432-1033.2002.03235.x |
| ○ |
Ugur A, Sarac N, Boran R, Ayaz B, Ceylan O, Okmen G. 2014. New lipase for biodiesel production: Partial purification and pharacterization of LipSB 25–4. ISRN Biochem. 2014, 289749. https://doi.org/10.1155/2014/289749 |
| ○ |
Vingering N, Oseredczuk M, du Chaffaut L, Ireland J, Ledoux M. 2010. Fatty acid composition of commercial vegetable oils from the French market analysed using a long highly polar column. OCL 17, 185–192. https://doi.org/10.1051/ocl.2010.0309 |
| ○ |
Welte MA. 2015. Expanding roles for lipid droplets. Curr. Biol. 25, R470–481. https://doi.org/10.1016/j.cub.2015.04.004 |
| ○ |
Yanty NAM, Marikkar JMN, Long K. 2011. Effect of varietal differences on composition and thermal characteristics of avocado oil. J.A.O.C.S. 88, 1997–2003. https://doi.org/10.1007/s11746-011-1877-x |
| ○ |
Zavala-Moreno A, Arreguin-Espinosa R, Pardo JP, Romero-Aguilar L, Guerra-Sánchez G. 2014. Nitrogen source affects glycolipid production and lipid accumulation in the phytopathogen fungus Ustilago maydis. Advances in Microbiology 4, 934–944. https://doi.org/10.4236/aim.2014.413104 |
| ○ |
Zhu Z, Ding Y, Gong Z, Yang L, Zhang S, Zhang C, Lin X, Shen H, Zou H, Xie Z, Yang F, Zhao X, Liu P, Zhao ZK. 2015. Dynamics of the lipid droplet proteome of the oleaginous yeast Rhodosporidium toruloides. Eukaryot Cell 14, 252–264. https://doi.org/10.1128/EC.00141-14 |