Nutritional value of fatty acids of the Neotropical freshwater fishes Prochilodus magdalenae, Pseudoplatystoma magdaleniatum and Ageneiosus pardalis
P.M. Márquez-Fernándeza, E.J. Márquezb, O.S. Ruiz-Villadiegob and D.M. Márquez-Fernándeza, *
aFacultad de Ciencias Farmacéuticas y Alimentarias, Universidad de Antioquia UdeA, Calle 70 No. 52-21, Medellín, Colombia.
bFacultad de Ciencias, Universidad Nacional de Colombia, Calle 59A No 63-20 Bloque 19 A Laboratorio 310, Medellín, Colombia.
*Corresponding author: diana.marquez@udea.edu.co
| |
SUMMARY
This study aimed to determine the nutritional value of the fatty acids in the freshwater fish Prochilodus magdalenae, Pseudoplatystoma magdaleniatum and Ageneiosus pardalis during dry and wet Neotropical seasons with the view to generate useful information for nutrition and sustainable commercial exploitation. The analysis of fatty acids was performed by gas chromatography–mass spectrometry and the nutritional value was calculated using five estimators: n-6/n-3 ratio, unsaturation index (UI), atherogenicity index (AI), thrombogenicity index (TI) and ratio of hypocholesterolemic/hypercholesterolemic (h/H) fatty acids. A different number of fatty acids (P. magdaleniatum = 50, P. magdalenae = 41, and A. pardalis = 32) was identified for each species and the average abundance percentages were different in the two seasons (p < 0.05). Prochilodus magdalenae and P. magdaleniatum showed healthy n-6/n-3 ratios (1.04 and 2.72) in the different seasons. Although the three species showed low values of UI (0.37–0.63), the remaining nutritional indexes were within the healthy range (AI: 0.04–0.70, TI: 0.66–1.07, h/H: 0.80 – 24.40). Multivariate analysis showed similar healthy nutritional values for the species, with exception of P. magdaleniatum.
|
| |
RESUMEN
Valor nutricional de los ácidos grasos de los peces de agua dulce neotropicales Prochilodus magdalenae, Pseudoplatystoma magdaleniatum y Ageneiosus pardalis. En este estudio se determinó el valor nutricional de ácidos grasos presentes en las especies P. magdaleniatum, P. magdalenae y A. pardalis en los periodos lluvioso y seco, con el fin de generar información útil para una nutrición saludable y una explotación comercial sostenible. El análisis de los ácidos grasos se realizó por CG-EM y el valor nutricional se estimó mediante relación n-6/n-3, índices de insaturación (II), aterogenicidad (IA), trombogenicidad (IT) y relación de ácidos grasos hipocolesterolémicos/hipercolesterolémicos (h/H). Se identificaron números diferentes de ácidos grasos en cada especie (P. magdaleniatum = 50, P. magdalenae = 41 and A. pardalis = 32) y las medias de los porcentajes mayoritarios fueron diferentes en los dos periodos (p<0,05). Las especies P. magdalenae y P. magdaleniatum mostraron relaciones n-6/n-3 saludables (1,04 y 2,72) en periodos diferentes. Aunque las tres especies mostraron valores II bajos (0,37-0,63), los demás índices IA (0,04-0,70), TI (0,66-1,07) y h/H (0,80 – 24,40) están dentro del rango saludable. El análisis multivariante mostró valores nutricionales similares en dos especies excepto P. magdaleniatum.
|
1. INTRODUCTIONTOP
The consumption of fatty acids, mainly polyunsaturated, plays an important role in human nutrition, the prevention of illness, and the promotion of good health (Sidhu, 2003; Das, 2006; Mazza et al., 2007). Polyunsaturated fatty acids (PUFAs) n-3 and n-6 are important for maintaining the integrity of all living cell membranes and they participate in prostaglandin synthesis, which regulates many organic processes such as inflammation and blood coagulation (Connor, 2000; Kalogeropoulos et al., 2010). Some PUFAs, such as eicosapentaenoic (C20:5 n-3), docosahexaenoic (C22:6 n-3), and arachidonic (C20:4 n-6) acids can be obtained from diet or synthesis in the human body, at a very low rate, from linoleic (C18:2 n-6) and α-linoleic (C18:3 n-3) acids (Innis, 2003). These PUFAs are considered essential for the growth, immune function and development of the central nervous system (Innis, 2007), and their moderated consumption seems to reduce the risk of cardiovascular illnesses (Lavie et al., 2009).
The most common source of n-3 and n-6 PUFAs for the human diet (Mataix et al., 2003) is obtained from fish, namely marine fish, due to their elevated proportion of n-3PUFAs (Huynh and Kitts, 2009; Prato and Biandolino, 2012; Fernandes, 2014). The number of studies on fatty acids in freshwater fish are few compared to marine fish (Moreira et al., 2001; Ramos-Filho et al., 2010; Swapna et al., 2010; Jabeen and Chaudhry, 2011) probably because they have a higher presence of n-6 PUFAs (Özogul et al., 2007). Nevertheless, several studies have shown that the relative abundance and qualitative composition of fatty acids in different organisms are characteristic of each species depending on the gender, the environment, and their type of nourishment (Farkas, 1970; Suzuki et al., 1986; Henderson y Tocher, 1987; Sargent et al., 1989; Steffens, 1997; Moreira et al., 2001). Moreover, temporal variation in fatty acids has not been performed in Neotropical countries (Luzia et al., 2003; Rasoarahona et al., 2005) although the breeding and/or trophic fish migrations associated with drought and rainy seasons may lead to variations in the quantity and composition of their fatty acids. Thus, studying the fatty acid composition may favor the consumption of species that contribute to a healthy diet which is also preventive of coronary illnesses.
Migratory freshwater fishes are priceless resources at the ecologic, economic, and social levels and support the subsistence of an important number of riverside people. The assessment of their nutritional value will facilitate in performing a proper management for the preservation and sustainable commercial exploitation of them, as well as providing greater nutritional value and food security for the region. The freshwater fishes Prochilodus magdalenae (bocachico), Pseudoplatystoma magdaleniatum (catfish) and Ageneiosus pardalis (doncella) are the most highly-demanded Colombian species because of the quality of their meat, size, and taste. These species differ in their feeding preferences, while P. magdalenae is detritivorous (Bowen, 1983, Flecker, 1996), P. magdaleniatum (Jiménez-Segura, 2009) and A.pardalis (Tobías-Arias et al., 2006) are carnivorous.
The information about fatty acid composition is unknown for A. pardalis and scarce for P. magdalenae and P. magdaleniatum since only nine of the more abundant fatty acids have been characterized in the two latter species (Perea et al., 2008). Moreover, it remains to be explored whether the content of fatty acids and its consequent nutritional value vary according to migratory seasons and whether such variation is associated with the breeding/trophic cycles of these species (Bowen 1983, Flecker 1996; Jiménez-Segura, 2009; Tobías-Arias et al., 2006). Therefore, this study aimed to determine the nutritional value based on the content of the fatty acids of P. magdaleniatum, P. magdalenae and A. pardalis in dry and rainy seasons, with a view to orient their commercial use and conservation strategies.
2. MATERIALS AND METHODSTOP
2.1. Specimens and extract preparationTOP
A total of 18 individuals of P. magdaleniatum, P. magdalenae and A. pardalis (6 for each species) were obtained in the local fish market of the Cauca riverbed in the rainy (April-June) and dry (December-January, July-August) seasons in 2013. The samples were preserved at -4 ºC and protected from light before use.
Three samples per season were analyzed in each species. Each individual was previously measured, weighed, and sliced; the edible muscle was cut into pieces of approximately 3x3 cm and exhaustively extracted with a methanol/dichloromethane mixture (1:1 v/v). The extracts were filtered and evaporated to dryness at a temperature below 40 ºC with reduced pressure and constant agitation, and the obtained dry extracts were kept refrigerated, protected from light, air, heat, and humidity until their use. Lipid content was gravimetrically obtained and classified by the categories used by some authors: very low fat (< 2% p/p), low fat (2–4% p/p), medium fat (4–8% p/p) and high fat (> 8%) (Ackman, 1990).
2.2. Fatty acid by-product preparationTOP
Fatty acid methyl esters were obtained by subjecting a quantity of extract to basic hydrolysis with NaOH 2N in methanol at 55 ºC for 20 minutes. Then, a solution of HCl methanol at 5% was added and heated in bain-marie at 55 °C for 20 minutes. The mixture was neutralized, the organic solvent evaporated, two dichloromethane/water (1:1 v/v) extractions were performed and the organic phase was taken to dryness in a rotary evaporator at a temperature below 40 °C, at reduced pressure, and constant agitation. Pyrrolidine derivatives were obtained adding 1.000 µL of the pyrrolidine and 100 µL glacial acetic acid at 100 µg of methyl esters and subjecting the mixture to boiling at 100 ºC in an open reflux for 90 minutes. The pyrrolidine derivative fraction was obtained using a water/dichloromethane mixture (1:1 v/v). The organic phase was dried and then concentrated. The reactions were monitored by thin layer chromatography using chromatographic sheets 60F254 (Merck) as stationary phase, with hexane/ethyl acetate (3:1) as mobile phase and revealed with phosphomolybdic acid at 5% in ethanol with further heating at 100 °C. The Retention Factor (Rf) was with standard values for fatty acids, methyl esters and pyrrolidine derivatives.
2.3. Gas chromatography–mass spectrometry (GC-MS) analysisTOP
Samples were injected into an Agilent 6890N gas chromatographer coupled to an Agilent 5973N mass spectrometer. For the GC-MS analysis of the methyl esters and pyrrolidine derivatives of fatty acids, an Agilent 19091J-413, HP-5 (0.32 mm x 30 m x 0.25 µm) column was used with a furnace program starting at 100 °C, 10 °C/min gradient until a peak temperature of 325 °C. The splitless mode at 220 °C, 0.38 psi pressure, 14.1 mL/min total flow, and 300 °C auxiliary detector temperature were used for the injection. Scan mode was used in the mass detector in a 30–800 uma mass interval. The injection volume was 5.0 µL, and the analysis time was 60 minutes.
The identification of the fatty acids present in the samples was made through the analysis of the mass spectra of the methyl esters and pyrrolidine derivatives, and compared with the reports in the following databases: NIST Mass Spectral Database (NIST98®, NIST02®, NIST5a®), Methyl Esters of Fatty Acids – Archive of Mass Spectra and N-Acyl Pyrrolidine Derivatives of Fatty Acids – Archive of Mass Spectra (Christie, 2013). The percentage of abundance (%) of fatty acids was calculated from the area under the peak curve of the gas chromatogram of the methyl ester fractions.
2.4. Determination of nutritional value and statistical analysisTOP
Five indexes were calculated to determine the nutritional value of the three fish species, namely n-6/n-3 ratio (PUFA n-6/PUFA n-3), unsaturation index (UI = ∑UFA X number of double bonds/100), atherogenicity index (AI=[C12:0 + (4 X C14:0) + C16:0]/(MUFA + PUFA n-6 + PUFA n-3]) (Ulbricht and Southgate, 1991), thrombogenicity index (TI = (C14:0 + C16:0 + C18:0)/[(0.5 X MUFA) + (0.5 X PUFA n-6) + (3 X PUFA n-3) + (PUFA n-3/PUFA n-6)]) (Ulbricht and Southgate, 1991), and FA hypocholesterolemic/hypercholesterolemic ratio (h/H = (C18:1 n-9 + C18:2 n-6 + C20:4 n-6 + C18:3 n-3 + C20:5 n-3 + C22:5 n-3 + C22:6 n-3)/(C14:0 + C16:0) (Santos-Silva et al., 2002), where PUFA: Polyunsaturated fatty acid, MUFA: Monounsaturated fatty acid and UFA: Unsaturated fatty acid.
The effects of species (P. magdaleniatum, P. magdalenae and A. pardalis) and seasons (dry and rainy) on the global percentages of abundance of the fatty acids and lipids were assessed by multi-factor analysis of variance using a general linear model. The same procedure was used to evaluate the effect of the species, the season, and the kind of fatty acid on the abundance of each fatty acid. Furthermore, the nutritional values for each species between seasons were explored by two Principal Component Analyses using all the fatty acids found in the samples as variables and the five nutritional indexes were calculated. In the latter case, undetectable values for PUFA n-3 were established at 0.01%, based on the lowest level measured in this study. Statistical analyses were performed with Statgraphics Centurion XVI® and Past (Hammer et al., 2001) programs.
3. RESULTS AND DISCUSSIONTOP
3.1. Lipid contentTOP
Biometric indexes (BI = Weight in grams/Standard length in centimeters) were higher for P. magdaleniatum (both seasons) and P. magdalenae (rainy season) (Table 1). The lipid percentage was significantly lower in P. magdaleniatum compared to P. magdalenae and A. pardalis (Table 1, F(2,17) = 6.07; p = 0.0127). In general, the muscle lipid percentages found in this study were similar to the ranges previously reported for P. magdaleniatum (0.4% -1.9%) and P. magdalenae (1.3% - 5.2%) (Perea et al., 2008) and other freshwater species (0.35% - 7.92%) (Rahman et al., 1995; Luzia et al., 2003; Rasoarahona et al., 2005; Özogul et al., 2007; Ramos-Filho et al., 2010). Comparing the rainy and dry seasons, P. magdaleniatum varied from low fat to very low fat, while P. magdalenae and A. pardalis exhibited medium fat for both seasons, according to the criteria described by Ackman (1990). However, ANOVA did not show significant differences between seasons for each species (F(1, 17) = 0.14; p = 0.7172). Likewise, fatty acid percentages were similar among species (F(2,16) = 3.65; p = 0.0554) and between seasons (F(1,16) = 0.05; p = 0.8304).
Table 1. Biometric index (BI), percentage of muscle on wet base (Muscle %), percentage of lipids in muscle (Lipid %) and percentage of fatty acids in the total lipid fraction (Fatty acids %) in two seasons
| Specie |
Season |
BI (g/cm) |
Muscle % |
Lipid % |
Fatty acids % |
| P. magdaleniatum<br>(Catfish) |
Rainy |
24.18 ± 3.30 |
56.93 ± 4.41 |
2.81 ± 2.13a |
48.00 ± 28.56 |
| Dry |
22.30 ± 18.10 |
56.68 ± 11.52 |
0.48 ± 0.27a |
38.90 ± 9.31 |
| P. magdalenae<br>(Bocachico) |
Rainy |
15.45 ± 3.42 |
65.28 ± 1.90 |
6.56 ± 1.39b |
83.50 ± 37.73 |
| Dry |
25.86 ± 6.36 |
65.48 ± 0.65 |
7.89 ± 2.34b |
65.44 ± 47.19 |
| A. pardalis<br>(Doncella) |
Rainy |
7.04 ± 2.24 |
62.86 ± 2.63 |
6.96 ± 6.17b |
71.28 ± 9.95 |
| Dry |
6.12 ± 0.37 |
59.22 ± 5.64 |
6.35 ± 3.20b |
83.95 ± 4.33 |
| Results are given as mean ± standard deviation (n = 3 samples in each season). Statistical test: Two-way ANOVA. Different letters in the same column indicate significant differences in the lipid percentage among species (p < 0.05), according to Tukey’s tests. BI = Weight /Standard length. |
3.2. Fatty acids identified in the three species in the two seasonsTOP
The yields obtained in the preparation of the methyl esters derivatives were high (P. magdaleniatum: 82.0%; P. magdalenae: 90.4%; A. pardalis: 87.2%), and for the pyrrolidine derivatives they were 100% in all cases. Rf values for fatty acids (0.51), methyl esters (0.91) and pyrrolidine derivatives (0.20) were obtained using oleic acid and cholesterol patterns.
A total of 50 fatty acids were identified in P. magdaleniatum, 41 in P. magdalenae, and 32 in A. pardalis (Tables 2 and 3). The most abundant saturated fatty acids were isopalmitic acid (i-C15:0) in P. magdalenae (22.51% and 18.62%) and anteisopalmitic acid (ai-C15:0) in P. magdaleniatum (13.58% and 36.06%) and A. pardalis (10.24% and 10.45%), which were also identified in other freshwater species but in lower quantities (Rasoarahona et al., 2005), followed in abundance by C16:0 and C18:0 acids in the three species. Oleic acid (C18:1 n-9) was the most abundant monounsaturated acid in P. magdaleniatum (22.41% and 10.09%), P. magdalenae (15.82% and 11.16%), and in A. pardalis (11.37% and 6.45%), which concured with other reports on freshwater species (Özogul et al., 2007; Jabeen and Chaudhry, 2011). Linolenic acid (18:3 n-3) was not detected in P. magdaleniatum or P. magdalenae, which is in agreement with a previous report on P. magdaleniatum (Perea et al., 2008). Polyunsaturated fatty acids n-3 were not detected in A. pardalis, which may reflect preferences in the diet, mainly composed of other fish, occasionally crustacean, insects and other trophic groups (Tobías-Arias et al., 2006).
Table 2. Saturated fatty acids in P. magdaleniatum, P. magdalenae, and A. pardalis, and abundance percentage mean in the total fatty acids in two seasons (rainy and dry)
| Specie |
P. magdaleniatum |
P. magdalenae |
A. pardalis |
| Season |
Rainy |
Dry |
Rainy |
Dry |
Rainy |
Dry |
| Mean ± SD |
Mean ± SD |
Mean ± SD |
Mean ± SD |
Mean ± SD |
Mean ± SD |
| C9:01 |
0.05 ± 0.09 |
n.d |
n.d |
n.d |
n.d |
n.d |
| C12:0 |
0.09 ± 0.16 |
n.d |
n.d |
0.04 ± 0.07 |
n.d |
n.d |
| C13:0 |
0.06 ± 0.08 |
n.d |
n.d |
0.04 ± 0.07 |
n.d |
n.d |
| i-C13:0 |
0.08 ± 0.15 |
n.d |
n.d |
0.02 ± 0.03 |
n.d |
n.d |
| C14:0 |
1.53 ± 0.56a |
0.30 ± 0.28b |
0.97 ± 1.37 |
4.19 ± 3.38 |
2.40 ± 0.85 |
1.05 ± 1.02 |
| 2,6,10-trimethyl-C12:0 |
n.d |
n.d |
n.d |
n.d |
0.00 ± 0.00 |
0.05 ± 0.09 |
| 9-methyl-C14:0 |
0.42 ± 0.72 |
n.d |
n.d |
n.d |
0.42 ± 0.16 |
0.18 ± 0.20 |
| i-C14:0 |
0.44 ± 0.28 |
0.39 ± 0.67 |
0.01 ± 0.01 |
1.01 ± 1.44 |
n.d |
n.d |
| ai-C14:0 |
0.59 ± 1.02 |
n.d |
0.02 ± 0.03 |
0.05 ± 0.08 |
n.d |
n.d |
| C15:0 |
1.60 ± 0.28 |
1.08 ± 0.32 |
n.d |
1.08 ± 0.53 |
1.47 ± 0.61 |
0.46 ± 0.37 |
| 3-methyl-C15:0 |
n.d |
n.d |
n.d |
0.10 ± 0.18 |
n.d |
n.d |
| i-C15:0 |
0.09 ± 0.15 |
n.d |
22.51 ± 16.13 |
18.62 ± 13.55 |
3.90 ± 0.44 |
10.38 ± 5.04 |
| ai-C15:0 |
13.58 ± 8.90 |
36.06 ± 14.17 |
9.38 ± 13.27 |
1.37 ± 2.38 |
10.24 ± 0.70 |
10.45 ± 2.20 |
| C16:0 |
11.65 ± 12.11 |
0.12 ± 0.20 |
4.43 ± 5.88 |
11.98 ± 16.22 |
15.92 ± 3.91a |
1.24 ± 2.15b |
| 7-methyl-C16:0 |
0.21 ± 0.26 |
1.58 ± 1.99 |
n.d |
n.d |
n.d |
n.d |
| i-C16:0 |
1.09 ± 0.57 |
5.21 ± 7.07 |
2.44 ± 2.13 |
2.19 ± 3.62 |
3.44 ± 0.56 |
1.47 ± 1.98 |
| ai-C16:0 |
0.31 ± 0.54 |
n.d |
7.93 ± 11.21 |
0.97 ± 0.87 |
n.d |
n.d |
| 2,6,12-trimethyl-C15:0 |
n.d |
n.d |
n.d |
n.d |
n.d |
3.96 ± 6.86 |
| 9,10-methylene-C16:0 |
n.d |
n.d |
0.16 ± 0.23 |
0.07 ± 0.12 |
6.19 ± 0.95 |
3.50 ± 4.59 |
| C16:01 |
n.d |
n.d |
2.45 ± 3.46 |
1.68 ± 2.91 |
n.d |
4.47 ± 7.74 |
| C17:0 |
3.72 ± 1.63 |
5.36 ± 8.74 |
3.80 ± 3.49 |
1.19 ± 1.12 |
n.d |
n.d |
| i-C17:0 |
n.d |
4.53 ± 6.05 |
n.d |
n.d |
5.63 ± 0.38a |
1.19 ± 2.07b |
| 9,10-methylene-C17:0 |
n.d |
n.d |
n.d |
n.d |
n.d |
0.69 ± 0.95 |
| C18:0 |
12.77 ± 5.18 |
10.58 ± 9.18 |
11.26 ± 4.46 |
9.30 ± 1.45 |
5.06 ± 1.09a |
13.61 ± 4.49b |
| 2,6,14-trimethyl-C16 |
n.d |
n.d |
n.d |
n.d |
n.d |
1.03 ± 1.79 |
| 9,10-methylene-C18:0 |
n.d |
n.d |
0.59 ± 0.83 |
3.87 ± 6.47 |
n.d |
n.d |
| i-C18:0 |
0.02 ± 0.03 |
n.d |
n.d |
n.d |
n.d |
n.d |
| C18:01 |
4.27 ± 7.39 |
1.34 ± 2.33 |
n.d |
n.d |
n.d |
n.d |
| C19:0 |
0.14 ± 0.12 |
0.05 ± 0.09 |
0.06 ± 0.09 |
0.04 ± 0.06 |
0.99 ± 1.27 |
0.12 ± 0.20 |
| C18:01 |
n.d |
n.d |
n.d |
0.25 ± 0.43 |
n.d |
n.d |
| C20:0 |
0.27 ± 0.10 |
0.09 ± 0.16 |
n.d |
0.39 ± 0.57 |
0.43 ± 0.07a |
0.25 ± 0.06b |
| C21:0 |
0.02 ± 0.03 |
n.d |
n.d |
n.d |
0.05 ± 0.08 |
0.22 ± 0.38 |
| C22:0 |
0.18 ± 0.06a |
n.db |
n.d |
0.07 ± 0.07 |
0.20 ± 0.07 |
0.10 ± 0.10 |
| C23:0 |
0.01 ± 0.02 |
n.d |
n.d |
n.d |
n.d |
n.d |
| C24:0 |
0.01 ± 0.02 |
n.d |
n.d |
n.d |
n.d |
n.d |
| ∑ SFAs |
53.22 ± 17.69 |
66.69 ± 21.40 |
66.01 ± 25.45 |
58.50 ± 23.11 |
56.35 ± 22.14 |
54.42 ± 21.41 |
| Abundance percentages are mean of three samples (n = 3), mean ± standard deviation. Statistical test: Multi-factor ANOVA. Different letters in the same row indicate significant differences in the abundance percentage between seasons (p < 0.05), according to Tukey’s tests. n.d: not detected. 1Compounds with different retention times that were not identified. |
Table 3. Monounsaturated and polyunsaturated fatty acids in P. magdaleniatum, P. magdalenae, and A. pardalis, and abundance percentage mean in the total fatty acids in rainy and dry seasons
| Specie |
P. magdaleniatum |
P. magdalenae |
A. pardalis |
| Season |
Rainy |
Dry |
Rainy |
Dry |
Rainy |
Dry |
| Mean ± SD |
Mean ± SD |
Mean ± SD |
Mean ± SD |
Mean ± SD |
Mean ± SD |
| Monounsaturated Fatty Acids (MUFAs) |
| C14:11 |
n.d |
n.d |
n.d |
n.d |
n.d |
0.10 ± 0.17 |
| C15:1n-8 |
n.d |
n.d |
n.d |
0.05 ± 0.08 |
n.d |
n.d |
| C15:1n-6 |
n.d |
n.d |
n.d |
0.06 ± 0.11 |
n.d |
n.d |
| C16:1n- 9 |
n.d |
n.d |
n.d |
10.93 ± 9.70 |
n.d |
n.d |
| i-C16:1 n-7 |
n.d |
n.d |
n.d |
n.d |
2.76 ± 0.87a |
0.29 ± 0.50b |
| C16:1 n-7 |
8.39 ± 1.58a |
3.07 ± 1.46b |
9.04 ± 12.78 |
3.79 ± 4.98 |
8.58 ± 0.67 |
5.68 ± 2.63 |
| C16:11 |
0.11 ± 0.19 |
0.38 ± 0.66 |
n.d |
0.71 ± 1.23 |
n.d |
n.d |
| C17:1 n-8 |
0.19 ± 0.32 |
0.22 ± 0.25 |
n.d |
0.62 ± 1.08 |
n.d |
n.d |
| C17:1 n-9 |
1.20 ± 0.58 |
4.28 ± 6.17 |
n.d |
0.03 ± 0.06 |
n.d |
n.d |
| C18:1n-10 |
n.d |
8.88 ± 8.95 |
6.14 ± 0.12 |
9.05 ± 4.85 |
8.34 ± 0.98 |
23.16 ± 14.70 |
| C18:1 n-9 |
22.41 ± 11.27 |
10.09 ± 12.66 |
15.82 ± 10.02 |
11.16 ± 12.67 |
11.37 ± 0.87 |
6.45 ± 7.60 |
| C18:1n-5 |
4.20 ± 5.86 |
1.40 ± 2.43 |
n.d |
n.d |
n.d |
0.99 ± 1.71 |
| i-C18:1 n-12 |
n.d |
n.d |
n.d |
n.d |
n.d |
2.61 ± 4.51 |
| i-C18:1 n-11 |
n.d |
n.d |
n.d |
n.d |
n.d |
0.20 ± 0.34 |
| C18:11 |
n.d |
n.d |
n.d |
n.d |
9.10 ± 1.36a |
1.17 ± 2.03b |
| C19:1n-10 |
0.45 ± 0.67 |
0.66 ± 1.15 |
n.d |
n.d |
n.d |
n.d |
| C19:1 n-9 |
1.48 ± 2.12 |
n.d |
n.d |
n.d |
n.d |
n.d |
| C20:11 |
0.13 ± 0.23 |
n.d |
n.d |
n.d |
n.d |
n.d |
| C20:1 n-9 |
2.61 ± 1.47 |
0.96 ± 1.15 |
1.29 ± 1.83 |
2.42 ± 1.07 |
3.35 ± 0.58 |
4.95 ± 3.14 |
| C20:1n-7 |
n.d |
n.d |
n.d |
0.03 ± 0.05 |
n.d |
n.d |
| C24:1 n-9 |
n.d |
0.15 ± 0.27 |
n.d |
n.d |
n.d |
n.d |
| ∑ MUFAs |
41.16 ± 13.10 |
30.10 ± 17.03 |
32.29 ± 16.34 |
38.84 ± 17.52 |
43.50 ± 19.34 |
45.59 ± 25.38 |
| Polyunsaturated Fatty Acids (PUFAs) |
| C18:2 n-6 |
0.28 ± 0.48 |
3.12 ± 5.04 |
1.37 ± 1.34 |
0.73 ± 1.27 |
n.d |
n.d |
| C18:2 n-5 |
n.d |
0.09 ± 0.15 |
n.d |
n.d |
n.d |
n.d |
| C20:5 n-3 |
0.14 ± 0.24 |
n.d |
0.06 ± 0.08 |
0.80 ± 1.33 |
n.d |
n.d |
| C20:4 n-6 |
2.70 ± 4.00 |
n.d |
0.10 ± 0.14 |
0.08 ± 0.13 |
0.06 ± 0.10 |
n.d |
| C20:3n-7 |
0.34 ± 0.41 |
n.d |
0.08 ± 0.11 |
0.50 ± 0.65 |
0.04 ± 0.07 |
n.d |
| C20:2n-7 |
n.d |
n.d |
n.d |
n.d |
0.06 ± 0.10 |
n.d |
| C20:2 n-9 |
0.19 ± 0.18 |
n.d |
0.11 ± 0.15 |
0.08 ± 0.14 |
n.d |
n.d |
| C20:2n-6 |
0.18 ± 0.31 |
n.d |
n.d |
0.05 ± 0.09 |
n.d |
n.d |
| C21:3 n- 4 |
0.03 ± 0.06 |
n.d |
n.d |
n.d |
n.d |
n.d |
| C22:6n-3 |
0.24 ± 0.31 |
n.d |
n.d |
0.22 ± 0.38 |
n.d |
n.d |
| C22:5 n-3 |
0.99 ± 1.36 |
n.d |
n.d |
n.d |
n.d |
n.d |
| C22:4n-6 |
0.29 ± 0.38 |
n.d |
n.d |
n.d |
n.d |
n.d |
| C22:3 n-6 |
0.26 ± 0.32 |
n.d |
n.d |
0.20 ± 0.34 |
n.d |
n.d |
| ∑ PUFA |
5.63 ± 4.33 |
3.21 ± 3.12 |
1.71 ± 1.36 |
2.65 ± 2.02 |
0.16 ± 0.09 |
0.00 ± 0.00 |
| ∑ PUFA n-3 |
1.36 |
n.d |
0.06 |
1.02 |
n.d |
n.d |
| ∑ PUFA n-6 |
3.70 |
3.12 |
1.47 |
1.06 |
0.06 |
n.d |
| Abundance percentages are mean of three samples (n = 3), mean ± standard deviation. Statistical test: Multi-factor ANOVA. Different letters in the same row indicate significant differences in the abundance percentage between seasons (p < 0.05), according to Tukey’s tests. n.d: not detected. 1Compounds with different retention times that were not identified. |
Multi-factor ANOVA showed that the fatty acids (F(68, 413) = 11.08; p = 0.0000) and their interactions with the species (F(136, 413) = 1.89; p = 0.0001) were significant, indicating that the abundance of fatty acids changed in the seasons, depending on the fatty acid. Moreover, such changes were different among the species. Specifically, in the dry season, P. magdaleniatum displayed a significant reduction in C14:0, C22:0 and C16:1 n-9 acids (p < 0.05; Tables 2 and 3). Likewise, in the dry season, A. pardalis showed a significant reduction in C16:0, i-C17:0, C20:0, i-C16:1 n-7 and C18:1 n-7 isomer acids and a significant increase in C18:0 (Tables 2 and 3). In contrast, P. magdalenae exhibited non-significant changes between seasons (Tables 2 and 3).
3.3. Fatty acid nutritional value determinationTOP
The n-6/n-3 ratios in P. magdalenae and P. magdaleniatum changed between seasons (Table 4). The best value for the n-6/n-3 fatty acid ratio (1.04) was found for P. magdalenae caught in the dry season when this species performs reproductive migration from the swamps to the river (Mojica et al., 2002). However, the n-6/n-3 ratio was superior in the rainy season when P. magdalenae returns from the river to the swamps after fulfilling its breeding cycle. In contrast, in P. magdaleniatum the best n-6/n-3 fatty acid ratio (2.72) was observed in the rainy season, which matches its breeding season (Mojica et al., 2002). In the dry season this ratio was greater than the desirable ratio for the human diet.
Table 4. Nutritional quality indexes of P. magdaleniatum, P. magdalenae, and A. pardalis
| Specie |
season |
n-6/n-3 |
UI |
AI |
TI |
h/H |
| P. magdaleniatum |
Rainy |
2.71 |
0.63 |
0.39 |
0.97 |
2.03 |
| Dry |
N.D |
0.37 |
0.04 |
0.66 |
31.94 |
| P. magdalenae |
Rainy |
26.60 |
0.36 |
0.25 |
0.98 |
3.21 |
| Dry |
1.04 |
0.48 |
0.70 |
1.06 |
0.80 |
| A. pardalis |
Rainy |
N.D |
0.44 |
0.59 |
1.07 |
0.62 |
| Dry |
N.D |
0.46 |
0.12 |
0.70 |
2.82 |
| N.D: Not detected, n-6/n-3: polyunsaturated fatty acid ratio, UI: unsaturation index, AI: atherogenicity index, TI: thrombogenicity index, h/H: hypocholesterolemic/hypercholesterolemic index. |
The n-6/n-3 ratios present in P. magdaleniatum and P. magdalenae are strongly associated with breeding times and confirm the inverted bio-ecological habits of P. magdaleniatum with respect to P. magdalenae, in the two seasons assessed (Mojica et al., 2002). This antagonistic behavior of the two species is relevant to their nutritional value as the determination of the presence of these fatty acid ratios could be considered a useful parameter to study migratory habits and breeding cycles of freshwater fish when determining the most adequate times to capture them for consumption purposes. Similar changes in n-6/n-3 ratios between seasons resulting from spawning has been described for other species (Rasoarahona, 2005; Guler et al., 2007; Inhamuns and Franco; 2008).
Since the n-6/n-3 fatty acid ratios of P. magdalenae in the dry season and P. magdaleniatum in the rainy season are included in the range considered healthy (1–4; Simopoulos, 2002), both species would represent a healthy source of PUFAs in a particular season.
The values for UI (between 0.37 and 0.63) showed a low presence of unsaturated fatty acids for the three species (Table 4). Nevertheless, low AI values obtained in the two seasons from the three studied species (0.04 – 0.70) indicated a low risk of atherogenicity. Further, the TI values (1.06 – 1.07) for P. magdalenae and A. pardalis in the dry and rainy seasons, respectively, were slightly higher than 1, but they might be considered acceptable when compared to other healthy foods (Ulbricht and Southgate, 1991). On the other hand, although the h/H values for P. magdalenae and A. pardalis in the dry and rainy seasons, respectively, were slightly lower than 1, they might be considered moderately high (0.62 –
0.80), which indicates low hypercholesterolemia risk owing to their consumption. According to these results, moderate consumption (1-2 times a week) of the three species, in any of the two hydrologic seasons, represents a low risk for cardiovascular illnesses.
3.4. Comparison of the nutritional values of each species in the two analyzed seasonsTOP
Principal component analyses using all the fatty acids identified in the three species as variables showed that the first component drastically separated P. magdaleniatum in the dry season from the other species, wherein this species was characterized by the absence of n-3 PUFAs. On the other hand, the second component separated contrasting seasons for the three species (Figure 1a). Similarly, in the principal component analysis using the five nutritional indexes, the first component that explained more than 99% of variability, drastically separated P. magdaleniatum in the dry season from the other species (Figure 1b). This latter analysis also suggested that the n-6/n-3 ratio and h/H index determined the opposite behavior in P. magdaleniatum in the dry season.
|
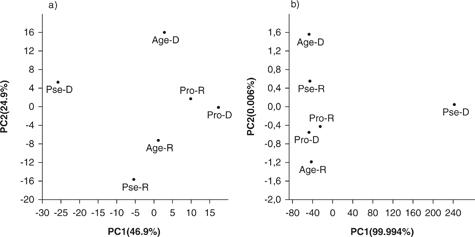 Figure 1. Principal component analysis of three freshwater fish species in the two seasons using all fatty acids (a) and nutritional quality indexes (b). PC1 and PC2: Principal components 1 and 2, respectively; Pse: P. magdaleniatum; Pro: P. magdalenae; Age: A. pardalis; R and D: Rainy and Dry seasons, respectively. Figure 1. Principal component analysis of three freshwater fish species in the two seasons using all fatty acids (a) and nutritional quality indexes (b). PC1 and PC2: Principal components 1 and 2, respectively; Pse: P. magdaleniatum; Pro: P. magdalenae; Age: A. pardalis; R and D: Rainy and Dry seasons, respectively.
|
|
The nutritional values of the wild species analyzed in this study (AI: 0.04-0.70; TI: 0.66-1.07; h/H: 0.62-31.94) differed from those found in a previous work (AI: 1.1-2.89; h/H: 0.25-1.29; Perea et al., 2008), although they were similar to the values found for freshwater fish from the Brazilian Pantanal (AI: 0.51-0.79; TI: 0.68-1.18; h/H: 1.14-1.80; Ramos-Filho et al., 2010).
4. CONCLUSIONSTOP
The fat content in the muscle of the three analyzed species was lower than 10% and the number of fatty acids identified in P. magdaleniatum (50), P. magdalenae (41) and A. pardalis (31) showed differences in the abundance percentage between seasons, associated with the kind of food and life cycle of each species.
Pseudoplatystoma magdaleniatum exhibited the higher content of PUFAs (3.70% and 3.12%), followed by P. magdalenae (1.47% and 1.06%), and A. pardalis (0.06 % and 0.00 %), in the rainy and dry seasons, respectively. The n-3 fatty acid content was similar in both P. magdaleniatum (1.36% and 0.00%) and P. magdalenae (0.06% and 1.02%), in the rainy and dry seasons, respectively, while the absence of this type of fatty acid was observed in A. pardalis. Moreover, linolenic acid (18:3 n-3) was not detected in P. magdaleniatum or in P. magdalenae.
The n-6/n-3 fatty acid ratios seemed to be associated with the migratory and breeding habits of the studied species. According to the lipid quality indexes, the species showing a better nutritional value were P. magdaleniatum and P. magdalenae. Further, the nutritional quality index values analyzed as a whole suggested that moderate consumption (1-2 times a week) of the three studied species could reduce the potential risk of cardiovascular illnesses, especially P. magdalenae, and is beneficial to human health.
ACKNOWLEDGMENTSTOP
The authors thank Professor Alejandro Martínez of the Grupo Productos Naturales Marinos de la Universidad de Antioquia who kindly permitted experimental work in his laboratory. This study was supported by the Estrategia de Sostenibilidad 2014-2015 of the Vicerrectoría de Investigación of the Universidad de Antioquia.
REFERENCESTOP
| ○ |
Ackman RG. 1990. Seafood lipids and fatty acids. Food Rev. Int. 6, 617–646. https://doi.org/10.1080/87559129009540896 |
| ○ |
Bowen SH. 1983. Detritivory in neotropical fish communities. Environ. Biol. Fish. 9, 137–144. https://doi.org/10.1007/bf00690858 |
| ○ |
Christie WW. 2013. Fatty Acids and Mass Spectrometry. Scotland: James Hutton Institute (Mylnefield Lipid Analysis), Invergowrie, Dundee (DD2 5DA). Retrieved May 2013 from https://doi.org/10.1016/0165-9936(95)00111-5 |
| ○ |
Connor WE. 2000. Importance of n-3 fatty acids in health and disease. Am. J. Clin. Nutr. 71, 171S–175S. https://doi.org/10.1093/ajcn/71.1.171S |
| ○ |
Das UN. 2006. Essential fatty acids - A review. Curr. Pharm. Biotechnol. 7, 467–82. https://doi.org/10.2174/138920106779116856 |
| ○ |
Farkas T. 1970. The dynamics of fatty acids in the aquatic food chain, phytoplankton, zooplankton, fish. Ann. Biol. Tihany. 37, 165–176. |
| ○ |
Fernandes CE, Da Silva-Vasconcelos MA, De Almeida-Ribeiro M, Sarubbo LA, Cardoso-Andrade SA, De Melo-Filho AB. 2014. Nutritional and lipid profiles in marine fish species from Brazil. Food Chem. 1, 67–71. https://doi.org/10.1016/j.foodchem.2014.03.055 |
| ○ |
Flecker AS. 1996. Ecosystem Engineering by a dominant detritivore in a diverse tropical stream. Ecology 77, 1845–1854. https://doi.org/10.2307/2265788 |
| ○ |
Guler GO, Aktumsek A, Citil OB, Arslan A, Torlak, E. 2007. Seasonal variations on total fatty acid composition of fillets of zander (Sander lucioperca) in Beysehir Lake (Turkey). Food Chem. 103, 1241–1246. https://doi.org/10.1016/j.foodchem.2006.10.029 |
| ○ |
Hammer Ø, Harper DAT, Ryan PD. 2001. PAST: Paleontological statistics software package for education and data analysis. Palaeontologia Electrónica 4 (1), 9. Retrieved March 2014 from http://palaeo-electronica.org/2001_1/past/issue1_01.htm |
| ○ |
Henderson RJ, Tocher DR. 1987. The lipid composition and biochemistry of freshwater fish. Prog. Lipid Res. 26, 281–347. https://doi.org/10.1016/0163-7827(87)90002-6 |
| ○ |
Huynh MD, Kitts DD. 2009. Evaluating nutritional quality of pacific fish species from fatty acid signatures. Food Chem. 114, 912–918. https://doi.org/10.1016/j.foodchem.2008.10.038 |
| ○ |
Inhamuns AJ, Franco MRB. 2008. EPA and DHA quantification in two species of freshwater fish from Central Amazonia. Food Chem. 107, 587–591. https://doi.org/10.1016/j.foodchem.2007.07.032 |
| ○ |
Innis SM. 2007. Fatty acids and early human development. Early Hum. Dev. 83, 761–766. https://doi.org/10.1016/j.earlhumdev.2007.09.004 |
| ○ |
Innis SM. 2003. Perinatal biochemistry and physiology of long-chain polyunsaturated fatty acids. J. Pediatr. 143, S1–8. https://doi.org/10.1067/s0022-3476(03)00396-2 |
| ○ |
Jabeen F, Chaudhry AS. 2011. Chemical compositions and fatty acid profiles of three freshwater fish species. Food Chem. 125, 991–996. https://doi.org/10.1016/j.foodchem.2010.09.103 |
| ○ |
Jiménez-Segura LF, Palacio J, López R. 2009. Características biológicas del blanquillo Sorubim cuspicaudus Littmann, Burr y Nass 2000 y bagre rayado Pseudoplatystoma magdaleniatum Buitrago-Suárez y Burr 2007 (Siluriformes: Pimelodidae) relacionadas con su reproducción en la cuenca media del río Magdalena, Colombia. Actual. Biológicas 31, 53–66. |
| ○ |
Kalogeropoulos N, Panagiotakos DB, Pitsavos C, Chrysohoou C, Rousinou G, Toutouza M, Stefanadis C. 2010. Unsaturated fatty acids are inversely associated and n-6/n-3 ratios are positively related to inflammation and coagulation markers in plasma of apparently healthy adults. Clin. Chim. Acta 411, 584–591. https://doi.org/10.1016/j.cca.2010.01.023 |
| ○ |
Lavie CJ, Milani RV, Mehra MR, Ventura HO. 2009. Omega-3 polyunsaturated fatty acids and cardiovascular diseases. J. Am. Coll. Cardiol. 54, 585–594. https://doi.org/10.1016/j.jacc.2009.02.084 |
| ○ |
Luzia LA, Sampaio GR, Castellucci CMN, Torres EAFS. 2003. The influence of season on the lipid profiles of five commercially important species of Brazilian fish. Food Chem. 83, 93–97. https://doi.org/10.1016/s0308-8146(03)00054-2 |
| ○ |
Mataix J, Mañas M, Llopis J, Martínez de Vitoria E. 2003. Tabla de composición de alimentos españoles. 4ª ed. Granada: Universidad de Granada. |
| ○ |
Mazza M, Pomponi M, Janiri L, Bria P, Mazza S. 2007. Omega-3 fatty acids and antioxidants in neurological and psychiatric diseases: an overview. Prog. Neuro-Psychoph. 31, 12–26. https://doi.org/10.1016/j.pnpbp.2006.07.010 |
| ○ |
Mojica JI, Álvarez-León R. 2002. Prochilodus magdalenae. En: Mojica J, Castellanos C, Usma S, Álvarez R. Libro Rojo de Peces Dulce acuícolas de Colombia. Serie Libros Rojos de Especies Amenazadas de Colombia. Instituto de Ciencias Naturales Universidad Nacional de Colombia, Ministerio del Medio Ambiente, 91–96. Bogotá D.C., Colombia, pp 288. |
| ○ |
Moreira AB, Visentainer JV, Souza NE, Matsushita M. 2001. Fatty acids profile and cholesterol contents of three Brazilian Brycon freshwater fishes. J. Food Comp. Anal. 14, 565–574. https://doi.org/10.1006/jfca.2001.1025 |
| ○ |
Özogul Y, Özogul F, Alagoz S. 2007. Fatty acid profiles and fat contents of commercially important seawater and freshwater fish species of Turkey: A comparative study. Food Chem. 103, 217–223. https://doi.org/10.1016/j.foodchem.2006.08.009 |
| ○ |
Perea A, Gómez E, Mayorga Y, Triana CY. 2008. Caracterización nutricional de pescados de producción y consumo regional en Bucaramanga, Colombia. Arch. Latinoam. Nutr. 58, 91–97. |
| ○ |
Prato E, Biandolino F. 2012. Total lipid content and fatty acid composition of commercially important fish species from the Mediterranean, Mar Grande Sea. Food Chem. 131, 1233–1239. https://doi.org/10.1016/j.foodchem.2011.09.110 |
| ○ |
Rahman SA, Huah TS, Nassan O, Daud NM. 1995. Fatty acid composition of some Malaysian freshwater fish. Food Chem. 54, 45–49. https://doi.org/10.1016/0308-8146(95)92660-c |
| ○ |
Ramos-Filho MM, Lima-Ramos MI, Aiko-Hiane P, Talá-de Souza EM. 2010. Nutritional Value of Seven Freshwater Fish Species From the Brazilian Pantanal. J. Am. Oil Chem. Soc. 87, 1461–1467. https://doi.org/10.1007/s11746-010-1639-1 |
| ○ |
Rasoarahona JRE, Barnathan G, Bianchini, JP, Gaydou EM. 2005. Influence of season on the lipid content and fatty acid profiles of three tilapia species (Oreochromis niloticus, O. macrochir and Tilapia rendalli) from Madagascar. Food Chem. 91, 683–694. https://doi.org/10.1016/j.foodchem.2004.07.001 |
| ○ |
Santos-Silva J, Bessa RJB, Santos-Silva F. 2002. Effect of genotype, feeding system and slaughter weight on the quality of light lambs. II. Fatty acid composition of meat. Livest. Prod. Sci. 77, 187–194. https://doi.org/10.1016/s0301-6226(02)00059-3 |
| ○ |
Sargent J, Henderson RJ, Tocher DR. 1989. The lipids. In: J.E. Halver (Editor), Fish Nutrition. 2nd edition, Academic Press., San Diego, pp 153–218. |
| ○ |
Sidhu KS. 2003. Health benefits and potential risks related to consumption of fish or fish oil. Regul. Toxicol. Pharm. 38, 336–344. https://doi.org/10.1016/j.yrtph.2003.07.002 |
| ○ |
Simopoulos AP. 2002. The importance of the ratio of omega-6/omega-3 essential fatty acids. Biomed. Pharmacother. 56, 365–379. https://doi.org/10.1016/s0753-3322(02)00253-6 |
| ○ |
Steffens W. 1997. Effects of variation feeds on nutritive in essential fatty acids in fish value of freshwater fish for humans. Aquaculture 151, 97–119. https://doi.org/10.1016/s0044-8486(96)01493-7 |
| ○ |
Suzuki H, Okazahi K, Hayakama S, Wada S, Tamura S. 1986. Influence of commercial dietary fatty acids on polyunsaturated fatty acids of cultured freshwater fish and comparison with those of wild fish of the same species. J. Agric. Food Chem. 34, 58–60. https://doi.org/10.1021/jf00067a016 |
| ○ |
Swapna HC, Rai AK, Bhaskar N, Sachindra NM. 2010. Lipid classes and fatty acid profile of selected Indian fresh water fishes. J. Food Sci. Technol. 47, 394–400. https://doi.org/10.1007/s13197-010-0065-6 |
| ○ |
Tobías-Arias A, Olaya-Nieto C, Segura-Guevara F, Tordecilla-Petro G, Brú-Cordero S. 2006. Ecología trófica de la doncella (Ageneiosus pardalis Lütken, 1874) en la cuenca del río Sinú, Colombia. Rev. MVZ Córdoba 11 Supl (1), 37–46. |
| ○ |
Ulbritch TL, Southgate DA. 1991. Coronary Heart Disease: Seven Dietary Factors. Lancet 338, 985–992. https://doi.org/10.1016/0140-6736(91)91846-m |