A proposal standard methodology for the characterization of edible oil organogelation with waxes
D. Canizaresa,b,*, P. Angersa,b and C. Rattia,c
aInstitute of Nutrition and Functional Foods (INAF), Laval University, Quebec, Quebec, Canada.
bDepartment of Food Science, Laval University, Quebec, Quebec, Canada.
cDepartment of Soils Science and Agri-Food Engineering, Laval University, Quebec, Canada.
*Corresponding author: diego.canizares.1@ulaval.ca
| |
SUMMARY
Saturated and trans fatty acids play a significant role in the plastic properties of food. However, health recommendations suggest limiting their intake. One approach which got the attention of researchers was to decrease the amount of saturated and trans fatty acids in food by the structuring of edible oils through the crystallization of waxes. The underlying mechanisms that lead to organogelation and the properties that characterize well-structured edible oil have been slow to fully understand due in part to a lack of standardization in their analysis which often makes the comparison between research results from different laboratories difficult. The aim of this work was to review previously reported methods for the characterization of organogelation using vegetable and animal waxes, and to propose a minimal standardization for an organogelation analysis.
|
| |
RESUMEN
Propuesta de una metodología estándar para la caracterización de la organogelificación de aceites comestibles con ceras. Los ácidos grasos saturados y trans juegan un rol significativo en las propiedades plásticas de los alimentos. Sin embargo, las recomendaciones de salud sugieren limitar su consumo. Un enfoque que han propuesto investigadores científicos es la disminución en la cantidad de grasas trans y saturadas en la alimentación por medio de la estructuración de aceites comestibles a partir de la cristalización de ceras. Los mecanismos por los cuales la organogelificación ocurre, así como las propiedades que caracterizan una buena estructuración del aceite, han sido descubiertos lentamente debido en parte a la falta de estandarización de los análisis implicados, lo que frecuentemente vuelve difícil la comparación entre resultados de investigación de distintos laboratorios. El objetivo de este trabajo es realizar una revisión de los principales métodos para la caracterización de la organogelificación y de los organogeles formados usando ceras vegetales y animales, proponiendo una estandarización mínima del análisis de organogelificación.
|
1. INTRODUCTIONTOP
Chocolate, margarine, shortening, whipping cream, dips, sauces, salad dressings, spreads and cookies are examples of food products in which oil structuring can be used to improve their sensorial characteristics, reduce defects caused by oil migration and replace trans and saturated fatty acids (Sato, 2001; Co and Marangoni, 2012; O’Sullivan et al., 2016). Oil structuring is done by means of compounds, organogelators, with properties to structure an oil into a gel-like material (Co and Marangoni, 2012). A gel is a substance with a permanent, on-time scale, continuous macroscopic structure and dimensions, which must exhibit solid-like rheological behavior despite its high liquid-volume fraction (Flory, 1953). A gel is named “hydrogel” when the immobilized liquid phase is hydrophilic and “organogel” when it is hydrophobic (Terech and Weiss, 1997; Blake et al., 2014).
An Organogel is described as a crystalline 3D network of low-molecular-weight organic compounds of colloidal dispersion in a non-polar medium (Terech and Weiss, 1997; Co and Marangoni, 2012; Blake et al., 2014). From this affirmation some points must be understood before continuing the discussion. First, up until now, the presence of crystals has been considered mandatory to form an organogel. Second, organogelators present a molecular weight lower than polymers, which are the most common hydrogelators, and that is why organogelators are known as low-molecular-weight compounds (Terech and Weiss, 1998). Finally, the crystalline 3D network is a mix of crystal-liquid and crystal-crystal interactions along with the possible presence of nanoscale crystalline fibrils with a matrix which is capable of entrapping oil (Smith, 2009). Nanofibrils with tubular, helical and twisted-type crystal morphologies were observed only in the crystallization of organic compounds with strong polar regions such as fatty acid metal salts, steroids, anthryl derivatives, organic compounds with steroidal and condensed aromatic rings, amino acids, and organometallic compounds, among others, in non-edible organic solvents (Terech and Weiss, 1997; Smith, 2009; Singh et al., 2017). It is believed that in these cases the molecular assembly into crystals is controlled by non-covalent interactions, resulting in a structure with a fibrillar appearance, similar to hydrophilic polymeric arrangements in water (Terech and Weiss, 1997; Smith, 2009).
Edible oils have been organogelated by compounds with long carbon chains, such as esters, alkanes, free fatty acids and fatty alcohols. The dominance of Van-der-Wall’s intermolecular interaction between compounds with long carbon chains may be the cause of the needle-type crystal formation (Dassanayake et al., 2009; Blake et al., 2014). These needle-type crystals had not yet been observed at the nanoscale level, but in organogels with a high concentration of esters, the needle-type crystals presented a microscale fibrillar appearance (Blake et al., 2014). The presence of minor compounds may cause a cluster of needle-type crystals (Blake et al., 2014), but non-clustered needle-type crystal morphology was related to better oil structuring (Dassanayake et al., 2012; Hwang et al., 2012). An x-ray diffraction analysis confirmed that needle-type crystals are responsible for edible oil organogelation and that the crystals came exclusively from the organogelator (Blake et al., 2014; Dassanayake et al., 2012; Öǧütcü and Yilmaz, 2014).
Vegetable waxes have been considered an interesting source of organogelators due to their composition and wide availability. They are present on the surface of the aerial parts of plants as a component of the cuticle and any plant is a possible vegetable wax source (Pollard et al., 2008). Further, vegetal waxes are composed of primary and secondary alkanols (C20 – C36), alkanes (C21 – C35), triterpenoids, alkyl esters (C32 – C54), β-diketones, aldehydes (C20 – C34), fatty acids (C14 - C34) and alkylresorcinols (del Río et al., 2013). However, it is known that wax composition may vary in relation to plant source, extraction methods, plant parts and age of the plant (Ensikat et al., 2000). Consequently, composition could also drastically affect the oil’s structuring capacity (Co and Marangoni, 2012). For instance, vegetal waxes with a higher concentration of esters are present better organogelation capacity (Hwang et al. 2012; Blake et al., 2014).
Recently, researchers have shown a growing interest in studies concerning vegetable wax organogelation in food grade products due to its technological possibilities. Hwang et al., (2013) observed that margarine made from soybean oil and structured by sunflower wax presented interesting technological properties and could substitute margarines with higher concentrations of trans and saturated fatty acids. Hazelnut oil structured with sunflower wax (5% w/w) was used as shortening in the preparation of cookies (Yilmaz and Öǧütcü, 2015b). The sensory characteristics, texture and stability of the cookies were evaluated and compared with control cookies which were made with commercial shortening. The results demonstrated that sunflower wax in hazelnut oil organogel was able to satisfactorily substitute commercial shortening.
The application of organogel to develop food products may turn into a process of trial and error when the relevant properties of organogel to make a good final product are unknown. Moreover, it is difficult to evaluate which type of organogel is better for each product without a method of standardized analysis. The aim of this work was to present a literature review about the most common and relevant methods used to analyze organogelation with the purpose of standardizing the methodology for characterizing organogelation. Previous results published in the literature will be shown and compared where they apply in order to better explain the objective of each analysis.
2. PREPARATION OF ORGANOGEL TOP
The first step in organogel preparation is heating the solution of vegetable wax in edible oil to form a homogeneous solution, which is heated to temperatures between 70 and 90 °C using a heat plaque, convection oven or water bath (Dassanayake et al., 2009; Hwang et al., 2012; Blake et al., 2014; Yilmaz and Öǧütcü, 2015). In fact, temperatures may vary from one work to another because higher temperature is necessary for the complete melting of the crystals than for the melting of the solution. It is also advisable to maintain an elevated temperature for a certain period of time to avoid an effect called “crystal memory”, which could influence the crystallization and, consequently, the organogelation (Hartel 2001).
Blake et al., (2014), for instance, maintained solutions of rice bran, sunflower, candellila and carnauba wax in canola oil at 90 °C for 30 min before analyses. Although not necessary, some authors have heated the samples under stirring (Fayaz et al., 2016).
Directly after heating comes the critical process for the formation of organogel, the cooling (Hartel, 2001). The most commonly-used cooling process applied to the solutions to form an organogel has been keeping the sample at room temperature (20 °C) until thermal equilibrium is reached without agitation (Dassanayake et al., 2009; Hwang et al., 2012; Hwang et al., 2013; Blake et al., 2014; Yilmaz and Öǧütcü, 2015). Sufficient resting time to allow temperature to equilibrate, and crystals to form completely has been about 24 hours (Blake et al., 2014; Fayaz et al., 2017). A prolonged period of rest is recommended to avoid the need for an analysis of non-stable crystals present in the organogel just after cooling (AOCS Official Method, Cd 16-93, 1997). The method to produce an organogel which includes heating, cooling and rest period, will from now be named “tempering” in an allusion to the well-known process of chocolate tempering.
2.1. Critical concentrationTOP
There is a growing consensus among authors regarding the importance of determining the minimum concentration of vegetable wax needed to form an organogel at room temperature (Hwang et al., 2012; Blake et al., 2014; Sagiri et al., 2015). The lowest concentration of a vegetable wax needed to structure an oil is named “critical concentration”. Vegetable waxes with the lowest critical concentrations have shown the best organogelation properties (Hwang et al., 2012; Hwang et al., 2013; Blake et al., 2014). The samples used to determine the critical concentration may be prepared and passed through the tempering process directly in the analysis vials. Oil structuring is determined visually when after cooling and rest time provided there is no gravitational flow of the solution (Hwang et al., 2012). In all the articles about vegetable wax organogelation, the concentrations used to produce organogel and determine the critical concentration belong to the group of natural numbers. Exceptions arise in cases where the critical concentrations are lower than 1%, for instance, sunflower wax was able to structure soybean oil at 0.5% w/w (Hwang et al., 2012).
2.2. Phase transitionTOP
Since the critical concentration was determined through the analysis of apparent solid behavior in a test tube, a second analysis was carried out to prove the oil structurating. This characterization is usually carried out in a rheometer, based on the small amplitude oscillation test (Lupi et al., 2012; Lupi et al., 2013; Blake et al., 2014) through controlled stress analysis using parallel plates or cone and plate geometries.
To understand organogel structuring and when it happens, a rheological analysis must be developed following a temperature program that represents organogelation tempering as close as possible. For instance, authors have performed the controlled stress analysis during a temperature ramp from between 70 and 95 °C to under 20 °C, at cooling rates from 1 to 5 °C/min (Lupi et al., 2012; Lupi et al., 2013).
At elevated temperatures, a solution is at its liquid state and its loss modulus (G’’) is higher than its storage modulus (G’). But during the process of cooling, a solution that changes from a liquid to solid-like state will present a temperature at which G’’ and G’ crossover. This point is considered the phase transition. So, it is implicit that a structured organogel at room temperature (20 °C) will present values of storage modulus (G’) higher than loss modulus (G’’). From the values of storage modulus and loss modulus, it is possible to calculate the phase transition angle (δ), which is the angle corresponding to the tangent of the ratio between loss modulus and storage modulus. Phase angle transition equal to 45 °C may also indicate the moment of phase transition. (Lupi et al., 2012).
Interesting rheological results were obtained by Lupi et al., (2012) and Lupi et al., (2013). In both works they observed that wax concentration is related to the organogelation temperature and the onset of crystallization temperature. Furthermore, the organogelation temperature was always at lower temperatures than the onset of crystallization temperature. These results are interesting because since the onset of crystallization temperature is the temperature at which the first crystals are considered to appear, crystal presence is mandatory for organogelation.
Crystallization is a generic term used to describe all the steps in the process to form a crystal. In a timeline sequence, crystal formation follows three basic steps, starting from supersaturation of the crystallizable compounds, nucleation and, then, crystal growth (Mullin, 1961; Hartel, 2001). Figure 1 presents a schematic representation of saturated triacylglycerol (TAG) at an elevated temperature, where TAG is a liquid state (Figure 1a). With temperature reduction, TAG molecules start to supersaturate and pack in organized systems that do not last long enough to form a crystal (Figure 1b). This state of supersaturation, where crystallizable molecules are not able to form crystals by themselves, is known as the “metastable state” (Mullin,1961). At these temperatures, crystallization is possible with external help, such as the presence of crystal seeds, agitation and mechanical shock (Mullin, 1961).
|
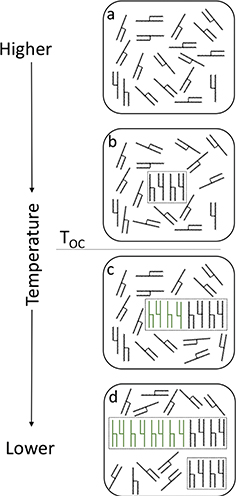 Figure 1. Schematic representation of saturated triacylglycerol molecular packing during cooling. Straight green molecules represent the stable molecular packing that will form crystals (Figure 3). TOC is the onset of crystallization temperature, which is the temperature at which the crystals start to form. Figure 1. Schematic representation of saturated triacylglycerol molecular packing during cooling. Straight green molecules represent the stable molecular packing that will form crystals (Figure 3). TOC is the onset of crystallization temperature, which is the temperature at which the crystals start to form.
|
|
A temperature which is low enough to allow the formation of the first crystals is known as the “onset of crystallization temperature”
(TOC, Figure 1). Under TOC the molecular packing can organize into stable crystalline structures, with a nucleus of bigger crystals (Figure 1c). Further temperature reduction may cause a higher degree of supersaturation, promoting crystal growth and new crystal formation
(Figure 1d).
In a multi-component system, such as solutions of vegetable waxes in vegetable oil, supersaturation may be affected by the presence of different types of compounds (Mullin 1961). Therefore, nucleation may be assisted or avoided, depending on the characteristics of the compounds present. A negative influence on the onset of crystallization and gelation temperatures due to addition of cocoa butter to a solution of Myverol in olive oil was observed (Lupi et al., 2012). While the presence of hydrocarbons (6–7%) and free fatty alcohols (11–13%) in sunflower waxes seems to have improved itd organogelation capacity (Hwang et al., 2012; Blake et al., 2014).
2.3. Thermal analysisTOP
The analysis of organogel and vegetable waxes in differential scanning calorimetry (DSC) is one of the most common analysis in the fiel. The term “differential scanning calorimetry” refers to a technique able to measure the movement of heat in (endothermic)
and out (exothermic) of the sample (Rheingans and Mittemeijer, 2015). The methodology allows precise control of temperature and accurate determinations of phase transition temperatures, enthalpy and heat capacity. The most adequate protocol of analysis is one that similar to phase transition analysis, is able to represent the tempering used to prepare the organogel. A temperature program coinciding with a rheological analysis allows for comparisons
(Lupi et al., 2012; Lupi et al., 2013). In fact, even when a rheological analysis is not carried out, authors have developed a thermal analysis in DSC with a temperature program similar to organogel tempering (Dassanayake et al., 2009; Öǧütcü and Yilmaz 2014; Öǧütcüand Yilmaz, 2015a; Öǧütcü and Yilmaz, 2015b).
The most common temperature program for determining the organogelation parameters in DSC is to increase the temperature of the organogel up to 100 °C and cool at nearly 0 °C, at a cooling rate from 1 to 5 °C/min (Lupi et al., 2012; Lupi et al., 2013). The sample cooling step in DSC allows for determining the onset of crystallization temperature (Figure 2, Onset), and other parameters, such as the temperature of the main peak of crystallization (Figure 2, Peak), endset of crystallization temperature (Figure 2, Endset) and the enthalpy of crystallization (Figure 2, Area under the curve) that could be used to characterize vegetable wax crystallization in oil (Aggarwal, 2000; Tan and Nehdi, 2015). The onset of crystallization temperature became the most important parameter once it was shown that no organogelation happens without the presence of crystals (Lupi et al., 2012).
|
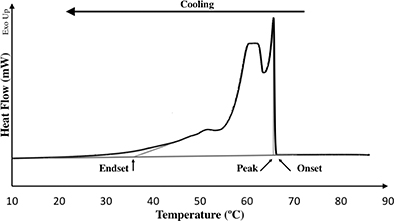 Figure 2. Schematic representation of the results obtained from DSC during analysis of crystallization. Onset, Peak and Endset are parameters obtained during cooling or crystallization analysis and are temperatures (°C). Figure 2. Schematic representation of the results obtained from DSC during analysis of crystallization. Onset, Peak and Endset are parameters obtained during cooling or crystallization analysis and are temperatures (°C).
|
|
Table 1 presents the onset of crystallization temperatures of different solutions of vegetable waxes in edible oil from the literature that were structured at room temperature. In Table 1 the influence of the wax and oil composition on the onset of crystallization temperature can be seen. In addition to the presence of crystals, a minimal amount of crystal is needed for oil structuring and this is why there are some differences between crystallization and organogelation temperatures (Lupi et al., 2012). The amount of crystals present in the organogel can be determined using laboratorial nuclear magnetic resonance as explained below.
Table 1. Values of onset of crystallization temperature, OBC and SFC for different organogels obtained from the literature
| Vegetal Wax |
Oil |
Vegetable Wax Concentration (%) |
Onset (°C) |
OBC (%) |
SFC (%) 20 °C |
| Rice bran wax1,a |
Salad Oil(2) |
50 |
70.1 |
- |
- |
| Rice bran wax1,a |
Salad Oil(2) |
40 |
68.8 |
- |
- |
| Rice bran wax1,a |
Salad Oil(2) |
20 |
66.3 |
- |
- |
| Rice bran wax1,a |
Salad Oil(2) |
10 |
60.3 |
- |
- |
| Rice bran wax1,a |
Salad Oil(2) |
5 |
57.9 |
- |
- |
| Rice bran wax1,a |
Salad Oil(2) |
3 |
56.6 |
- |
- |
| Rice bran wax1,a |
Salad Oil(2) |
1 |
48.1 |
- |
- |
| Rice bran waxb |
Canola Oil |
5 |
- |
- |
3.6 ± 0.1 |
| Rice bran waxb |
Canola Oil |
6 |
- |
- |
4.4 ± 0.0 |
| Rice bran waxb |
Canola Oil |
7 |
- |
- |
5.0 ± 0.2 |
| Rice bran waxb |
Canola Oil |
8 |
- |
- |
5.4 ± 0.1 |
| Rice bran waxb |
Canola Oil |
9 |
- |
- |
6.0 ± 0.2 |
| Rice bran waxb |
Canola Oil |
10 |
- |
- |
6.9 ± 0.2 |
| Sunflower waxb |
Canola Oil |
5 |
- |
- |
4.2 ± 0.2 |
| Sunflower waxb |
Canola Oil |
6 |
- |
- |
4.8 ± 0.0 |
| Sunflower waxb |
Canola Oil |
7 |
- |
- |
6.5 ± 0.1 |
| Sunflower waxb |
Canola Oil |
8 |
- |
- |
5.6 ± 0.1 |
| Sunflower waxb |
Canola Oil |
9 |
- |
- |
7.3 ± 0.1 |
| Sunflower waxb |
Canola Oil |
10 |
- |
- |
8.4 ± 0.1 |
| Candellila waxb |
Canola Oil |
5 |
- |
- |
4.1 ± 0.1 |
| Candellila waxb |
Canola Oil |
6 |
- |
- |
4.8 ± 0.1 |
| Candellila waxb |
Canola Oil |
7 |
- |
- |
5.8 ± 0.2 |
| Candellila waxb |
Canola Oil |
8 |
- |
- |
6.7 ± 0.0 |
| Candellila waxb |
Canola Oil |
9 |
- |
- |
7.5 ± 0.2 |
| Candellila waxb |
Canola Oil |
10 |
- |
- |
8.4 ± 0.2 |
| Carnauba waxb |
Canola Oil |
5 |
- |
- |
4.5 ± 0.3 |
| Carnauba waxb |
Canola Oil |
6 |
- |
- |
5.5 ± 0.2 |
| Carnauba waxb |
Canola Oil |
7 |
- |
- |
6.4 ± 0.1 |
| Carnauba waxb |
Canola Oil |
8 |
- |
- |
7.5 ± 0.2 |
| Carnauba waxb |
Canola Oil |
9 |
- |
- |
8.4 ± 0.1 |
| Carnauba waxb |
Canola Oil |
10 |
- |
- |
9.2 ± 0.1 |
| Carnauba Waxc |
Virgin Olive |
7 |
53.6 ± 1.5 |
71.7 ± 1.6 |
5.9 ± 0.1 |
| Carnauba Waxc |
Virgin Olive |
10 |
56.8 ± 0.6 |
93.4 ± 0.4 |
8.5 ± 0.1 |
| Saturated Monoglyceride3,c |
Virgin Olive |
3 |
37 ± 0.5 |
62.3 ± 0.5 |
2.8 ± 0.1 |
| Saturated Monoglyceride3,c |
Virgin Olive |
7 |
45.2 ± 0.3 |
80.7 ± 5.3 |
5.5 ± 1.2 |
| Saturated Monoglyceride3,c |
Virgin Olive |
10 |
49.0 ± 1.5 |
99.9 ± 0.1 |
9.4 ± 0.0 |
| Carnauba Waxd |
Pomegranate seed |
7 |
55.7 ± 0.5 |
73.3 ± 3.6 |
6.3 ± 0.0 |
| Carnauba Waxd |
Pomegranate seed |
10 |
56.2 ± 1.7 |
97.3 ± 2.7 |
8.7 ± 0.0 |
| Saturated Monoglyceride3,d |
Pomegranate seed |
7 |
43.8 ± 1.3 |
54 ± 1.8 |
7.0 ± 0.1 |
| Saturated Monoglyceride3,d |
Pomegranate seed |
10 |
48.5 ± 1.1 |
72.3 ± 0.1 |
9.4 ± 0.2 |
| Beeswax with butter aromae |
Virgin Olive |
5 |
- |
99 ± 0 |
3.5 ± 0.0 |
| Beeswax with strawberry aromae |
Virgin Olive |
5 |
- |
99 ± 0 |
3.6 ± 0.1 |
| Beeswax with banana aromae |
Virgin Olive |
5 |
- |
99 ± 0 |
3.6 ± 0.1 |
| Sunflower wax with Strawberrye |
Virgin Olive |
5 |
- |
99 ± 0 |
3.4 ± 0.0 |
| Sunflower wax with butter aromae |
Virgin Olive |
5 |
- |
99 ± 0 |
3.5 ± 0.2 |
| Sunflower wax with banana aromae |
Virgin Olive |
5 |
- |
97 ± 0 |
3.4 ± 0.1 |
| Carnauba Waxf |
Canola |
15 |
62.9 ± 2.5 |
99.4 ± 0.2 |
13.0 - 14.0 |
| Carnauba Waxf |
Canola |
10 |
60.3 ± 0.5 |
99.0 ± 0.2 |
9.5 - 10.5 |
| Carnauba Waxf |
Canola |
5 |
54.3 ± 3 |
85.1 ± 4.2 |
4.0 - 5.0 |
| Beeswaxf |
Grapeseed |
15 |
21.7 ± 0.2 |
99.5 ± 0.2 |
12.5 - 13.5 |
| Beeswaxf |
Grapeseed |
10 |
19.8 ± 0.3 |
99.7 ± 0.5 |
7.5 - 8.5 |
| Beeswaxf |
Grapeseed |
5 |
15.1 ± 1.9 |
99.5 ± 0.1 |
3.0 - 4.0 |
Cooling rate in DSC was 5 °C/min for almost all samples, except for rice bran wax organogels, which were analyzed with a cooling rate of 2 °C/min and were marked with the number 1;
2Indicates a mix of Canola and Soybeen oil (50:50);
3Identify organogelators based on hydrogenated palm oil (EEC-no E 471, FDA-CFR-no.184.1505).
aDassanayake et al., 2009; bBlake et al.,2014; cÖǧütcü and Yilmaz, 2014a; dÖǧütcü and Yilmaz, 2014b; eÖǧütcü and Yilmaz, 2015; and fYi et al., 2017. |
2.4. Solid fat contentTOP
The determination of solid fat content frequently follows an AOCS Official Method, which the most appropriate would be the Cd 16-93 (1997) for non-stabilizing fats and oils, used to analyze fats like cocoa butter substitutes and replacers with fast crystallization. This is a non-destructive method that uses Nuclear Magnetic Resonance (NMR) laboratorial equipment. The tempering process stipulated in the protocol is similar to organogel tempering, which allows comparison with other results.
The content of solids in organogels is in general smaller than the proportion of waxes added to the solution, which indicates that all the crystals present in the organogel are from the vegetable wax without further alterations in the oil (Dassanayake et al., 2009). It was also observed that organogelation rarely occurs in solutions with less than 3% solids (Table 1). Unfortunately, the authors who obtained organogel at a low vegetable wax concentration (≤ 1%) did not analyze the solid fatty content of the solutions at critical concentration (Hwang et al., 2012; Blake et al., 2014). X-ray diffraction analysis can be used to verify whether the crystals present in the bulk vegetable waxe and in the organogels are the same, corroborating with the previous idea that the crystals are only from the vegetable waxes.
2.5. X-ray diffractionTOP
X-ray diffraction is a rapid analysis that has been widely used to understand organogelation. However, the theory behind it is complex and deserves some attention. A good explanation about the x-ray diffraction (XRD) theory may be found in the work by Idziak (2012). What is important to understand here is that during crystallization, molecules are initially packed (Figure 3A) and form sub cells (Figure 3B), which are the structuring parts of the unit cells (Figure 3C and 3D, Mullin, 1961; Hartel, 2001; Idziak, 2012). A unit cell is a highly organized structure with 2 and 3-dimensional space configurations and is the fundamental building block of a crystal (Idziak, 2012). A crystal will have the same geometry as the unit cells and may be called cubic, tetragonal, orthorhombic, trigonal, hexagonal, monoclinic and triclinic, depending on the angle between plains of the 3D geometry faces (Figure 3E) and the distance between parallel lattices and the face under the analysis (Figure 3F, d-spacing). Figure 3F shows a representation of the x-ray of diffraction analysis, where d-spacing is shown as the distance between two lattices and obtained by applying Bragg’s law, as presented in equation (1):
|
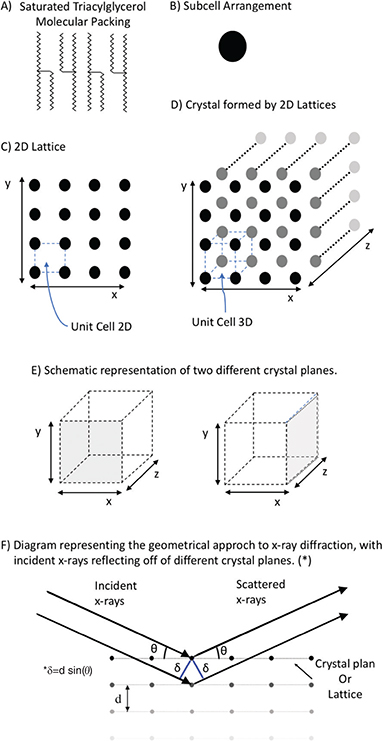 Figure 3. Schematic representation of crystal substructures and XRD analysis. A) Packing of a generic saturated triacylglycerol, B) Molecular packing organized in sub cell structure, C) Unit cells forming a lattice 2D, D) Ensemble of lattices 2D forming a crystal, E) Representation of a crystal to show the different planes analyzed using XRD, and F) Diagram to represent XRD analysis of a crystal face and parallel internal lattices. Figure 3. Schematic representation of crystal substructures and XRD analysis. A) Packing of a generic saturated triacylglycerol, B) Molecular packing organized in sub cell structure, C) Unit cells forming a lattice 2D, D) Ensemble of lattices 2D forming a crystal, E) Representation of a crystal to show the different planes analyzed using XRD, and F) Diagram to represent XRD analysis of a crystal face and parallel internal lattices.
|
|
n λ =2 d sin (θ) eq. (1)
where n is the order of reflection, λ is the wavelength of the incident x-rays, d is the interplanar distance and θ is the angle between lattice and incident x-ray. The most commonly used source of x-rays is copper (Cu), which emits radiation with a wavelength of 1.54 Å (Marangoni and Wesdorp, 2013).
Since vegetable wax could be used as an additive or trans and fully saturated fatty acid substitute in lipid based products, it would be beneficial for vegetable wax compound to present a sub cell structure configuration which is similar to lipid crystals. For instance, triacylglycerols may crystallize in α, β’ and β sub cell polymorphisms, which have hexagonal, orthorhombic and triclinic crystalline geometry, respectively (Sato, 2001; Dassanayake et al., 2009; Idziak, 2012). The capacity that triacylglycerols have to pack in several ways causes changes in the sub cell structure and, by consequence, alters the unit cell organization, what is known as polymorphism (Sato, 2001; Hartel, 2001). β’ is considered the optimal triacylglycerol polymorphism for milk fat-based food and substitutes due to its thermodynamic properties, stability and better texture and mouth-feel than other polymorphisms (Dassanayake et al., 2009; Hartel, 2001).
In x-ray diffraction analysis the sub cell packing may be characterized by the number of peaks and the distance between lattices
(d), or plans of unit cells (Dassanayake et al., 2009; Idziak, 2012). For instance, triacylglycerol presents crystals at α configuration when one peak is detected with d-spacing at 4.15 Å, β’ when a main peak with d-spacing at 4.2 Å is present and a second peak at 3.8 Å and, β configuration presents one peak with d-spacing at 4.6 Å.
The relation between the number of peaks, d-spacing between lattices of vegetable waxes and organogels of vegetable waxes in edible oil is presented in Table 2. The authors have identified crystals either in the bulk vegetable waxes or in the organogel with an x-ray diffraction pattern close to triacylglycerols in the β’ polymorphic configuration (Table 2). This is an interesting result because it indicates the possibly good technological and functional properties of vegetable wax crystals. Furthermore, a similar x-ray diffraction pattern of bulk and organogel shows that crystals come exclusively from the neat vegetable wax (Dassanayake et al., 2009). In addition, crystals with β’ polymorphic configuration may have a needle-like or a platelet-like morphology that can be visualized using polarized light microscopy.
Table 2. Main values of d-spacing for wide-angle analysis in XRD for bulk vegetable waxes and their respective organogels
| Source of Vegetable Wax |
Source of Edible Oil |
Concentration [%] |
Main Peak (Å) |
Second Peak (Å) |
Author |
| Carnauba |
- |
100 |
0.415 |
0.373 |
Dassanayake et al., 2009
|
| Carnauba |
Olive |
8 |
0.413 |
0.372 |
Dassanayake et al., 2009
|
| Candellila |
- |
100 |
0.409 |
0.37 |
Dassanayake et al., 2009
|
| Candellila |
Olive |
8 |
0.413 |
0.372 |
Dassanayake et al., 2009
|
| Rice bran |
- |
100 |
0.415 |
0.373 |
Dassanayake et al., 2009
|
| Rice bran |
Olive |
8 |
0.415 |
0.373 |
Dassanayake et al., 2009
|
| Carnauba |
Olive |
10 |
0.416 |
0.374 |
Öǧütcü and Yilmaz, 2014 |
| Carnauba |
Pomegranate |
10 |
0.414 |
0.373 |
Öǧütcü and Yilmaz, 2015a |
| Carnauba |
Hazelnut |
7 |
0.414 |
0.373 |
Öǧütcü and Yilmaz, 2015b |
| Carnauba |
Hazelnut |
10 |
0.414 |
0.373 |
Öǧütcü and Yilmaz, 2015b |
| Carnauba |
- |
100 |
0.412 |
0.373 |
Öǧütcü and Yilmaz, 2015b |
| Sunflower |
Hazelnut |
3 |
0.414 |
0.373 |
Öǧütcü and Yilmaz, 2015b |
| Sunflower |
Hazelnut |
7 |
0.414 |
0.373 |
Öǧütcü and Yilmaz, 2015b |
| Sunflower |
Hazelnut |
10 |
0.415 |
0.373 |
Öǧütcü and Yilmaz, 2015b |
| Sunflower |
- |
100 |
0.413 |
0.372 |
Öǧütcü and Yilmaz, 2015b |
2.6. Crystal morphologyTOP
The morphological structure of a crystal may be seen under a microscope with polarized light. In agreement with XRD analysis, vegetable wax crystals present a needle-like morphology. It was observed from previous works that a high concentration of esters in the vegetable wax seems to be related to bigger and isolated needle-like crystals (Blake et al., 2014). Further, a tendency to form clusters in the presence of minor compounds was noticed (Blake et al., 2014). Figure 4 presents examples of flax and wheat straw wax crystals in canola oil at 5 and 6% (w/w), and the influence of the composition and concentration on crystal size, shape, density and morphology can be seen. Waxes from flax straw are rich in esters and aldehydes (del Río et al., 2013), which help the formation of crystals with homogeneous size and high density. Wheat straw waxes present important concentrations of β-diketones and primary alcohols (Racovita et al., 2016), a composition that is related to a less homogeneous crystal morphology at a lower concentration and the formation of huge crystals at higher concentrations.
|
 Figure 4. Micrographs of vegetable wax in canola oil organogels consisting of a) wax from flax straw at 5% (w/w), b) wax from flax straw at 6% (w/w), c) wax from wheat straw at 5% (w/w) and d) wax from wheat straw at 6% (w/w). Figure 4. Micrographs of vegetable wax in canola oil organogels consisting of a) wax from flax straw at 5% (w/w), b) wax from flax straw at 6% (w/w), c) wax from wheat straw at 5% (w/w) and d) wax from wheat straw at 6% (w/w).
|
|
Images from a polarized light microscope may be analyzed using specialized software to determine the number of crystals or the porosity (% area/area) present in the organogel (Blake et al., 2014). A free software able to do this analysis is the ImageJ® (National Institute of Health, USA). It would be always necessary to avoid visual adjustments during the image analysis methodology to allow for better reproducibility of the results.
It is important to analyze organogel at the same concentration as the previous analysis for comparison and for better understanding of the relationship between morphology and oil structuring. Regarding oil structuring, one of the expected characteristics of the crystal is the capacity to entrap oil, maintaining it at a liquid state but immobilized. To evaluate the capacity of a determined group of crystals to hold oil, an analysis was developed called “oil binding capacity”.
2.7. Oil binding capacityTOP
The theory behind the oil binding capacity analysis is interesting because it would be able to determine the amount of oil entrapped within the crystals of an organogel. To measure this holding capacity, two methods have been used. One was proposed by Blake et al., (2014), where the general idea was to determine the amount of oil able to migrate from the structured organogel in 24 h. This is a homemade analysis that resembles the method for the determination of oil blooming (Matsuda et al., 2001) mixed with water-binding capacity (Lewicki et al., 1978). The authors transferred already structured organogel (100 g) to a funnel, which was placed over a graduated test tube. Then, the set was placed at 40 °C and the volume of oil which flowed from the sample to the test tube was measured periodically. In addition to interesting results, considering the fact that most analysis are done at room temperature, which is not necessarily a good organogelator, this method uses 40 °C due to varying melting behavior, and is isolated without possibility for comparison.
The other method used is centrifuge based and was initially proposed by Da Pieve et al., (2010). Some adaptations of the method have appeared elsewhere (Öǧütcü and Yilmaz, 2014; Öǧütcü and Yilmaz, 2015a; Öǧütcü and Yilmaz, 2015b), mainly related to the organogel tempering process before analysis. For instance, up to now, the best procedure for filling sample containers (Eppendorf tube of 1.5 mL) with organogel (~ 1 g)
has been to transfer the solutions in their liquid state to the Eppendorf tubes and allow them to cool down to room temperature, therefore following a similar tempering procedure to other analyses. The results for oil binding capacity (OBC) from this last method are presented in Table 1. Vegetable wax concentration, solid fatty content and oil binding capacity are related and a total oil binding capacity was not necessary to structure an oil (Table 1).
3. CONCLUSIONSTOP
Vegetable waxes are interesting organogelators. However, analysis is delicate because all the methods may have a similar tempering process. Alterations in the cooling rate from one analysis to another may cause variations in the number and size of the crystals
(Mullin, 1961; Hartel, 2001), leading to misinterpreting results, thus producing error.
A water bath with controlled cooling rate and microscope stages with temperature control are still new laboratory equipment, but in the future could help to understand the temperature of cooling variations on organogelation. It would also be possible to more freely adjust the cooling rate temperatures in all analyses. Until then, allowing the samples to cool down to room temperature and use a controlled temperature of cooling rate at 5 °C/min DSC and a rheometer seems to be the best option.
Other analyses can be used to evaluate organogel, such as FT-IR, Raman, Cryo-SEM, Texture and oxidative stability, and are also found in the literature. On the other hand, the objective of this work was to present key analyses to allow the characterization of a vegetable wax as an organogel. Further analyses may be done to evaluate organogel as a product or in the presence of compounds that could interact with it during application, such as lecithin.
ACKNOWLEDGEMENTSTOP
The authors would like to thank CAPES (Brazil) for the Ph.D. Scholarship – Process BEX11898-13-5 and NSERC (Canada) for the operating grant.
REFERENCESTOP
| ○ |
Aggarwal P. 2001. Phase transition of apple cuticles: a DSC study. Thermochim. Acta 367–368, 9–13. https://doi.org/10.1016/S0040-6031(00)00701-2
|
| ○ |
AOCS official method Cd 16b-93. 1997. Solid fat content (SFC) by low-resolution nuclear magnetic resonance, Sampling and analysis of commercial fats and oils, p. 1–6. |
| ○ |
Blake AI, Co ED, Marangoni, AG. 2014. Structure and physical properties of plant wax crystal networks and their relationship to oil binding capacity. J. Am. Oil Chem. Soc. 91, 885–903. https://doi.org/10.1007/s11746-014-2435-0 |
| ○ |
Co ED, Marangoni AG. 2012. Organogels: An alternative edible oil-structuring method. J. Am. Oil Chem. Soc. 89, 749–780. https://doi.org/10.1007/s11746-012-2049-3 |
| ○ |
Dassanayake LSK, Kodali DR, Ueno S, Sato K. 2009. Physical properties of rice bran wax in bulk and organogels. J. Am. Oil Chem. Soc. 86, 1163–1173. https://doi.org/10.1007/s11746-009-1464-6 |
| ○ |
Ensikat HJ, Neinhuis C, Barthlott W. 2000. Direct access to plant epicuticular wax crystals by a new mechanical isolation method. Int. J. Plant Sci. 161,143–148. |
| ○ |
Fayaz G, Goli SAH, Kadivar MA. 2017. A novel propolis wax-based organogel: Effect of oil type on its formation, crystal Structure and thermal properties. J. Am. Oil Chem. Soc. 94, 47–55. https://doi.org/10.1007/s11746-016-2915-5 |
| ○ |
Flory PJ. 1953. Principles of polymer chemistry. Cornell University Press, Ithaca. ISBN 978-0-8014-0134-3
|
| ○ |
Hartel RW. 2001. Crystallization in foods, Aspen Publishers, Inc. ISBN 978-0-8342-1634-1
|
| ○ |
Hwang HS, Kim S, Singh M, Winkler-Moser JK, Liu SX. 2012. Organogel formation of soybean oil with waxes. J. Am. Oil Chem. Soc. 89, 639–647. https://doi.org/10.1007/s11746-011-1953-2 |
| ○ |
Hwang HS, Singh M, Bakota EL, Winkler-Moser JK, Kim S, Liu SX. 2013. Margarine from organogels of plant wax and soybean oil. J. Am. Oil Chem. Soc. 90, 1705–1712. https://doi.org/10.1007/s11746-013-2315-z |
| ○ |
Idziak SH. 2012. Powder x-ray diffraction of triglycerides in the study of polymorphism. In Marangoni AG (Ed.) Structure-function analysis of edible fats. 2nd ed, AOCS Press. Chap. 3. https://doi.org/10.1016/B978-0-12-814041-3.00003-4 |
| ○ |
Lewicki PP, Busk GC, Labuza TP. 1978. Measurement of gel water-building capacity of gelation, potato starch, and carrageenan gels by suction pressure. J. Colloid Interf. Sci. 64,(3), 501–509. https://doi.org/10.1016/0021-9797(78)90391-0
|
| ○ |
Lupi FR, Gabriele D, Facciolo D, Baldino N, Seta L, de Cindio B. 2012. Effect of organogelator and fat source on rheological properties of olive oil-based organogels. Food Res. Int. 46, 177–184. https://doi.org/10.1016/j.foodres.2011.11.029 |
| ○ |
Lupi FR, Greco V, Baldino N, de Cindio B, Fischer P, Gabriele D. 2016. The effects of intermolecular interactions on the physical properties of organogels in edible oils. J. Colloid Interf. Sci. 483, 154–164. https://doi.org/10.1016/j.jcis.2016.08.009 |
| ○ |
Marangoni AG, Wesdorp LH. 2013. Nucleation and crystalline growth network. In Marangoni AG and Wesdorp LH (Ed.) Structure and properties of fat crystals network, CRC Press, 2nd Ed, Chap. 2. ISBN: 9781439887622
|
| ○ |
Matsuda H, Yamaguchi M, Arima H. 2001. Separation and crystallization of oleaginous constituents in cosmetics: sweating and blooming. In Garti N and Sato K (Ed.), Crystallization Process in Fats and Lipid System, CRC Press, 1st ed., chap. 14. ISBN 9780824705510
|
| ○ |
Mullin JW. 1961. Mechanism of crystallization, In Mullin JW (Ed.). Crystallization. Butterworths, London, p. 101–135. |
| ○ |
O’Sullivan CM, Barbut S, Marangoni AG. 2016. Edible oleogels for the oral delivery of lipid soluble molecules: Composition and structural design considerations. Trends Food Sci. Tech. 57, 59–73. https://doi.org/10.1016/j.tifs.2016.08.018 |
| ○ |
Öǧütcü M, Yılmaz E. 2014. Oleogels of virgin olive oil with carnauba wax and monoglyceride as spreadable products. Grasas Aceites 65, e040. https://doi.org/10.3989/gya.0349141 |
| ○ |
Öǧütcü M, Yılmaz E. 2015a. Comparison of the pomegranate seed oil organogels of carnauba wax and monoglyceride. J. Appl. Polym. Sci. 132. https://doi.org/10.1002/app.41343 |
| ○ |
Öǧütcü M, Yılmaz E. 2015b. Characterization of Hazelnut Oil Oleogels Prepared with Sunflower and Carnauba Waxes. Int. J. Food Prop. 18, 1741–1755. https://doi.org/10.1080/10942912.2014.933352 |
| ○ |
Pieve S da, Calligaris S, Panozzo A, Arrighetti G, Nicoli MC. 2011. Effect of monoglyceride organogel structure on cod liver oil stability. Food Res. Int. 44, 2978–2983. https://doi.org/10.1016/j.foodres.2011.07.011 |
| ○ |
Pollard M, Beisson F, Li Y, Ohlrogge JB. 2008. Building lipid barriers: biosynthesis of cutin and suberin. Trends Plant. Sci. 13, 236–246. https://doi.org/10.1016/j.tplants.2008.03.003 |
| ○ |
Racovita RC, Hen-Avivi S, Fernandez-Moreno JP, Granell A, Aharoni A, Jetter R. 2016. Composition of cuticular waxes coating flag leaf blades and peduncles of Triticum aestivum cv. Bethlehem. Phytochem. 130, 182–192. https://doi.org/10.1016/j.phytochem.2016.05.003 |
| ○ |
Rheingans B, Mittemeijer EJ. 2015. Calorimetry. Max Planck Institute for Intelligent Systems. |
| ○ |
Río JC del, Prinsen P, Gutiérrez A. 2013. A comprehensive characterization of lipids in wheat straw. J. Agric. Food Chem. 61, 1904–1913. https://doi.org/10.1021/jf304252m
|
| ○ |
Sagiri SS, Singh VK, Kulanthaivel S, Banerjee I, Basak P, Battachrya MK, Pal K. 2015. Stearate organogel–gelatin hydrogel based bigels: Physicochemical, thermal, mechanical characterizations and in vitro drug delivery applications. J. Mech. Behav. Biomed. 43, 1–17. https://doi.org/10.1016/j.jmbbm.2014.11.026 |
| ○ |
Sato K. 2001. Crystallization behaviour of fats and lipids: a review. Chem. Eng. Sci. 56, 2255–2265. https://doi.org/10.1016/S0009-2509(00)00458-9
|
| ○ |
Singh A, Auzanneau FI, Rogers MA. 2017. Advances in edible oleogel technology – A decade in review. Food Res. Int. 97, 307–317. https://doi.org/10.1016/j.foodres.2017.04.022 |
| ○ |
Smith DK. 2009. Lost in translation? Chirality effects in the self-assembly of nanostructured gel-phase materials. Chem. Soc. Rev. 38, 684. https://doi.org/10.1039/B800409A |
| ○ |
Tan CP, Ng SP, Lim HK. 2015. Application of DSC analysis in palm oil, palm kernel oil, and coconut oil: from thermal behaviors to quality parameters. In Chiavaro E. (Ed.) Differential scanning calorimetry: applications in fat and oil technology, CRC Press. Chap. 8, 199–219. ISBN 9781466591523
|
| ○ |
Terech P, Weiss RG. 1997. Low molecular mass gelators of organic liquids and the properties of their gels. Chem. Rev. 97, 3133–3159. https://doi.org/10.1021/cr9700282 |
| ○ |
Yi B, Kim MJ, Lee SY, Lee J. 2017. Physicochemical properties and oxidative stability of oleogels made of carnauba wax with canola oil or beeswax with grapeseed oil. Food Sci. Biotechnol. 26, 79–87. https://doi.org/10.1007/s10068-017-0011-8 |
| ○ |
Yılmaz E, Öǧütcü M. 2015. The texture, sensory properties and stability of cookies prepared with wax oleogels. Food. Funct. 6, 1194–1204. https://doi.org/10.1039/c5fo00019j |