Monitoring of the oxidation of the oil from sacha inchi (Plukenetia volubilis) seeds supplemented with extracts from tara (Caesalpinia spinosa) pods using conventional and MIR techniques
C. Hermana, *, D.R. Pompeub, D. Camposc, Y. Larondelled, H. Rogeza and V. Baetene
aCentre for Valorization of Amazonian Bioactive Compounds (CVACBA), Universidade Federal do Pará, Av. Perimetral da Ciência, km 01, s/n, 66.095-780 Belém-PA, Brazil.
bDepartamento de Tecnologia de Alimentos, Centro de Ciências Naturais e Tecnologia (CCNT), Universidade do Estado do Pará, Trav. Enéas Pinheiro nº2626, 66095-100 Belém-PA, Brazil.
cInstituto de Biotecnología (IBT), Universidad Nacional Agraria La Molina, Av. La Molina s/n, Lima, Peru.
dInstitut des Sciences de la Vie, Université catholique de Louvain, Croix du Sud nº2/8, 1348 Louvain-la-Neuve, Belgium
eCentre Wallon de Recherches Agronomiques (CRA-W), Département Valorisation des Productions, Unité Qualité des Produits, Chaussée de Namur n°24, 5030 Gembloux, Belgium.
*Corresponding author: christelle@ufpa.br
| |
SUMMARY
This work focuses on the characterization of the oxidation of the oil from sacha inchi seeds (Plukenetia volubilis) under accelerated conditions at 60 ºC for 15 days. Five samples were monitored: three supplemented with 200 ppm of non-hydrolyzed or partially hydrolyzed (for 4 and 9 hours) extracts from tara (Caesalpinia spinosa) pods, one without antioxidant and one with 200 ppm of BHT. Several conventional techniques (induction time, peroxide value, conjugated dienoic acid, p-anisidine value, total unsaturated fatty acids and α-linolenic acid contents) and the MIR spectroscopy coupled with chemometric tools were used and compared. The results revealed that whatever the antioxidant added, the oil from sacha inchi is fairly stable over time. The results also pointed out that extracts from tara pods, mainly those partially hydrolyzed, were more efficient than BHT against oil oxidation for up to 7 days. Finally, this paper shows that MIR spectroscopy presents an interesting alternative technique for the monitoring of the oxidation of the oil from sacha inchi.
|
| |
RESUMEN
Monitorización de la oxidación del aceite de semillas de sacha inchi (Plukenetia volubilis) suplementado con extractos de vainas de tara (Caesalpinia spinosa) mediante técnicas convencionales y MIR. Este trabajo se centra en la caracterización de la oxidación de aceites de sacha inchi (Plukenetia volubilis) en condiciones aceleradas a 60 ºC durante 15 días. Se monitorean cinco muestras: tres suplementadas con 200 ppm de extractos no hidrolizados o parcialmente hidrolizados (durante 4 y 9 horas) de vainas de tara (Caesalpinia spinosa), una sin antioxidante y otra con 200 ppm de BHT. Se utilizan y comparan varias técnicas convencionales (tiempo de inducción, índice de peróxido, ácido dienoico conjugado, índice de p-anisidina, ácidos grasos insaturados totales y contenido de ácido α-linolénico) y la espectroscopía MIR junto con herramientas quimiométricas. Los resultados revelan que, cualquiera que sea el antioxidante agregado, el aceite de sacha inchi es bastante estable a lo largo del tiempo. Los resultados también señalan que los extractos de las vainas de tara, principalmente aquellos parcialmente hidrolizados, son más eficientes que el BHT contra la oxidación del aceite hasta los 7 días. Finalmente, el trabajo muestra que la espectroscopía MIR se presenta como una técnica alternativa interesante para el monitoreo de la oxidación del aceite de sacha inchi.
|
1. INTRODUCTIONTOP
Sacha inchi (Plukenetia volubilis) is an oleaginous plant which grows in the tropical Peruvian jungles at altitudes between 200 and 1500 m. At maturity, the seeds contain, on average, 48-54% oil (Niu et al., 2014), 27% protein (Hamaker et al., 1992; Guillén et al., 2003), and a high content in bioactive compounds such as tocopherols, carotenoids and phenolic compounds (Chirinos et al., 2013). The oil from sacha inchi seeds, hereafter denominated as sacha inchi oil, presents a differentiated fatty acid composition, with a high percentage of unsaturated fatty acids (approximately 90%), with 40-50% of α-linolenic acid (C18:3 ω-3) and 35-40% of linoleic acid (C18:2 ω-6) (Maurer et al., 2012; Liu et al., 2014). Due to its high contents in essential fatty acids, sacha inchi oil may be used as an ingredient in natural food supplements (Follegatti-Romero et al., 2009).
Unfortunately, the unsaturated fatty acids of sacha inchi oil are easily deteriorated through processes of oil oxidation (Hamaker et al., 1992, Maurer et al., 2012). The oxidation of fats and oils may occur in the presence of oxygen, light, heat and/or enzymes. This deterioration process affects the sensorial and nutritional properties of the oil, producing off-flavors and odors, in addition to inducing the formation of potentially toxic compounds. A number of factors, such as the conditions of the oxidation of the oil (Follegatti-Romero et al., 2009), the profile and the chemical structure of the fatty acids, the concentration and type of endogenous or supplemented antioxidants, or the storage conditions (temperature, oxygen, relative humidity…), can interfere in the oxidative stability of fats and oils (Choe and Min, 2006).
The usual strategy for improving the oxidative stability of oils is the addition of antioxidants. Such compounds inhibit or delay oil oxidation by scavenging free radicals, chelating pro-oxidative metals, quenching the singlet oxygen or inactivating the lipoxygenase enzyme (Choe and Min, 2009). Synthetic antioxidants have been widely used in most countries; however, there are still doubts about their safety for human consumption, mainly at high concentrations during long-term intake. During the last decades, various works have studied the effect of the addition of natural antioxidants, mainly those extracted from vegetable sources, with the purpose of minimizing or avoiding the use of synthetic antioxidants in oils. The most abundant natural antioxidants are tocopherols, carotenoids and phenolic compounds. These latter can be obtained from any part (i.e., leaf, stem, root, seed, fruit, bark…) of plants such as spices, herbs, fruits and vegetables (Taghvaei and Jafari, 2015).
The vegetable source of phenolic compounds investigated in this work is the tara (Caesalpinia spinosa) pod. Tara is a native leguminous tree that grows on the Peruvian coast and in the Andean region at altitudes from 1000 to 2900 m (Chambi et al., 2013). The selection of this source was oriented by its natural abundance in South-East America and the low market price of its fruits. Moreover, while tara seeds are consumed by the local population, tara pods are considered a residue, which represent approximately 65% of the fruit. Recent works have identified that tara pods have a high concentration of hydrolyzed tannins (approximately 50% of the dry matter), specifically gallotannins (Giovando et al., 2013; Chambi et al., 2013).
While submitted to a process of hydrolysis, gallotannins release free gallic acid. Such a process favors an increase in antioxidant capacity. A chemical process of hydrolysis of gallotannins, using 2 N sulfuric acid at 100 ºC for 26 hours, was initially proposed by Inoue and Hagerman (1988). Such a process promotes complete hydrolysis. Chambi et al., (2013) demonstrated the feasibility of obtaining extracts from tara pods with high antioxidant capacity without incurring a complete hydrolysis. More specifically, the authors showed that the hydrolysis time of 4 hours allowed for almost 50% of hydrolysis, a 2-fold reduction in gallotannins, while it contributed to a 7-fold increase in free gallic acids compared to the non-hydrolized extracts from tara pods. Moreover, after this time, the highest antioxidant capacity was obtained. Furthermore, the hydrolysis time of 9 hours was sufficient to promote almost 100% of hydrolysis, with a 20-fold reduction in gallotannins and a 15-fold increase in free gallic acids (Chambi et al., 2013; Aguilar-Galvez et al., 2014).
Many analytical techniques can be used for monitoring the process of oil oxidation; each one provides complementary information on both primary and secondary oxidation products (Barriuso et al., 2013). Conventional and empirical methods are widely used as they allow for a good estimation of the status of oil oxidation and are well-documented in the literature. However, more recently, some alternative spectroscopic methods have been developed, aiming to obtain more precise information about the mechanism of oil oxidation. One of such method is Mid-Infrared (MIR) spectroscopy, which is an easy, rapid, economical and non-destructive technology (Baeten et al., 2015; Abbas et al., 2012).
Terán-Hilares et al., (2017) have recently evaluated the efficiency of partially hydrolyzed (up to 3 hours) extracts from tara pods against the oxidation of sacha inchi oil using accelerated storage tests (at 55 °C for 30 days). The extracts were tested alone and in combination with other binary mixtures (α-tocopherol, citric acid or ascorbyl palmitate). Thanks to the use of conventional analytical techniques, the authors show that the different partially hydrolyzed extracts from tara pods do not have significant effects on the oil oxidation process compared to the negative (without antioxidant) and the positive (with synthetic BHT) controls. The only treatments that displayed a higher protective effect on the oxidation of sacha inchi oil were those performed with binary mixtures, mainly the mixture of 400 ppm of partially hydrolyzed (for 3 hours) extracts from tara pods and 100 ppm of ascorbyl palmitate.
In this context, the main objective of the present work is to determine whether a higher hydrolysis time (> 3 hours) of the extracts from tara pods could promote a significant protection of the highly unsaturated sacha inchi oil when used alone and at lower concentrations (< 400 ppm). More specifically, the paper compares the protective effect of the addition of 200 ppm of the non-hydrolyzed or two partially-hydrolyzed (for 4 and 9 hours) extracts from tara pods with the use of 200 ppm of a synthetic antioxidant commonly used in fats and oils. The work monitors the process of oil oxidation by several conventional (induction time, peroxide value, conjugated dienoic acid, p-anisidine value, total unsaturated fatty acids and α-linolenic acid contents) and alternative (MIR spectroscopy) techniques.
2. MATERIAIS AND METHODSTOP
2.1. Sample preparationTOP
2.1.1. Oil from sacha inchi seedsTOP
Fresh sacha inchi seeds were harvested from the Province of Lamas (Region of San Martín, Peru), at optimum maturity. They were roasted (140 ºC for 20 min) using an air circulation oven. After cooling, the outer skin was manually removed from the seed. Cisneros et al., (2014) showed that roasting increased the antioxidant capacity of the seeds, and contributed to a slower rate of oil oxidation than seeds which were not roasted. Then, the oil from sacha inchi was obtained by cold-pressing the de-hulled seeds using a screw press (KOMET, DD85G, German) according to a warm-press procedure at 50 °C (4 – 5x10³ psi for 20 min). The extracted oil was decanted naturally in a fridge (4 ºC for 48 h) and vacuum filtrated through Whatman No. 1.
2.1.2. Extracts from tara podsTOP
Fresh tara pods were purchased from a local market in Caraz (Ancash, Peru). The seeds were removed from the pods and the tara pods were washed under tap water and air dried at 55 °C. They were subsequently milled and stored at -20 °C until the extraction and hydrolysis of their phenolic compounds.
The extraction and hydrolysis of the phenolic compounds from tara pods were both done according to the optimized procedure described by Chambi et al., (2013). The extraction of the phenolic compounds from milled tara pods was carried out by employing 80% (v/v) acetone/water as solvent and a solid/liquid ratio of 1/100 (w/v). The extraction was carried out at 4 °C for 20 h without agitation. Then, the suspension was centrifuged at 10,000 g for 15 min and the supernatant liquid phase was vacuum concentrated at 38 °C until dryness. The resulting powder was dissolved with Milli-Q water. This aqueous solution was cooled at approximately 4 °C for 16 h, and centrifuged at 10,000 g for 10 min. The clarified solution obtained was referred to as the whole extract of tara pods. The concentration of the total phenolic compounds of the whole extract was 24.11 mg gallic acid equivalent / mL (determined by the Folin Ciocalteu method). The process of hydrolysis was performed as follows. The whole extract was diluted with a 2 N sulfuric acid solution until reaching a total phenolic compound concentration of approximately 20 mg gallic acid equivalent/mL such diluted extract is called the non-hydrolized extract (NHE). Then, the mixture was put in an air circulation oven at 100 °C. The two hydrolysis times used in this work were 4 and 9 hours. The resulting solutions were centrifuged at 10,000 g for 10 min, and the clarified solutions were referred to as hydrolyzed extract for 4 hours (HE4H) and hydrolyzed extract for 9 hours (HE9H)., The concentration of the total phenolic compounds of the NHE, HE4H and HE9H were 21.36, 17.54 and 17.15 mg gallic acid equivalent / mL, respectively. Such concentrations are comparable to those obtained by Chambi et al., (2013).
2.2. Oil oxidation methodologyTOP
The oxidation of sacha inchi oil was studied under accelerated conditions, according to the Schaal oven stability test (AOCS Cg 5-97, with small adaptations). For this purpose, mixtures of 92 g of sacha inchi oil and 200 ppm of antioxidant (i.e., 18.4 mg gallic acid equivalent), previously diluted with 5% ethanol according to the weight of the final oil solution (i.e., approximately 4.6 mL of ethanol) were prepared and homogenized by stirring for 15 min. Subsequently, 10 mL of this oil solution was transferred to 50 mL open dark glass bottles and subjected to accelerated oxidation in an air circulation oven at 60 ºC for a total period of exposure of 15 days. The experimental design was realized as detailed in point 2.3. As soon as the samples were taken out of the oven, they were stored at -18 ºC, until further analyses (see points 2.4 and 2.5).
2.3. Experimental designTOP
The experimental plan used in this work was a full 5x3 factorial design, corresponding to 15 experimental conditions. The two factors investigated were the type of antioxidant added and the oxidation time. With regards to antioxidants, the effect of the three extracts from tara pods, namely NHE, HE4H and HE9H, were investigated. The volumes of extract added to the sacha inchi oil were 0.86, 1.04 and 1.07 mL, respectively. A positive control (with 18.4 mg synthetic BHT diluted in 4.6 mL ethanol) and a negative control (SIOIL - without antioxidant but with 4.6 mL ethanol) were also studied. Concerning the oxidation times, three collections (at 0, 7 and 15 days) were taken during the period of exposure. All experiments were conducted in triplicate, totalizing 45 independent experiments.
2.4. Conventional techniquesTOP
Oil oxidation was monitored by several conventional techniques, including the determination of the induction time by DSC (see point 2.4.1.), the measurement of the peroxide value, conjugated dienoic acids and p-anisidine (see point 2.4.2), and the identification of the fatty acid profile by GC (see point 2.4.3). Each analysis was performed once for each of the 45 samples.
2.4.1. Induction time by DSCTOP
The oxidative stability of sacha inchi oil samples was evaluated by Differential Scanning Calorimetry (DSC) (Perkin Elmer, Pyris 6, Funkentstort, The Netherlands) (Cross et al., 1970). The equipment was previously calibrated with pure indium. An empty open aluminum crucible was used as a reference in order to obtain the baseline. Samples of 5.0 ± 0.1 mg of sacha inchi oil were individually weighed in the open aluminum crucible and placed into the sample chamber of the DSC equipment. The chamber temperature was increased from 30 to 120 ºC at 40 ºC/min, then held at 120 ºC for 120 min. Pure oxygen was flushed through the sample at 35 mL/min. The induction time was determined as the onset time of the endothermic peak of oxidation.
2.4.2. Peroxide value, conjugated dienoic acids and p-anisidineTOP
The primary and secondary oxidation products in the sacha inchi oil samples were evaluated according to official methodologies. The peroxide value (AOCS Cd 8-53, 1998) and the conjugated dienoic acids (AOAC 957.13, 1995) are indicative of the primary products formed during the oil oxidation process. The peroxide value quantifies the amount of lipid hydroperoxides and the conjugated dienoic acids are relative to the fatty acids with two or more conjugated double bonds. Secondary products were evaluated with the determination of the p-anisidine value, which is an indicative of the amount of unsaturated aldehydes (IUPAC method 2.504, 1987).
2.4.3. Fatty acid profile by gas chromatographyTOP
The fatty acid profile of the sacha inchi oil samples was determined by gas chromatography (GC), according to the European Commission guideline for the analysis of dairy fat (CCE, 1977), with slight modifications as suggested by Meurens et al., (2005). The chromatograph used was a Carlo Erba (Milano, Italy) GC 6000 Vega Series 2 with a SGE (Austin, TX) BPX70 column. The content of each fatty acid was expressed as the percentage of the total fatty acids identified. This paper was mainly interested in the total mono- and poli-unsaturated fatty acids (MUFA + PUFA), on the one hand, and in the α-linolenic acid (C18:3 ω-3) content, on the other hand. The monitoring of these specific fatty acids is due to their high unsaturation degrees which make them sensitive to oxidation (Cisneros et al., 2014).
2.4.4. Statistical treatmentTOP
The results obtained from 2.4.1 to 2.4.3 were expressed as the mean value ± standard deviation of the triplicate. The results were submitted to the one-way analysis of variance (ANOVA) and the Fisher LSD test, with a significance level of 95% (α = 0.05), using the STATISTICA software version 7.0 (Statsoft Inc., Tulsa / Oklahoma, USA).
2.5. Mid Infrared (MIR) spectroscopyTOP
2.5.1. Spectra acquisitionTOP
The MIR spectra of the sacha inchi oil samples were collected with an ATR ‘Golden Gate’ accessory installed into a Vertex 70 FT-IR spectrometer (Bruker Optics,Billerica / Massachusetts, United States). A drop of sacha inchi oil sample of approximately 15 μL was placed onto the crystal ATR. More information about the MIR analysis proposed can be found in Abbas et al., (2012) and Stefanov et al., (2013). Each spectrum resulted on the average of 64 scans recorded in a range from 4500 to 700 cm−1 at a spectral resolution of 4 cm−1. All measurements were performed at room temperature and repeated three times, leading to 135 MIR spectra.
2.5.2. Chemometric analysisTOP
The spectral data treatment and chemometric analysis were carried out using the software The Unscrambler X Version 10.3 (CAMO Software Inc., Magnolia / Texas, United States). Different pre-processing strategies of the raw spectral data were evaluated. First, the spectral zones [4500 – 3550] and [2500 – 1900] cm−1 of the 135 MIR spectra were eliminated as they presented no significant information (Guillén et al., 2003; Gutiérrez et al., 2017). Then, the spectra data were normalized, using the Standard Normalization (SNV), and pre-processed according to the Savitzky-Golay ten-point derivative function. The Principal component analysis (PCA) was used for facilitating the visualization and interpretation of the MIR spectral changes occurring during oil oxidation. For this purpose, we used: (1) the spectra calculated as the average of the three measurements per sample (45 independent experiments); and (2) the spectra calculated as the average of the triplicate of each treatment and each time (15 experimental conditions).
3. RESULTS AND DISCUSSIONSTOP
3.1. Conventional techniquesTOP
Figure 1 presents the results obtained from the different conventional techniques (i.e., induction time, peroxide value, conjugated dienoic acid, p-anisidine value, total unsaturated fatty acids and α-linolenic acid contents) for the analysis of the oxidation of sacha inchi oil under accelerated conditions at 60 ºC after 0, 7 and 15 days, while submitted to the different treatments (i.e., SIOIL, NHE, HE4H, HE9H and BHT). The results are presented as the average value ± standard deviation of the triplicate of each experimental condition. The one-way analysis of variance (ANOVA) and the Fisher LSD test, with a significance level of 95% (α = 0.05), was used to statistically differentiate the results of the five treatments for each time (see lower case letters in Figure 1) and the results of the three times for each treatment (see capital case letters in Figure 1).
|
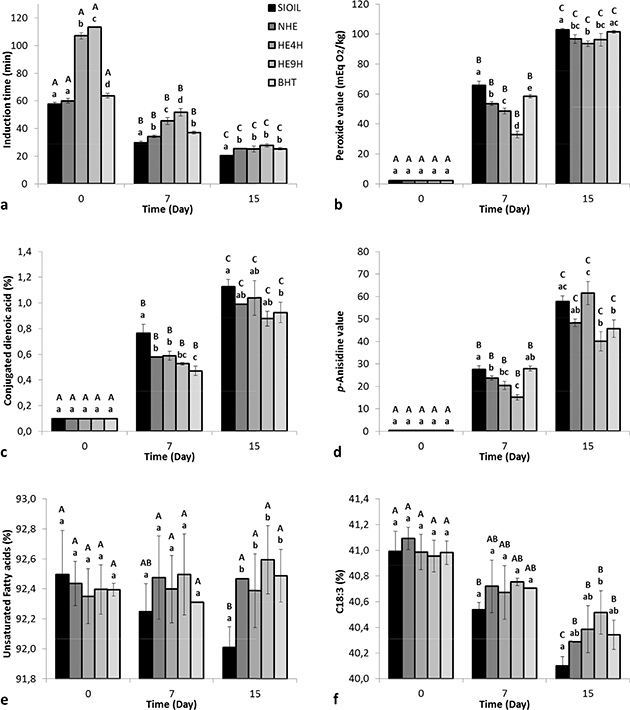 Figure 1. Induction time (a), peroxide value (b), conjugated dienoic acids (c), p-anisidine value (d), unsaturated fatty acids (e) and α-linolenic acid (C18:3) (f) of the sacha inchi oil during accelerated conditions at 60 ºC for 15 days (day 0, 7 and 15) while submitted to the different treatments. SIOIL= negative control; BHT = positive control; NHE = non hydrolyzed extract from tara pods; HE4H = hydrolyzed extract for 4 hours; and HE9H = hydrolyzed extract for 9 hours. Results are presented as the average value ± the standard deviation (n = 3). Different lower case letters between the treatments for each time and different capital case letters between the times for each treatment imply that the values are statistically different, using the one-way analysis of variance (ANOVA) and the Fisher LSD test, with a significance level of 95% (p ≤ 0.05). Figure 1. Induction time (a), peroxide value (b), conjugated dienoic acids (c), p-anisidine value (d), unsaturated fatty acids (e) and α-linolenic acid (C18:3) (f) of the sacha inchi oil during accelerated conditions at 60 ºC for 15 days (day 0, 7 and 15) while submitted to the different treatments. SIOIL= negative control; BHT = positive control; NHE = non hydrolyzed extract from tara pods; HE4H = hydrolyzed extract for 4 hours; and HE9H = hydrolyzed extract for 9 hours. Results are presented as the average value ± the standard deviation (n = 3). Different lower case letters between the treatments for each time and different capital case letters between the times for each treatment imply that the values are statistically different, using the one-way analysis of variance (ANOVA) and the Fisher LSD test, with a significance level of 95% (p ≤ 0.05).
|
|
3.1.1. Initial time: characterization of the oil from sacha inchiTOP
The values for the physicochemical parameters evaluated for the SIOIL treatment at the initial time (day 0) are presented in Table 1. Our results are similar to the ones obtained by other authors (see Table 1). The main differences may be due to the genetic variability and the maturity of the sacha inchi seeds, the country of collection, and the process used for the extraction of the oil.
Table 1. Characterization of sacha inchi oil, including the induction time, peroxide value, conjugated dienoic acids, p-anisidine value, unsaturated fatty acids and α-linolenic acid (C18:3) contents, and comparison with the literature, organized in chronological order
| Parameter |
Unit |
Value |
Literature |
| Induction time |
min |
57.83 ± 1.04 |
56.9 ± 0.06 (Teran-Hilares et al., 2017)
|
| Peroxide value |
Meq O2 / kg |
2.16 ± 0.12 |
0.57 ± 0.01 (Cisneros et al., 2014)
1.85 ± 0.06 (Liu et al., 2014)
0.74 ± 0.07 (Gutiérrez et al., 2017)
3.40 ± 0.01 (Teran-Hilares et al., 2017)
|
| Conjugated dienoic acids |
% |
0.097 ± 0.002 |
|
| p-anisidine value |
|
0.36 ± 0.04 |
0.43 ± 0.04 (Cisneros et al., 2014)
0.53 ± 0.14 (Gutiérrez et al., 2017)
|
| Unsaturated Fatty Acids |
% |
92.50 ± 0.29 |
90.0 (Maurer et al., 2012)
93 (Liu et al., 2014)
92.92 ± 0.23 (Gutiérrez et al., 2017)
|
| α-linolenic acid (C18:3) |
% |
40.99 ± 0.16 |
50.41 (Follegatti-Romero et al., 2009)
44.0 ± 1.3 (Maurer et al., 2012)
48.2 ± 0.4 (Cisneros et al., 2014)
44 (Liu et al., 2014)
47.33 ± 1.21 (Gutiérrez et al., 2017)
|
As expected, there is no statistical difference between the values for the physicochemical parameters evaluated for the different treatments at the initial time (day 0) (see lower case letters in Fig. 1). The only exception is for the induction time (see Figure 1a), where the HE4H and HE9H treatments presented values which were twice higher (approximately 110-120 min) than the three other treatments (i.e., SIOIL, NHE and BHT, with approximately 60 min). According to Taghvaei and Jafari (2015), this result seems to indicate that these two partially-hydrolyzed extracts from tara pods would have a higher thermal stability and a stronger prevention efficiency against the oxidation of sacha inchi oil than the other three treatments. The values obtained in this work for the SIOIL, NHE and BHT treatments were similar to those obtained by Terán-Hilares et al., (2017), with 56.9 ± 0.06, 57.4 ± 0.4 and 55.8 ± 0.27 min, respectively. The authors also obtained a statistically higher value for the induction time (68.5 ± 0.5 min), using the partially-hydrolyzed (for 3 hours) extract of tara pods.
3.1.2. Effect of the oxidation time TOP
From of general point of view (Choe and Min, 2006), the results presented in Figure 1 indicate that there was a process of oxidation which occurred in sacha inchi oil with oxidation time, no matter the treatment applied (see capital case letters in Figure 1). The significant decrease in the induction time at 120 ºC (see Figure 1a) with oxidation time indicated a decrease in the oxidative stability of the sacha inchi oil during the period of exposure. The significant increase in peroxide values (see Fig. 1b), conjugated dienoic acids (see Figure 1c) and p-anisidine values (see Figure 1d) with oxidation time indicated the formation of primary and secondary oxidation products during oxidation time. Eventually, the conservation of the total unsaturated fatty acids with oxidation time (see Figure 1e), and the significant decrease in α-linolenic acids (C18:3) (see Figure 1f) with oxidation time, are a typical consequence of the process of oil oxidation.
The evolution of the values for the physicochemical parameters of the SIOIL treatment with oxidation time can be compared with the literature. Similar peroxide values were found by Maurer et al., (2012) while studying the oxidative stability of sacha inchi oil during 20 days at 65 ºC. Our peroxide values and p-anisidine values were also comparable to the ones obtained by Cisneros et al., (2014), who determined the oxidative stability of the oil obtained from roasted sacha inchi seeds subjected to high-temperature oxidation at 60 °C for 30 days. Finally, our results for induction time, peroxide values and p-anisidine values were smaller to the ones obtained by Terán-Hilares et al., (2017), who monitored the oxidative stability of sacha inchi oil without supplementation and with the addition of partially-hydrolyzed (up to 3 hours) extract of tara pods during an accelerated storage test at 55 °C for 30 days. This could be explained by the fact that the authors used unroasted sacha inchi seeds for the extraction of the oil.
Regarding the data obtained by CG (see Figures 1e and 1f), our values for the unsaturated fatty acids and α-linolenic acid contents in the SIOIL treatment during oil oxidation were also comparable with the literature. Maurer et al., (2012) showed that the unsaturated fatty acids did not change significantly with oxidation time (at 65 °C for 20 days). Cisneros et al., (2014) showed a very slight modification in the fatty acid profile and a decrease in the concentration of α-linolenic acid of sacha inchi oil during oxidation (at 60 °C for 30 days).
The recommended limits for the peroxide value in refined edible oil for commercialization and human consumption are defined as 10 (Codex Alimentarius, 1999) and 30 mEq O2/kg (Gotoh and Wada, 2006), respectively. One can observe in Figure 1b that such values are exceeded for all treatments after 7 days of oxidation. This suggests the importance of carrying out more systematic monitoring of the sacha inchi oil during the first days of the oxidation process.
3.1.3. Effect of the antioxidantsTOP
One can observe in Figures 1a, 1b, 1c and 1d that the SIOIL treatment presented significantly different (p ≤ 0.05) values for the physicochemical parameters evaluated after 7 days of oxidation (i.e., lower for induction time and higher for peroxide value, conjugated dienoic acids and p-anisidine value) than the other four treatments (see lower case letters in Figure 1). This confirms that the sacha inchi oil samples without antioxidant were more sensitive to the oxidation process than the ones supplemented with synthetic or natural antioxidants. However, after 15 days, the values for the physicochemical parameters evaluated for all five treatments were almost the same, as indicated by the statistical analysis. With regards to the unsaturated fatty acids and the α-linolenic acid (C18:3) (see Fig. 1e and 1f), the results from the different treatments did not present statistical difference after 7 days of oxidation. However, after 15 days, it could be seen that the only statistically smaller value for unsaturated fatty acids was the one from the SOIL treatment.
It is interesting to observe that the different treatments exhibitted different behaviors in the evolution of the physicochemical parameters evaluated during oil oxidation. This can be observed though the estimation of the rate of production of the primary and secondary oxidation products per unit of time during oil oxidation. The rate in question is expressed by Equation 1. Considering that the evaluated physicochemical parameter is noted as A: rA,dt is the rate of variation of A per unit of time, dA is the difference in value for A in the time interval, dt, considered, k is the rate constant kinetic and n is the apparent order of the reaction. The kinetics of oil oxidation processes are frequently described by zero (n = 0) or first (n = 1) order kinetic models.

According to the coefficients of the linear regression (r2), the kinetic model that best adjusted to the results of the peroxide value, conjugated dienoic acids and p-anisidine value corresponded to a zero order kinetic model for all treatments (r2 ≥ 0.95) (see Table 2). This may be in part due to the reduced number of experimental oxidation times (i.e., 0, 7 and 15 days).
Table 2. Rate constant kinetic (k) relative to a zero (n = 0) and a first (n = 1) order kinetic model, and rate of variation per day between the initial time and 7 days of oxidation (r[0-7]), between 7 and 15 days of oxidation (r[7-15]), and between the initial and final oxidation times (r[0-15]) of the peroxide value (PV), conjugated dienoic acids (CD) and p-anisidine value (pA) for the five treatments. SIOIL = negative control; BHT = positive control; NHE = non hydrolyzed extract from tara pods; HE4H = hydrolyzed extract for 4 hours; and HE9H = hydrolyzed extract for 9 hours
| Parameter |
Index |
Unit |
SIOIL |
NHE |
HE4H |
HE9H |
BHT |
| PV |
kPV for n=0 |
meq O2 / kg / day |
7.13 |
6.49 |
6.19 |
5.93 |
6.87 |
| |
r2 |
- |
0.96 |
0.99 |
0.99 |
0.97 |
0.98 |
| |
kPV for n=1 |
1 / day |
0.299 |
0.29 |
0.286 |
0.277 |
0.295 |
| |
r2 |
- |
0.76 |
0.8 |
0.81 |
0.9 |
0.79 |
| |
r[0-7] |
meq O2 / kg / day |
9.09 |
7.35 |
6.63 |
4.39 |
8.04 |
| |
r[7-15] |
meq O2 / kg / day |
4.62 |
5.39 |
5.63 |
7.91 |
5.38 |
| |
r[0-15] |
meq O2 / kg / day |
6.71 |
6.3 |
6.1 |
6.27 |
6.62 |
| CD |
kCD for n=0 |
% / day |
0.073 |
0.061 |
0.064 |
0.054 |
0.055 |
| |
r2 |
- |
0.95 |
0.99 |
0.99 |
0.99 |
0.99 |
| |
kCD for n=1 |
1 / day |
0.186 |
0.172 |
0.175 |
0.163 |
0.163 |
| |
r2 |
- |
0.8 |
0.86 |
0.87 |
0.86 |
0.91 |
| |
r[0-7] |
% / day |
0.1 |
0.07 |
0.07 |
0.06 |
0.05 |
| |
r[7-15] |
% / day |
0.05 |
0.05 |
0.06 |
0.04 |
0.06 |
| |
r[0-15] |
% / day |
0.07 |
0.06 |
0.06 |
0.05 |
0.06 |
| pA |
kpA for n=0 |
1 / day |
3.85 |
3.21 |
3.85 |
2.55 |
3.18 |
| |
r2 |
- |
0.97 |
0.99 |
0.97 |
0.99 |
0.97 |
| |
kpA for n=1 |
1 / day |
0.388 |
0.375 |
0.384 |
0.353 |
0.376 |
| |
r2 |
- |
0.79 |
0.79 |
0.85 |
0.84 |
0.75 |
| |
r[0-7] |
1 / day |
3.88 |
3.32 |
2.86 |
2.1 |
3.94 |
| |
r[7-15] |
1 / day |
3.77 |
3.07 |
5.13 |
3.11 |
2.21 |
| |
r[0-15] |
1 / day |
3.82 |
3.19 |
4.07 |
2.64 |
3.02 |
Table 2 also presents the rate of variation per day of the peroxide value, conjugated dienoic acids and p-anisidine value between the initial time and 7 days of oxidation (r[0-7]), between 7 and 15 days of oxidation (r[7-15]), and between the initial and final oxidation time (r[0-15]). One can observe that the rates of variation per day between the initial and final oxidation time (r[0-15]) are almost the same for all treatments with slightly higher values for the SIOIL treatment and lower values for the HE9H treatment. However, the rate of variation per day at the beginning (r[0-7]) and at the end (r[7-15]) of the exposure period are very different. In particular, Table 2 shows that, for the SOIL, NHE and BHT treatments, the rate of production of primary and secondary oxidation products per day during the [0-7] period is higher than during the [7-15] period (i.e., r[0-7]> r[7-15]). A similar trend was also observed by Maurer et al., (2012) during the oxidation of sacha inchi oil at 65 °C for 20 days, and by Terán-Hilares et al., (2017) during the oxidation of sacha inchi oil without supplementation, and supplemented with BHT and a partially-hydrolyzed (for 3 hours) extract from tara pods. On the contrary, the HE4H and HE9H treatments present a lower rate of variation per day at the beginning of the exposure period than at the end (i.e., r[0-7] < r[7-15]). This observation confirms that the two partially-hydrolyzed extracts from tara pods delay the process of oil oxidation. It is interesting to observe that these two treatments present the highest coefficients of the linear regression (r2) relative to a first order kinetic model, with r2 > 0.80 for all the physicochemical parameters evaluated.
A progressive protection of sacha inchi oil against oxidation was observed with the increase in the hydrolysis time of the extracts from tara pods: NHE < HE4H < HE9H. This is shown by the statistically different values for induction time, peroxide value, conjugated dienoic acid and p-anisidine value after 7 days of oxidation (see Figures 1d). This can also be confirmed by the decrease in the rate constant kinetic relative to both the zero and the first order kinetic models with the increase in the hydrolysis time of the extracts (see Table 2). It may be explained by the increase in the free gallic acid content with hydrolysis time (Chambi et al., 2013), and by the fact that this specific phenolic compound has high thermal stability (Taghvaei and Jafari, 2015). Throughout the analysis, the HE9H treatment presented the best protection against oil oxidation up to 7 days of oxidation, even better than the positive control, with BHT.
3.2. Mid infrared spectroscopy (MIR)TOP
Figure 2 presents the MIR spectrum of the sacha inchi oil calculated as the average of the 135 MIR spectra collected. This spectrum shows the characteristic absorbance bands of vegetable oils with some well-defined bands in the [3500 – 2500] cm−1 region and other overlapping bands in the fingerprint region ([1900 – 700] cm−1) (Baeten and Dardenne, 2002; Maurer et al., 2012). More specifically, the MIR sprectrum of the sacha inchi oil is very similar to the ones previously obtained and fully described by Guillén et al., (2003) and Gutiérrez et al., (2017).
|
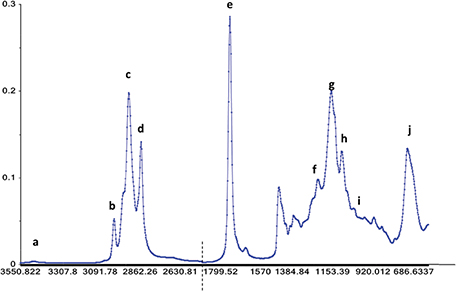 Figure 2. MIR spectrum of sacha inchi oil calculated as the average of the 135 MIR spectra collected in the spectral regions [3550 –
2500] and [1900 – 700] cm−1. Spectral bands (a) to (j) are described in the text. Figure 2. MIR spectrum of sacha inchi oil calculated as the average of the 135 MIR spectra collected in the spectral regions [3550 –
2500] and [1900 – 700] cm−1. Spectral bands (a) to (j) are described in the text.
|
|
This paper focuses only on the spectral bands that may be affected during oil oxidation. In the [3500 – 2500] cm−1 region, a first weak peak (a) is observed and associated to the carbonyl group (C=O). Then, the three main bands (b), (c) and (d) are associated to the stretching vibration of the cis alkene group (–HC=CH–), the asymmetrical and symmetrical vibrations of the methylene group (=CH2), respectively. The high values for the frequency of these bands are an indicator of the high proportion of unsaturated fatty acids in the sacha inchi oil. In the fingerprint region from 1900 to 700 cm−1, some interesting bands are observed. The high band (e) results from the stretching vibration of the carbonyl group (C=O), which is characteristic of oils with a high unsaturation degree. The two bands (f) and (h) are typical of the stretching vibrations of the C–O group in ester. The band (g) is characteristic of the bending vibration of the of the methylene group (= CH2). The weak band (i) and the higher band (j) both correspond to the out-of-plane bending vibration of the isolated trans alkene group (–HC=CH–).
To detect the differences between the spectral characteristics in the MIR region, PCA was performed with the pre-processed MIR spectra collected for the different samples of sacha inchi oil. The projection onto the two main principal component (PC) coordinates, PC1 e PC2, is presented in Figure 3. Figure 3a presents the PCA carried out with the spectra calculated as the average of the three measurements per sample (45 independent experiments), and Figure 3b shows the PCA of the spectra calculated as the average of the triplicate of each treatment and each time (15 experimental conditions). Figure 3 clearly shows separated clusters according to the oxidation times (0, 7 or 15 days). Such discrimination was previously observed and described by Mauer et al., (2012) while monitoring sacha inchi oil without antioxidant supplementation during 20 days at 65 ºC using MIR technology. The inspection of the loadings for PC1 and PC2 (not shown here) reveals that the most important spectral zone for the discrimination sacha inchi oil is the carbonyl-stretching (C=O) band region [1780 – 1690] cm−1. One could observe that the cluster corresponding to the initial time (day 0) is more elongated than the other two (i.e., after 7 and 15 days of oxidation). This should be explained by the influence of the addition of antioxidants (i.e., BHT and the extracts from tara pods) on the sacha inchi oil. On the other hand, the cluster corresponding to 15 days of oxidation is the smallest one. This observation may be due to the fact that, at this oxidation time, the sacha inchi oil presents values for the physicochemical parameters evaluated (i.e., induction time, peroxide value, dienolic conjugated acids and p-anisidine value in Figures 1a, 1b, 1c and 1d, respectively) which are quite similar regardless of the treatment applied. Interestingly, Figure 3 shows that the samples corresponding to the SIOIL treatment are located at the extreme bottom of the 2D-plot, confirming that this treatment is more affected by the oxidation process than the four other treatments, with antioxidant supplementation.
|
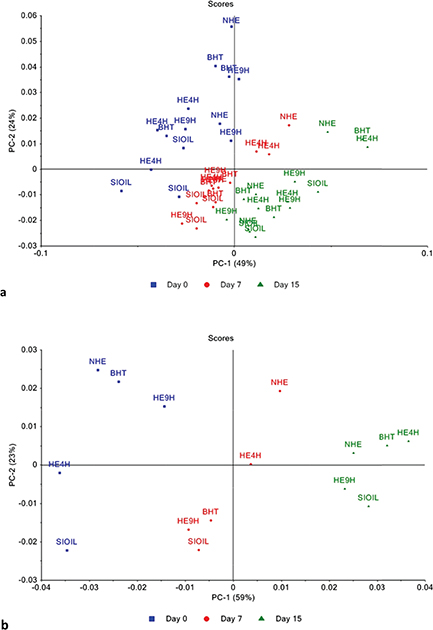 Figure 3. Principal Component Analysis (PCA) carried out on the pre-processed MIR spectra of sacha inchi oil during accelerated conditions at 60 ºC for 15 days (day 0, 7 and 15) while submitted to the five treatments. SIOIL = negative control; BHT = positive control; NHE = non hydrolyzed extract from tara pods; HE4H = hydrolyzed extract for 4 hours; and HE9H = hydrolyzed extract for 9 hours. (a) PCA with the spectra calculated as the average of the three measurements per sample (45 independent experiments), (b) PCA with the spectra calculated as the average of the triplicate of each treatment and each time (15 experimental conditions). Figure 3. Principal Component Analysis (PCA) carried out on the pre-processed MIR spectra of sacha inchi oil during accelerated conditions at 60 ºC for 15 days (day 0, 7 and 15) while submitted to the five treatments. SIOIL = negative control; BHT = positive control; NHE = non hydrolyzed extract from tara pods; HE4H = hydrolyzed extract for 4 hours; and HE9H = hydrolyzed extract for 9 hours. (a) PCA with the spectra calculated as the average of the three measurements per sample (45 independent experiments), (b) PCA with the spectra calculated as the average of the triplicate of each treatment and each time (15 experimental conditions).
|
|
Finally, Figure 4 presents the differences in MIR spectra. The blue line presents the difference between the MIR spectrum calculated as the average of all MIR spectra collected on day 0 and the MIR spectrum calculated as the average of all MIR spectra collected on day 7. The red line is the difference between the MIR spectra calculated as the average of all MIR spectra collected on day 0 and the MIR spectra calculated as the average of all MIR spectra collected on day 15. Figure 4 allows for identifying the main transformations occurring in the sacha inchi oil samples throughout the oxidation time: production of peroxides and hydroperoxides ([4500 -3400] cm−1); reduction in the cis alkene group (-CH=CH-) ([3068 - 3008] cm−1); formation of free fatty acids (1711 cm−1); and the increase in the trans alkene group (-CH=CH-). Such observations are typical of the oxidation process of oils (Choe and Min, 2006) and are coherent with the results obtained from the conventional analytical techniques (see Figure 1).
|
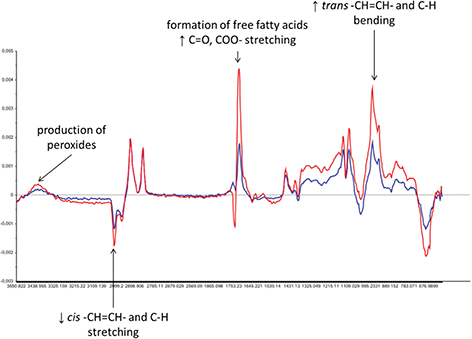 Figure 4. Differences among average MIR spectra. Blue line: difference between the MIR spectrum calculated as the average of all MIR spectra collected at day 0 and the MIR spectrum calculated as the average of all MIR spectra collected at day 7. Red line: difference between the MIR spectra calculated as the average of all MIR spectra collected at day 0 and the MIR spectra calculated as the average of all MIR spectra collected at day 15. Figure 4. Differences among average MIR spectra. Blue line: difference between the MIR spectrum calculated as the average of all MIR spectra collected at day 0 and the MIR spectrum calculated as the average of all MIR spectra collected at day 7. Red line: difference between the MIR spectra calculated as the average of all MIR spectra collected at day 0 and the MIR spectra calculated as the average of all MIR spectra collected at day 15.
|
|
4. CONCLUSIONSTOP
Thanks to the measurement of various physicochemical parameters commonly used in oil oxidation processes and the use of the MIR spectroscopy coupled with chemometric tools, this work allows for ample monitoring of the oxidation process of sacha inchi oil supplemented with natural antioxidants from tara pods. The results point out that the addition of 200 ppm of the extracts from tara pods, mainly those partially hydrolyzed for 9 hours, is more efficient than the use of 200 ppm BHT for the protection of the sacha inchi oil against oxidation. This result is promising for the food industry, mainly in South-East America, once the tara pod is considered as a residue, the extraction and hydrolysis of the phenolic compounds do not require specific or expensive equipment and reagents, and the concentration of the partially-hydrolyzed extract which needs to be added into sacha inchi oil is reasonable (i.e., 200 ppm). However, more research should be done concerning, for example, the scale-up of the process and the determination of possible toxic effects due to human consumption. This paper also shows that the MIR technique could be very useful in the food industry as a rapid screening technique for the follow up of oil status in supplementation experiments, presenting short analysis time, low cost, absence of sample preparation and re-usability of the samples as main advantages regarding the conventional techniques.
AKNOWLEDGMENTTOP
We are grateful to the Commission Universitaire pour le Développement - CUD (Belgium), and Conselho Nacional de Desenvolvimento Científico e Tecnológico - CNPq (Brazil) for their financial support. We also want to thank Quentin Arnould and Dr Ouissam Abbas for their help in the MIR analysis.
REFERENCESTOP
| ○ |
Abbas O, Dardenne P, Baeten, V. 2012. Near-Infrared, Mid-Infrared, and Raman Spectroscopy In: Chemical Analysis of Food: Techniques and Applications, Pico Y. Burlington, Elsevier Science, 59–91. |
| ○ |
Aguilar-Galvez A, Noratto G, Chambi F, Debaste F, Campos, D. 2014. Potential of tara (Caesalpinia spinosa) gallotannins and hydrolysates as natural antibacterial compounds. Food Chem. 156 (1), 301–304. https://doi.org/10.1016/j.foodchem.2014.01.110 |
| ○ |
AOAC 957.13 1995. Acids (Polyunsaturated) in Oils and Fats Spectrophotometric Method. Official Methods of Analysis. |
| ○ |
AOCS Recommended Practice Cd 8–53. 1997. Peroxide Value—Acetic Acid-Chloroform Method. Official Methods and Recommended Practices of the AOCS, American Oil Chemists Society. |
| ○ |
AOCS Recommended Practice Cg 5–97. 1997. Oven Storage Test for Accelerated Ageing of Oils. Official Methods and Recommended Practices of the AOCS, American Oil Chemists Society. |
| ○ |
Baeten V, Dardenne P. 2002. Spectroscopy: Developments in Instrumentation and Analysis. Grasas Aceites. 53 (1), 45–63. https://doi.org/10.3989/gya.2002.v53.i1.289 |
| ○ |
Baeten V, Rogez H, Fernández Pierna JA, Vermeulen Ph, Dardenne P. 2015.Vibrational Spectroscopy Methods for the Rapid Control of Agro-Food Products. In Handbook of Food Analysis (3rd Edition). (Eds. Toldra & Nollet). Volume II, Chapter 32, pp. 591–614. |
| ○ |
Barriuso B, Astiasarán I, Ansoren D. 2013. A review of analytical methods measuring lipid oxidation status in foods: a challenging task. Eur. Food Res. Technol. 236 (1), 1–15. https://doi.org/10.1007/s00217-012-1866-9 |
| ○ |
Chambi F, Chirinos R, Pedreschi R, Betalleluz-Pallardel I, Debaste F, Campos D. 2013. Antioxidant potential of hydrolyzed polyphenolic extracts from tara (Caesalpinia spinosa) pods. Ind. Crop Prod. 47, 168–175. https://doi.org/10.1016/j.indcrop.2013.03.009 |
| ○ |
Chirinos R, Zuloeta G, Pedreschi R, MignoletE, Larondelle Y, Campos D. 2013. Sacha inchi (Plukenetia volubilis): A seed source of polyunsaturated fatty acids, tocopherols, phytosterols, phenolic compounds and antioxidant capacity. Food Chem. 141 (3), 1732–1739. https://doi.org/10.1016/j.foodchem.2013.04.078 |
| ○ |
Choe E, Min DB. 2006. Mechanisms and factors for edible oil oxidation. Compr. Rev. Food Sci. F. 5 (4), 169–186. https://doi.org/10.1111/j.1541-4337.2006.00009.x |
| ○ |
Choe E, Min DB. 2009. Mechanisms of antioxidants in the oxidation of foods. Compr. Rev. Food Sci. F. 8 (4), 345–358. https://doi.org/10.1111/j.1541-4337.2009.00085.x |
| ○ |
Cisneros FH, Paredes D, Arana A, Cisneros-Zevallos L. 2014. Chemical composition, oxidative stability and antioxidant capacity of oil extracted from roasted seeds of Sacha-inchi (Plukenetia volubilis L.). J. Agric. Food Chem. 62 (22), 5191–5197. https://doi.org/10.1021/jf500936j |
| ○ |
Codex Alimentarus. 1999. Codex Standard for Edible Fats and Oils Not Covered by Individual Standards. CODEX STAN 19–1981, Rev. 2-1999. Rome, Italy: Codex Alimentarius. |
| ○ |
Cross C.K. 1970. Oil Stability: A DSC Alternative for the Active Oxygen Method, J. Am. Oil Chem. Soc. 47 (6), 229–230. https://doi.org/10.1007/BF02638879 |
| ○ |
Commission des Communautés Européennes. 1977. Méthode d’analyse communautaire à utiliser pour la détermination de la teneur en acide érucique. Journal Officiel des Communautés Européennes, L12, 12–18 |
| ○ |
Follegatti-Romero LA, Piantino CR, Grimaldi R, Cabral FA. 2009. Supercritical CO2 extraction of omega-3 rich oil from Sacha inchi (Plukenetia volubilis L.) seeds. J. Supercrit. Fluids 49, 323–329. https://doi.org/10.1016/j.supflu.2009.03.010 |
| ○ |
Giovando S, Pizzi A, Pasch H, Pretorius N. 2013. Structure and oligomers distribution of commercial Tara (Caesalpina spinosa) hydrolysable tannin. Publications of the University of Lorraine. https://hal.univ-lorraine.fr/hal-01596680 |
| ○ |
Gotoh N, Wada S. 2006. The importance of peroxide value in assessing food quality and food safety. J. Am. Oil Chem. Soc. 83 (5), 473–474. https://doi.org/10.1007/s11746-006-1229-4 |
| ○ |
Guillén M, Ruiz A, Cabo N, Chirinos R, Pascual G. 2003. Characterization of Sacha inchi (Plukenetia volubilis L.) oil by FTIR spectroscopy and 1H NMR. J. Am. Oil Chem. Soc. 80 (8), 755–762. https://doi.org/10.1007/s11746-003-0768-z |
| ○ |
Hamaker BR, Valles C, Gilman R, Hardmeier RM, Clarck D, Garcia HH, Gonzales AE, Kohlstad I, Castro M, Valdivia R, Rodriguez T, Lescano M. 1992. Amino acid and fatty acid profiles of the Inca Peanut (Plukenetia volubilis). Cereal Chem. 69 (4), 461–463. |
| ○ |
IUPAC, Method Number 2.504. 1987. Determination of the p-Anisidine Value (p-A.V.), Standard Methods for the Analysis of Oils, Fats and Derivatives. |
| ○ |
Inoue KH, Hagerman AE. 1988. Determination of gallotannin with rhodanine. Anal. Biochem. 169 (2), 363–369. https://doi.org/10.1016/0003-2697(88)90296-5 |
| ○ |
Liu Q, Xu YK, Zhang P, Na Z, Tang T, Shi YX. 2014. Chemical composition and oxidative evolution of Sacha Inchi (Plukentia volubilis L.) oil from Xishuangbanna (China). Grasas Aceites. 65 (1), e012. https://doi.org/10.3989/gya.075713 |
| ○ |
Maurer NE, Hatta-Sakoda B, Pascual-Chagman G, Rodriguez-Saona LE. 2012. Characterization and authentication of a novel vegetable source of omega-3 fatty acids, sacha inchi (Plukenetia volubilis L.) oil. Food Chem. 134 (2), 1173–1180. https://doi.org/10.1016/j.foodchem.2012.02.143 |
| ○ |
Meurens M, Baeten V, Yan SH, Mignolet E, Larondelle Y. 2005. Determination of conjugated linoleic acids in cow’s milk fat by Fourier transform Raman spectroscopy. J. Agric. Food Chem. 53 (15), 5831–5835. https://doi.org/10.1021/jf0480795 |
| ○ |
Niu L, Li J, Chen MS, Xu ZF. 2014. Determination of oil contents in Sacha inchi (Plukenetia volubilis) seeds at different developmental stages by two methods: Soxhlet extraction and time-domain nuclear magnetic resonance. Ind. Crop Prod. 56, 187–190. https://doi.org/10.1016/j.indcrop.2014.03.007 |
| ○ |
Stefanov I, Baeten V, Abbas O, Vlaeminck B, De Baets B, Fievez V. 2013. Evaluation of FT-NIR and ATR-FTIR spectroscopy techniques for determination of minor odd- and branched-chain saturated and trans unsaturated milk fatty acids. J. Agric. Food Chem. 61, 3403–3413. https://doi.org/10.1021/jf304515v |
| ○ |
Taghvaei M, Jafari SM. 2015. Application and stability of natural antioxidants in edible oils in order to substitute synthetic additives. J. Food Sci. Technol. 52 (3), 1272–1282. https://doi.org/10.1007/s13197-013-1080-1 |
| ○ |
Teran-Hilares R, Chirinos R, Pedreschi R, Campos D. 2017. Enhanced antioxidant properties of tara (Caesalpinia spinosa) gallotannins by thermal hydrolysis and its synergistic effects with -tocopherol, ascorbyl palmitate, and citric acid on sacha inchi (Plukenetia volubilis) oil. J. Food Process Eng. 41 (1), 1–10. https://doi.org/10.1111/jfpe.12613 |