Effect of soil temperature during seed filling period on oleic/linoleic ratio, tocopherols and sugar contents in peanut kernels
R.J. Haro*, J.L. Dardanelli and M.J. Martínez
Instituto Nacional de Tecnología Agropecuaria (INTA), Estación Experimental Agropecuaria Manfredi, Manfredi CC 5988, Argentina.
*Corresponding author: haro.ricardo@inta.gob.ar; haroricardo@hotmail.com
| |
SUMMARY
The relationship of chemical quality of peanut seed with the soil temperature (ST) has received little attention. The aim of this work was to determine the effects of ST in the seed growth environment, during the seed filling period, on the oleic/linoleic acid (O/L) ratio, alpha, beta, gamma, delta tocopherols and the sum of them (TT), fructose, glucose and sucrose and the sum of them (FGS), contents in peanut kernels. Field experiments included cultivars (Florman and ASEM), water regimes (irrigated and water stress), sowing dates and alteration of ST. The response of O/L ratio to ST fitted a linear model, where the O/L ratio increased while ST increased. Mean O/L ratios were 1.31 for ASEM and 1.20 for Florman. The TT mean concentration was similar for both genotypes (478 ppm). A positive association between α-tocopherol (the main source of vitamin E) and ST, and a negative association between δ and α tocopherols were detected. The responses of FGS and sucrose to ST fitted linear models, where increments in ST showed decreases in FGS and sucrose concentrations. However, the decrease rates of FGS and sucrose in ASEM were three times lower than in Florman. The results showed that ST affected the chemical composition of peanut kernels, which mainly determines the shelf life and flavor of both genotypes differentially.
|
| |
RESUMEN
Efecto de la temperatura del suelo durante el periodo de llenado de la semilla sobre la relación oleico/linoleico, tocoferoles y contenido de azúcares en el grano de maní. La relación entre la composición química de los granos de maní con la temperatura del suelo (ST) ha recibido poca atención. El objetivo de este trabajo fue determinar los efectos de la temperatura del suelo en la zona de crecimiento de la vaina, durante el período de llenado de grano, sobre la relación oleico/linoleico (O/L), alpha, beta, gamma, delta tocoferoles y la suma de estos (TT), fructosa, glucosa y sacarosa y la suma de estas (FGS), contenidos en el grano de maní. Los experimentos incluyeron cultivares (Florman y ASEM), regímenes hídricos (riego y estrés hídrico), fechas de siembra y variaciones de ST. La respuesta de la relación O/L a ST se ajustó a un modelo lineal, donde aumentos de la temperatura del suelo implicaron incrementos de la relación O/L. La proporción media de O/L fue 1.31 para ASEM y 1.20 para Florman. La concentración de TT fue similar entre genotipos (478 ppm). Se observaron asociaciones positivas entre el contenido de α-tocoferol y negativas entre los contenidos de δ y α tocoferoles respecto del ST. Las relaciones entre FGS y sacarosa con la ST ajustaron a modelos lineales, donde incrementos de la ST implicaron disminuciones en las concentraciones de FGS y sacarosa. Sin embargo, las tasas de disminución de FGS y sacarosa en ASEM fueron tres veces menor que en Florman. Los resultados evidenciaron que la ST afectó la composición química del grano de maní que determina principalmente su vida útil y el sabor, diferencialmente en ambos genotipos.
|
1. INTRODUCTIONTOP
The peanut (Arachis hypogaea L.) is a legume crop that provides high quality protein and oil for human consumption in many countries. Over the last 40 years, in Argentina there has been a shift in the use of peanut crops from edible oil to confectionery products, and in the cultivar types used, from erect cultivars to runner cultivars (Sánchez et al., 2010), which contributed to an increase in crop production. Those changes strengthened the position of Argentina as peanut exporter to the world market (Ministerio de Agroindustria, 2019), making it the seventh-largest world producer and first world exporter. About 90% of the peanut production in the country is obtained in the province of Córdoba; hence, this crop is very important for the regional economy because only industrialized and high value-added products are exported, generating substantial profits annually. The high quality of peanut confectionery kernels and products such as blanched, coated, split, chopped, sliced, pellet and expeller, shelled, refined and unrefined oil, meal, paste and butter from Argentina are well known all over the world and are obtained under certified designation of origin which guarantees a product grown under the norms of Good Agricultural Practices (Cámara Argentina del Maní, 2019). To achieve international leadership, commercialization should be guaranteed with key aspects of kernel chemical composition which generate a balance between optimal shelf life, nutritional value, benefits to human health and a desirable flavor.
The peanut seed of commercial size contains approximately 50% oil and palmitic, oleic and linoleic acids account for more than 80% of the fatty acids (Savage and Keenan, 1994). The oxidation rate is an important factor which affects peanut shelf life stability (Talcott et al., 2005), and mainly depends on the oleic/linoleic acid ratio (O/L). Although linoleic acid is an essential fatty acid with nutritional benefits, it is more susceptible to oxidation than oleic acid; hence, O/L is a determinant factor in peanut oil quality and it has been widely used to predict the shelf life and oil stability of peanuts (Ahmed and Young, 1982).
Tocopherols are lipid-soluble natural antioxidants (Shintani et al., 2002) which contribute to shelf life, indicate the oxidative state, and stabilize the quality of stored peanut products (Warner et al., 1996; Nawar, 2000; Holownia et al., 2001; Frankel, 2005; Silva et al., 2010). In addition, the consumption of food containing tocopherols may help to reduce the incidence of certain diseases (Messina, 1999; Higgs, 2002; Tucker and Townsend, 2005). Four different isomers are synthesized in seed peanuts: alpha (α-), beta (β-), gamma (γ-) and delta (δ-) tocopherols (Shintani et al., 2002). δ-tocopherol is the component with the highest relative antioxidant activity, followed by γ-, β-, and α-tocopherols (Shintani et al., 2002) with α-tocopherols being the essential vitamin E. The most abundant tocopherols in peanut seeds are α-tocopherol (50–373
ppm) and γ-tocopherol (90–390 ppm) (Firestone, 1999; Messina, 1999; Higgs, 2002; Tucker and Townsend, 2005; Silva et al., 2010).
The content in soluble sugars is associated with sweetness, affects the sensorial attributes of the kernel (Bett et al., 1994) and gives desirable flavor characteristics to this product. Previous studies (Gadgil and Mitra, 1983; Bascha, 1992) reported genotypic variability in sugar concentration, with sucrose as the main component responsible for conferring sweetness to peanuts. The combination of oil, O/L ratio, tocopherols and sugar content strongly affects the seeds’ chemical quality. However, the chemical and sensory composition of peanut seeds is influenced by environmental factors (crop season, locality and crop season and locality interaction), genetic factors (cultivars or advanced breeding lines) and genotype and environment interaction and storage conditions (Sanders et al., 1982; Dwivedi et al., 2000; Andersen and Gorbet, 2002; Silva et al., 2010; Yol and Uzun, 2018). The environmental conditions in the province of Córdoba, the main peanut producing region in Argentina and the southernmost and coldest place in the world where peanuts are produced, are highly suitable for sugar accumulation, which gives a sweeter flavor to the peanut seeds (Casini et al., 2003; Misra, 2004). Sugar content is one of the most important traits in the chemical and nutritional composition of peanuts grown in Argentina and contributed to the obtainment of the certified designation of origin (Martinez et al., 2010).
Peanut pods develop underground and, therefore, their growth is mainly affected by environmental conditions in the pods’ growth zone (e.g. soil temperature in the first 5–7 cm). Accordingly, possible associations between chemical quality and soil temperature should be considered. Some relevant factors that modify soil temperature are soil types, water availability in the pods’ growth zone and tillage systems. In this sense, the province of Córdoba presents various soil textures (e.g. clay, loamy and sandy soils) (Panigatti, 2010), and the seed filling period is affected by water availability (e.g. irrigated or rain-fed soils) (Haro et al., 2008) and different tilling practices (e.g. conventional, reduced or no tillage) (Haro and Casini, 2008).
Until now, most studies have associated the chemical characteristics of peanuts with the air temperature during crop development due to the difficulty of measuring and manipulating soil temperature (Davis and Dean, 2016). Although air temperature during crop development can be easily measured, it may not be a good feature to relate to the changes in chemical composition of peanut seeds since they grow underground. Knowledge about the associations between soil temperature and chemical quality variables related to peanut shelf life and flavor during the seed filling period is an important tool for adopting management decisions to obtain the desired chemical characteristics of the seeds at harvest.
Florman INTA was the cultivar most commonly sown in Argentina but later it was replaced by the cultivar ASEM 485 INTA. The latter has a shorter growth cycle than the former, which allows growers to have a greater sowing date window, and produce higher yield (Haro et al., 2007, 2008). In order to contribute to the certified designation of origin according to Córdoba state law 10094 “Córdoba Peanuts”, those yield increases should be accompanied by a chemical quality which is similar to or higher than that of Florman INTA. To our knowledge, this issue has still not been investigated. Hence, the aim of this study was to determine the effect of soil temperature during the seed filling period on the oleic/linoleic ratio, and the tocopherol and sugar contents of the cultivars Florman INTA and ASEM 485 INTA.
2. MATERIALS AND METHODSTOP
2.1. Field experimental designTOP
Field experiments (Expn) were conducted during (i) 2002-2003 at the Institute of Phytopathology and Plant Physiology (IFFIVE) of the National Institute for Agricultural Technology (INTA) (31°24’S, 61°11’W), and (ii) 2005-2006 at Manfredi (31°49’S, 63°46’W) experimental station of INTA (Table 1). The runner-type cultivars Florman INTA (hereafter referred to as Florman) and ASEM 485 INTA (hereafter referred to as ASEM) were sown on October 17 and November 29, 2002 in Exp1, on November 14, 2005 in Exp2 and November 21, 2005 in Exp3. The crops were hand planted in rows at 0.7 m apart, using a stand density of 14 plants m-2. Soil type was silty loam Typic Haplustoll (USDA Soil Taxonomy) at IFFIVE and Manfredi. The plots were maintained free of weeds by frequent hand removal, and received periodical applications of 125 mL·ha-1 of tebuconazole (a-[2-(4-chlorophenyl) ethyl]-a-(1,1-dimethylethyl)-1H-1,2,4-triazole-1-ethanol) for preventing foliar diseases.
Table 1. Detail of experiments.
| Experiment |
Site |
Year |
Sowing date |
Cultivar |
Treatment |
Soil temperature R5-R8 (°C) |
Chemical determinations |
| Exp1 |
IFFIVE-INTA |
2002-2003 |
October 17 |
Florman |
IRR |
20.5 |
Oleic, Linoleic, |
| |
|
|
|
ASEM |
IRR |
21.8 |
Fructose, Glucose, Sucrose |
| |
|
|
November 29 |
Florman |
IRR |
18.6 |
α, β, γ, δ-Tocopherols |
| |
|
|
|
ASEM |
IRR |
19.0 |
|
| |
|
|
October 17 |
Florman |
WS |
24.4 |
Oleic, Linoleic, |
| |
|
|
|
ASEM |
WS |
25.7 |
Fructose, Glucose, Sucrose |
| |
|
|
November 29 |
Florman |
WS |
21.6 |
α, β, γ, δ-Tocopherols |
| |
|
|
|
ASEM |
WS |
21.9 |
|
| Exp2 |
Manfredi INTA |
2005-2006 |
November 14 |
Florman |
IRR |
21.4 |
|
| |
|
|
|
ASEM |
IRR |
21.7 |
Oleic, Linoleic, |
| |
|
|
|
Florman |
WS |
22.4 |
α, β, γ, δ-Tocopherols |
| |
|
|
|
ASEM |
WS |
25.0 |
|
| Exp3 |
Manfredi INTA |
2005-2006 |
November 21 |
Florman |
Heat |
32.6 |
|
| |
|
|
|
ASEM |
Heat |
32.6 |
|
| |
|
|
|
Florman |
Ambient |
21.6 |
Oleic, Linoleic, |
| |
|
|
|
ASEM |
Ambient |
21.6 |
α, β, γ, δ-Tocopherols |
| |
|
|
|
Florman |
Cool |
19.9 |
|
| |
|
|
|
ASEM |
Cool |
19.9 |
|
| IRR: irrigated; WS: water stress; R5: beginning seed filling; R8: harvest maturity; R5-R8: period between beginning seed filling and harvest maturity. |
The crops grew under the conditions of different water availability in Exp1 and Exp2, and without water restrictions in Exp3. Two water regimes were used in Exp1 and Exp2: (i) irrigated (IRR), where plots were watered to maintain the plants’ available water content at above 60% within the rooting depth; and (ii) water stress (WS), rainwater was withheld during periods of the growth cycle by means of four automatic mobile shelters (6 m wide x 12 m long each). WS treatments differed between Exp1 and Exp2. In Exp1 WS plots received full irrigation [i.e. equivalent to match maximum crop water use (WU)] until R1 (beginning bloom; Boote 1982) and no additional water from irrigation or rainfall from this stage onwards. In Exp2 full irrigation was applied until R1; partial irrigation (~44% of the amount used in IRR plots) was applied between R1 and R5 (beginning of seed filling period), followed by the addition of small amounts of water (~5 mm/day three times per week) between R5 and harvest maturity (R8) to minimize the negative effects of soil strength on pegging and early pod growth. In Exp1 and Exp2 the IRR plots were randomized within the sheltered plots. A split split-plot design was used in Exp1, with water availability in the main plots, sowing dates in the subplots and cultivars in the sub-subplots. In Exp2, water availability was in the main plots and cultivars in the subplots. Both experiments were performed with four replicates.
Exp3 (Table 1) consisted of three soil temperature (ST) treatments: (i) sub-surface ST reduced by the application of 1000 g·m-2 of maize stubble on the surface; (ii) ST increased with electric heating cables (electric resistances) buried at 7 cm below the soil surface; and (iii) control with bare soil. This experiment was done with three replicates and plots were four rows wide and 10 m long. The mean ST data reported were monitored with thermocouples at 7 cm below the soil surface during the seed filling period until harvest maturity (i.e. R5-R8) (Boote, 1982). The average daily mean of ST was based on hourly observations during the seed fill period R5-R8.
Peanut seeds of the three field experiments were hand-harvested at approximately 9% moisture. Only the kernels with commercial seed size retained by sieves or screens of round-hole mesh (7.5 mm diameter) were considered for the determination of fatty acids, tocopherols and sucrose, fructose and glucose contents. The relationship among variables was explored with a regression analysis and the confidence interval of the model parameters was determined. Significance of difference between the parameters of fitted linear models was evaluated using the F test (Statistix V7, 2000).
2.2. Chemical determinationsTOP
The commercial peanut seed size of each sample (50 g) was ground and made to pass through a 180 μm mesh sieve. The chemical variables evaluated were O/L ratio; α-, β-, γ- and δ-Tocopherols and the sum of them (TT) expressed in ppm in oil; and fructose + glucose + sucrose and the sum of them (FGS) g·kg-1 in defatted flour. Oil concentration (expressed as percentage of dry matter) was extracted using Twisselman equipment, as specified by the Official Methods of the American Oil Chemists’ Society (AOCS, 1998), with n-hexane as extraction solvent. Methyl esters of unsaturated fatty acids: Oleic (C 18:1) and Linoleic (C 18:2) acids, (expressed as percentage of dry matter) were prepared following AOCS Ce 1-62 (AOCS, 1998). Unsaturated fatty acids were analyzed with a Gas Chromatograph (Hewlett Packard 6890, Wilmington, DE, USA) equipped with a flame ionization detector with a capillary column HP-INNOWAX (Cross-linked Polyethylene Glycol), with a film 0.32 mm by 30 m, 0.5 μm in thickness. Standard fatty acid mixtures (FAME Mix Rapeseed, AOCS) purchased from Sigma-Aldrich (St. Louis, MO, USA) were used as calibration standards. The variable defined as oleic to linoleic ratio (O/L) was constructed because this relationship is considered a general indicator of oil quality. Tocopherol determination (expressed as mg kg-1 oil) was performed from previously extracted oil following AOCS method Ce 8-89 (AOCS, 1998), with a High Performance Liquid Chromatograph (Agilent 1100 high performance resolution, Palo Alto, CA, USA), equipped with a diode array detector (DAD). Separation was achieved with a Zorbax RX-Sil column (4.6 x 250 mm, 5 μm), maintained at 25.5 °C during the run. The mobile phase was n-Hexane 99.5% in 2-Propanol, both of high performance liquid chromatography (HPLC) purity. UV absorbance was monitored at 298 nm. Injection volume was 20 μl and flow rate was 1 ml·min-1. Calibration curves were obtained using commercial α (AT) and δ (DT) tocopherol standards purchased from Sigma-Aldrich (St. Louis, MO, USA). Response factors of β (BT) and γ (GT) tocopherols were calculated from AT and DT, respectively, and were corrected for their molar extinction coefficient and molecular mass. Total tocopherol (TT) was calculated by adding the individual tocopherol isomer (α, β, γ, δ) contents. Free sugars (fructose, glucose, and sucrose) were determined following the method published by Casini et al., (2003) and analyzed by HPLC in a High Performance Liquid Chromatograph plus autosampler (Agilent 1100 high performance resolution, Palo Alto, CA, USA). Sucrose, glucose, and fructose were separated in a 25 cm x 4.6 mm Supelco 5NH2 column at a controlled temperature of 25.5 °C. The eluent was acetonitrile/water (75:25) at an isocratic flow rate of 1.5 mL·min-1 and a run time of 15 min using a refractive index detector (RID). All standard soluble carbohydrates such as sucrose, fructose and glucose, were purchased from Sigma Chemical Co., St. Louis, MO.
3. RESULTSTOP
The response of O/L ratio to ST during the R5-R8 period fitted linear models in both cultivars (YFlorman = 0.17 + 0.048 X; r2 = 0.60; P < 0.001; YASEM = 0.10 + 0.054 X; r2 = 0.75; P < 0.001) (Figure 1). The slopes of the fitted models did not show statistically significant differences within the cultivars; however, ASEM showed a tendency to higher O/L ratio than Florman across the temperature range evaluated (Table 1). Taking into account the fitted models, the O/L ratio ranged between 1.07 and 1.63 (1.5-fold increase with respect to the minimum), and ST ranged between 19 °C and 25.7 °C (1.4-fold increase with respect to the minimum). The average O/L ratio within the ST range explored by the models was 1.31 for ASEM and 1.20 for Florman. Increases in the O/L ratio were associated with higher soil temperature and this scenario was observed in water stress plots. The difference in the O/L ratio between cultivars tended to increase with increasing mean ST (e.g. at 19 °C: 1.08 vs 1.13, and at 24.4 °C: 1.34 vs 1.43 for Florman and ASEM, respectively). On the other hand, the low values for the O/L ratio obtained in 32.6 °C of soil temperature stood out (heat treatment of Exp3), where the average values for the O/L ratio were 1.04 and 1.05 for Florman and ASEM, respectively.
|
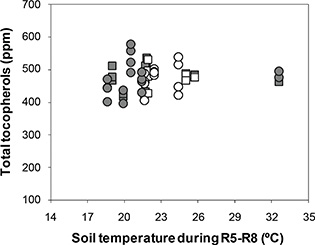 Figure 1. Response of O/L ratio to soil temperature during the R5-R8 period for Florman and ASEM cultivars sown in Exp1, Exp2 and Exp3. Circle symbols and dashed line represent Florman; Square symbols and solid line represent ASEM. White and grey symbols are for pods growing with and without water restrictions, respectively. Fitted models were of the type: Y = a + (b × X). Each point represents an individual replicate. Computed models were: Figure 1. Response of O/L ratio to soil temperature during the R5-R8 period for Florman and ASEM cultivars sown in Exp1, Exp2 and Exp3. Circle symbols and dashed line represent Florman; Square symbols and solid line represent ASEM. White and grey symbols are for pods growing with and without water restrictions, respectively. Fitted models were of the type: Y = a + (b × X). Each point represents an individual replicate. Computed models were:
Y = 0.17 + 0.048 X; r2 = 0.60; P < 0.001 (Florman).
Y = 0.10 + 0.054 X; r2= 0.75; P < 0.001 (ASEM).
|
|
The response of α-tocopherols to ST fitted a linear model for both cultivars (Y = 110.5 + 4.4 X; r2 = 0.51; P < 0.001) (Figure 2), with increases in ST which induced increases in α-tocopherols at a rate of 4 ppm per °C. The range of α-tocopherols was between 170.1 and 282.4 (1.7-fold increase with respect to the minimum), and ST ranged between 18.6 °C and 32.6 °C (1.8-fold increase with respect to the minimum). The average of α-tocopherols was 211.3 ppm and 208.5 ppm for Florman and ASEM, respectively. The increases in α-tocopherols with increasing ST were not reflected by the TT response (Figure 3), which showed a random distribution of TT in both cultivars with average values of 475 ppm and 480 ppm for Florman and ASEM, respectively. These increases in α-tocopherols were partially offset by decreases in γ-tocopherols (P = 0.048; data not shown) and δ-tocopherols (P < 0.001; data not shown). The most abundant isomer in peanuts was γ-tocopherol, with average values of 246 ppm and 250 ppm for Florman and ASEM, respectively. The sum of the isomers α and γ accounted for 95 – 98% of TT. A negative relationship between δ- and α-tocopherols (Y = 39.5 - 0.12 X; r2 = 0.70; P < 0.001) was established (Figure 4). These tocopherols were the isomers which were the most sensitive to variations in ST. Finally, β-tocopherols represented less than 1% of TT and showed a random behavior. Average β-tocopherol values were 3.3 ppm and 3.7 ppm for cultivars Florman and ASEM, respectively.
|
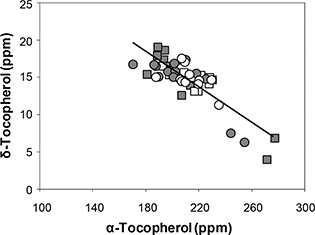 Figure 2. Response of α-tocopherol to soil temperature during R5-R8 period for Florman and ASEM cultivars sown on Exp1, Exp2 and Exp3. Symbols as in Fig.1. Solid line represents fitted model for both cultivars of the type: Y = a + (b × X). Each point represents an individual replicate. Computed model was: Figure 2. Response of α-tocopherol to soil temperature during R5-R8 period for Florman and ASEM cultivars sown on Exp1, Exp2 and Exp3. Symbols as in Fig.1. Solid line represents fitted model for both cultivars of the type: Y = a + (b × X). Each point represents an individual replicate. Computed model was:
Y = 110.5 + 4.4 X; r2 = 0.51; P < 0.001.
|
|
|
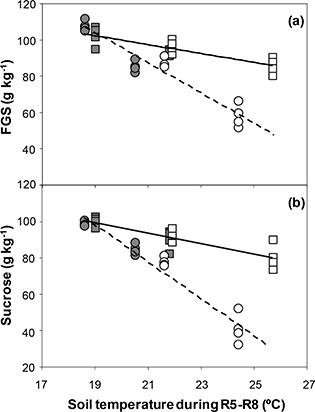 Figure 3. Response of Total tocopherols to soil temperature during the R5-R8 period for Florman and ASEM cultivars sown in Exp1, Exp2
and Exp3. Symbols as in Fig.1. Figure 3. Response of Total tocopherols to soil temperature during the R5-R8 period for Florman and ASEM cultivars sown in Exp1, Exp2
and Exp3. Symbols as in Fig.1.
|
|
|
Figure 4. Relationship between δ-tocopherol and α-tocopherol for Florman and ASEM cultivars sown in Exp1, Exp2 and Exp3. Symbols as Fig.1. The solid line represents the fitted model for both cultivars, of the type: Y = a + (b × X). Each point represents an individual replicate. Computed model was:
Y = 39.5 - 0.12 X; r2 = 0.70; P < 0.001.
|
|
FGS concentration was negatively related to the ST in both cultivars (YFlorman = 258.9 - 8.2 X; r2 = 0.91; P < 0.001; YASEM = 148.6 - 2.5 X; r2 = 0.71; P < 0.001) (Figure 5a), indicating that FGS decreased with increasing ST. Water stress induced increases in ST and lower FGS concentration. Statistically significant differences (P < 0.001) among the slopes of the fitted models were observed, indicating that the decrease rate was three times higher in the cultivar Florman. These response patterns were governed by sucrose concentration, which accounted for 93% of the sugars evaluated. The average FGS across the ST range evaluated was 85 g·kg-1 and 95 g·kg-1 for Florman and ASEM, respectively, and γ accounted for 95 – 98% of TT. A negative relationship between sucrose concentration and ST was established for both genotypes (YFlorman = 288.3 - 10.0 X; r2 = 0.94; P < 0.001; YASEM = 155.6 - 2.9 X; r2 = 0.72; P < 0.001) (Figure 5b). The slopes of the fitted models showed statistically significant differences (P < 0.001) between genotypes, which expressed a decrease rate that was three times higher for Florman. The decrease in sucrose concentration was obtained under water stress, which induced higher ST. Average sucrose concentrations were 76 g·kg-1 and 91 g·kg-1 for Florman and ASEM, respectively. Glucose and fructose concentrations represented 7% of FGS and did not respond to ST (data not shown).
|
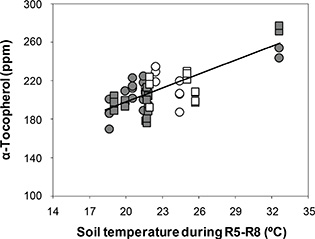 Figure 5. (a) Response of FGS and (b) Sucrose to soil temperature during the R5-R8 period for Florman and ASEM cultivars sown in Exp1
and Exp2. Symbols and lines as in Fig.1. Fitted models were of the type: Y = a + (b × X). Each point represents an individual replicate. Computed models were: Figure 5. (a) Response of FGS and (b) Sucrose to soil temperature during the R5-R8 period for Florman and ASEM cultivars sown in Exp1
and Exp2. Symbols and lines as in Fig.1. Fitted models were of the type: Y = a + (b × X). Each point represents an individual replicate. Computed models were:
(a) YFlorman = 258.9 - 8.2 X; r2 = 0.91; P < 0.001;
YASEM = 148.6 - 2.5 X; r2 = 0.71; P < 0.001.
(b) YFlorman = 288.3 – 10.0 X; r2 = 0.94; P < 0.001;
YASEM = 155.6 - 2.9 X; r2 = 0.72; P < 0.001.
|
|
4. DISCUSSIONTOP
ST was a robust indicator of the O/L ratio. This variable subsumes several assumptions that should be considered when using air temperature to infer ST behavior. For example, in the study of Casini et al., (2003), which was carried out in a similar environment using the cultivar Florman, it was necessary to include the variable sum of precipitations to estimate temperature decrease caused by wetting the surface soil layer. In our study, the manipulation of ST allowed us to explore a wider temperature range (7.1 °C) than the 2.1 °C range used in Casini et al., (2003). Furthermore, ST captures the effects of other factors (e.g. water status of soil surface, presence of surface or subsurface stubble, soil texture) that cannot be explained by air temperature. The O/L ratio determined by ST variations suggested the obtaining of seeds with differential qualities according to environments (e.g. region and crop husbandry). In the main peanut region of Argentina, the province of Córdoba, sandy-loam soils predominate. These kinds of soils are often known as warm soils and would be suitable for obtaining seeds with high O/L ratios, as the higher temperatures during seed filling period decrease the concentration of linoleic acid, increasing the oleic/linoleic ratio (Golombek et al., 1995). In contrast, lower O/L ratios would be found in seeds from the central region of Córdoba where silt-loam soils, known as temperate soils, predominate. The effects of sandy-loam soils on the O/L ratio could be enhanced by low water storage of these soils, which exacerbates the temperature increases in the pod-growth zone during periods of low rainfall. These responses would enhance peanut shelf life and decrease rancidity (Braddock et al., 1995) in seeds from the southern region, but also lower seed weight and peanut yield (Haro et al., 2008).
The higher average O/L ratio found for the cultivar ASEM (1.31) in the present study suggested that genetic improvement in peanuts from Argentina, whose main aim was to increase yields and decrease the length of the growth cycle, also influenced improvement in the grain quality variable. However, this O/L ratio value is still lower than that of genotypes cultivated in warmer regions. Indeed, an average O/L ratio of 2.6 was determined when 10 normal cultivars grew in Florida (USA) (Andersen et al., 1998). In high-oleic cultivars, the O/L ratio is markedly higher than in non high-oleic cultivars, but those genotypes were not evaluated in this study. Special attention was paid to the values of O/L ratio obtained from seeds grown in heated soil plots (heat treatment of Exp3), achieving a constant soil temperature of 32.6 °C. We suspect that those outlier values of O/L ratio, not agreeing with the paradigm “higher temperature produces greater O/L ratio”, could have resulted as a consequence of maintaining a continuously high temperature (32.6 °C) and minimum daily fluctuation (± 0.5 °C). Nevertheless, the absence of evidence in the literature prevents us from confirming our suspicions. In addition, the thermal scenario of 32.6 ± 0.5 °C contrasts with those usual soil temperatures recorded in peanut fields, where fluctuating dynamics between the maximum and minimum ST take place daily. The absence of thermal fluctuations in heat treatment plots could have affected the normal functioning of the enzyme D12 desaturase, which catalyzes the reaction of oleic acid to linoleic acid and, consequently, the O/L ratio (Andersen et al., 1998).
The wide ST range detected highlights the importance of environmental conditions prevailing in the peanut growing area, which was reflected in the increase in α-tocopherols with the increase in ST. Hashim et al., (1993a) observed a significant α-tocopherol increase in seeds under water stress during the seed filling period compared to seeds grown without limited water availability conditions. Our results agree with the evidence obtained by Hashim et al., (1993a), since imposed drought produced desiccation of the soil surface layer and it induced an increase in temperature in the pod growth zone (Giambastiani and Casanoves, 2000). In this study, water stress and heated soil induced increases in α-tocopherol values with respect to the control (i.e. irrigation and environment of cool temperature, respectively), resulting in an increase in vitamin E in the seeds. This confers commercial advantages due to the discrimination of seeds according to the environment of origin, reinforcing the concept of denomination of origin. For example, seeds with more vitamin E (i.e. α-tocopherols) and O/L from sandy soils are desirable chemical characteristics for the shelf life of the seeds and for people’s health. Moreover, γ-tocopherols decreased with increasing air temperature and, although a high variability was observed, it was offset by the increase in α-tocopherols. The δ- and β-tocopherols determined in Florman and ASEM represented the smallest proportions of TT, which is in agreement with previous reports (Hashim et al., 1993a; Giambastiani and Casanoves, 2000; Jonnala et al., 2006; Shin et al., 2009). However, the significant negative association (P < 0.05) between δ-tocopherols and α-tocopherols, which is consistent with results reported for soybeans (Seguin et al., 2009; Carrera et al., 2011), should be highlighted. This negative association would reflect the competition for 2-methyl-6-phytyl-1,4-benzoquinone, the common precursor for the synthesis of α-tocopherols and δ-tocopherols (Sattler et al., 2003). TT was not associated with changes in ST for either Florman or ASEM, due to the compensation effects among isomers. The average values obtained (478 ppm) were within the range established by Hui (1996) (268–510 ppm) and are close to those determined by Casini et al., (2001, 2003), who found values of 525 ppm and 528 ppm in each study, respectively, in a similar soil type to that of our study.
To our knowledge, the present study is the first one to address the response of peanut tocopherols to ST in the pod growth zone. Indeed, previous studies found associations of TT content with water stress (Hashim et al., 1993a; Casini et al., 2003). Jonnala et al., (2006) and Shin et al., (2009) also quantified TT contents but did not relate this chemical variable to environmental ones. As in Casini et al., (2001, 2003), the present results demonstrate that the TT of peanuts produced in Córdoba (Argentina) is lower than the values (538–656 ppm) reported for the principal growing regions in the USA (north of Florida, southeast of Georgia, Virginia and Texas) (Hashim et al., 1993b; Sanders et al., 1994; Grimm et al., 1996). Besides, those studies concluded that lower TT contents were associated with regions of more temperate climates, as in the peanut region in Córdoba. As discussed above, ST was not associated with TT; however, we cannot confirm that our results are in disagreement with those reported for the USA because those studies evaluated the effects of mean air temperature measured over the peanut crop.
The average FGS concentrations of the cultivars Florman (85 g·kg-1) and ASEM (95 g·kg-1) determined in this study was higher from the value reported for the main producing area in the USA, with a range between 39–54 g·kg-1 determined in the north of Florida and southeast Georgia (McMeans et al., 1990; Grimm et al., 1996; Pattee et al., 2000). This type of response of increases of FGS to decreases in ST, (Fouconnier et al., 2002), explains the differences in FGS and sucrose (which represented 93% of the FGS in the present study) between peanuts from the main producing region in Argentina and the USA. In Argentina, the seed is exposed to cooler temperatures (19.5 °C) during the seed filling period than in the main peanut producer region of USA (27.2 °C) (Casini et al., 2003). Our determinations based on ST in the pod growth zone showed significant reductions in FGS concentrations with increasing ST for both genotypes. However, under a wide ST range, the variations were slight for ASEM (2.5 g kg-1 °C-1) and pronounced for Florman (8.2 g·kg-1·°C-1), although both genotypes had similar concentrations (105 g·kg-1) at about 18.5 °C of ST (Figure 5a).
Sucrose concentration followed similar patterns to those of FGS, with decrease rates of 2.9 g·kg-1·°C-1 and 10 g·kg-1·°C-1 in ASEM and Florman, respectively, during increasing ST. These differential behaviors between genotypes showed that ASEM maintained high FGS and sucrose concentrations, regardless of the environments to which the crop was exposed during the seed filling period. Thus, ASEM can be expected to preserve a sweeter flavor than Florman, even under great ST increases (e.g. drought periods that produce desiccation of the soil surface layer). This response highlights the chemical quality of Argentina’s peanut seeds with respect to seeds from other latitudes and becomes an advantage in the commercialization. Maintaining a sweet taste despite changes in soil temperature, along with its greater potential yield than that of Florman (because of a higher partitioning ratio) (Haro et al., 2007), is an adaptive advantage obtained from the genetic improvement of peanuts in Argentina. In a field experiment in which the pod growth zone was cooled to 21.7 °C, McMeans et al., (1990) found a decrease rate in the cultivar Florunner close to the one found in the present study for the variety ASEM under increases in ST (2.2 g·kg-1·°C-1), but at an initial concentration of only 52 g·kg-1. Because these authors considered that the entire crop growing season and the seed filling period occurs in autumn, the ST is expected to be lower during this period and comparable to the mean minimum ST (18.5 °C) found in our study. However, ASEM doubled the FGS concentration with respect to the value reported by McMeans et al., (1990). Therefore, besides ASEM’s desired attributes, which were evaluated during the improvement process in Argentina (increased yield and shortening of the growth cycle in temperate environments); the cultivar would have an additional genotype advantage in terms of the FGS content pattern. The detrimental effects of ST increase on FGS concentration found in the work of McMeans et al., (1990) were confirmed by Burke et al., (2009) and in the present work. Moreover, Burke et al., (2009) evaluated two genotypes growing under controlled hydroponic conditions and showed that sugar content has a greater association with ST than with air temperature.
5. CONCLUSIONSTOP
ST was useful in evaluating the chemical characteristics of peanuts for human consumption. Such features are involved both in peanut shelf life and flavor. Thus, ST was a robust tool to demonstrate that a contemporary genotype (ASEM), which was selected based on its greater partitioning of seeds, improved the aspects of chemical quality. The O/L ratio increased slightly in ASEM at the temperature range evaluated, denoting a greater shelf-life period for peanuts than its ancestor, Florman. TT concentration was similar in both genotypes, with a consistent increase in α-tocopherols (principal source of Vitamin E) at higher ST. At high ST, ASEM maintained higher FGS concentrations than Florman, and the decrease slope was significantly lower at increasing ST. This is an essential adaptive advantage because it confers stability against interannual variations in ST; which is a key factor for preserving the certified designation of origin obtained for peanuts grown in Argentina.
ACKNOWLEDGEMENTSTOP
Authors gratefully acknowledge Dr. C. Casini for his invaluable support throughout the development of this research. The INTA funded this work. Technical assistance in field experiments provided by D. Altamirano is duly acknowledged.
REFERENCESTOP
| ○ |
Ahmed EM, Young CY. 1982. Composition, nutrition and flavor of peanuts, in Pattee HE, Young CT (Eds.) Peanut Science and Technology. Amer. Peanut Res. Educ. Soc. Inc., Yoakum, TX, USA, pp. 655–688. |
| ○ |
Andersen PC, Gorbet DW. 2002. Influence of year and planting date on fatty acid chemistry of high oleic acid and normal peanut genotypes. J. Agric. Food Chem. 50, 1298–1305. https://doi.org/10.1021/jf0113171 |
| ○ |
Andersen PC, Hill K, Gorbet DW, Brodbeck BV. 1998. Fatty acid and amino acid profiles of selected peanut cultivars and breeding lines. J. Food Compos. Anal. 11, 100–111. https://doi.org/10.1006/jfca.1998.0565 |
| ○ |
AOCS. 1998. Official Methods and Recommended Practices of the American Oil Chemists, 5th ed.; American Oil Chemists Society: Champaign, IL. |
| ○ |
Bascha SM. 1992. Soluble sugar composition of peanut seed. J. Agric. Food Chem. 40, 780–783. https://doi.org/10.1021/jf00017a015 |
| ○ |
Bett KL, Varcellotti JR, Lovergren NV, Sanders TN, Hinsch RT, Rasmussen GK. 1994. A comparison of the flavor and compositional quality of peanuts from several origins. Food Chem. 51, 21–27. https://doi.org/10.1016/0308-8146(94)90042-6 |
| ○ |
Boote KJ. 1982. Growth stages of peanut (Arachis hypogaea L.). Peanut Sci. 9, 35–39. https://doi.org/10.3146/i0095-3679-9-1-11 |
| ○ |
Braddock JC, Sims CA, O’Keefe SK. 1995. Flavor and oxidative stability of roasted high oleic acid peanuts. J. Food Sci. 60, 489–493. https://doi.org/10.1111/j.1365-2621.1995.tb09809.x |
| ○ |
Burke JJ, Chen J, Rowland DL, Sanders TH, Dean LL. 2009. Temperature effects on carbohydrates of hydroponically-grown peanuts. Peanut Sci. 36, 150–156. https://doi.org/10.3146/PS08-022.1 |
| ○ |
Cámara Argentina del Maní. 2019. http://www.camaradelmani.org.ar/english/update-on-supply-and-demand-estimation-cam/ Last accesed 30/07/2019. |
| ○ |
Carrera C, Martínez MJ, Dardanelli J, Balzarini M. 2011. Environmental variation and correlation of seed components in nontransgenic soybeans: protein, oil, unsaturated fatty acids, tocopherols, and isoflavones. Crop Sci. 51, 1–10. https://doi.org/10.2135/cropsci2010.06.0314 |
| ○ |
Casini C, Dardanelli JL, Martínez MJ, Balzarini M, Borgogno CS, Nassetta M. 2003. Oil quality and sugar content of peanuts (Arachis hypogaea L.) grown in Argentina: Their relationship with climatic variables and seed yield. J. Agric. Food Chem. 51, 6309–6313. https://doi.org/10.1021/jf030183j |
| ○ |
Casini C, Martinez MJ, Chulze S, Nassetta M, Ruiz S, Torres A, Gastaldi L, Avalis D, Silva C, Guzmán C, Lamarque A, Reartes N, Borgogno C, Balzarini M, Rolando R, Ferrayoli C. 2001. Variabilidad de la calidad del maní argentino, en: Actas XVI Jornada Nacional del Maní, Gral. Cabrera, Córdoba, Argentina, pp. 61–63. |
| ○ |
Davis JP, Dean LL. 2016. Peanut Composition, Flavor and Nutrition, in: - Genetics, Processing, and Utilization. AOCS Press, Chapter 11, pp 289–345. https://doi.org/10.1016/B978-1-63067-038-2.00011-3 |
| ○ |
Dwivedi SL, Nigam SN, Nageswara Rao RC. 2000. Photoperiod effects on seed quality traits in peanut. Crop Sci. 40, 1223–1227. https://doi.org/10.2135/cropsci2000.4051223x |
| ○ |
Firestone D. 1999. Physical and chemical characteristics of oils, fats and waxes, 2nd ed., AOCS Press, Champaign, IL. |
| ○ |
Fouconnier ML, Rojas Bletrán J, Delcarte J, Dejaeghere F, Marlier M, Du Jardin P. 2002. Lipoxigenase pathway and membrane permeability and composition during storage of potato tubers (Solanum tuberosum L. Cv. Bintje and Désirée) in different conditions. Plant Biol. 48, 750–756. https://doi.org/10.1055/s-2002-20439 |
| ○ |
Frankel EN. 2005. Lipid Oxidation, second Ed., The Only Press, PJ Barnes & Associeates PO Bos 200, Bridgwater TA7 0YZ, England, pp. 1–450. |
| ○ |
Gadgil JD, Mitra R. 1983. Chemical composition of seeds in induced groundnut mutants and their derivatives. Indian J. Agric. Sci. 53, 295–298. |
| ○ |
Giambastiani C, Casanoves F. 2000. Composición lipídica de semillas de maní (Arachis hypogaea L.) obtenidas bajo diferentes condiciones de disponibilidad de agua. Grasas Aceites 51 (6), 412–416. |
| ○ |
Golombek SD, Sridhar R, Singh U. 1995. Effect of soil temperature on the seed composition of three spanish cultivars of groundnut (Arachis hypogaea L.). J. Agric. Food Chem. 43, 2067–2070. https://doi.org/10.1021/jf00056a021 |
| ○ |
Grimm DT, Sanders TH, Patte HE, Williams DE, Sanchez-Domínguez S. 1996. Chemical composition of Arachis hypogaea L. Subsp. hypogaea Var. hirsuta peanuts. Peanut Sci. 23, 111–116. https://doi.org/10.3146/i0095-3679-23-2-9 |
| ○ |
Haro RJ, Casini, C. 2008. Efecto de labranzas y cultivos antecesores sobre la producción y calidad del grano de maní. IDIA XXI-Cultivos Industriales. 10, 1015–110. |
| ○ |
Haro RJ, Dardanelli JL, Collino DJ, Otegui ME. 2008. Seed yield determination of peanut crops under water deficit: soil strength effects on pod set, the source-sink ratio and radiation use efficiency. Field Crops Res. 109, 24–33. https://doi.org/10.1016/j.fcr.2008.06.006 |
| ○ |
Haro RJ, Otegui ME, Collino DJ, Dardanelli JL. 2007. Environmental effects on seed yield determination of irrigated peanut crops: links with radiation use efficiency and crop growth rate. Field Crops Res. 103, 217–228. https://doi.org/10.1016/j.fcr.2007.06.004 |
| ○ |
Hashim IB, Koehler PE, Eitenmiller RR, Kvien CK. 1993a. Fatty acid composition and tocopherol content of drought stressed Florunner peanuts. Peanut Sci. 20, 21–24. https://doi.org/10.3146/i0095-3679-20-1-6 |
| ○ |
Hashim IB, Koehler PE, Eitenmiller RR. 1993b. Tocopherol in Runner and Virginia peanut cultivars at various maturity stages. J. Am. Oil Chem. Soc. 70, 633–635. https://doi.org/10.1007/BF02545333 |
| ○ |
Higgs J. 2002. The beneficial role of peanuts in the diet-an update and rethink! Peanuts and their role in CHD, NUFS. 32, 214–218. https://doi.org/10.1108/00346650210454190 |
| ○ |
Holownia KI, Erickson MC, Chinnan MS, Eitenmiller RR. 2001. Tocopherol losses in peanuts oil during pressure frying of marinated chicken strip coated with edible films. Food Res. Int. 34, 77–80. https://doi.org/10.1016/S0963-9969(00)00134-4 |
| ○ |
Hui Y. 1996. Edible Oil and Fat Products: Oils and Oilseeds, Bailey´s Industrial Oil and Fat Products, John Wiley and Sons Inc., Fifth ed., Volume 2, pp. 386. |
| ○ |
Jonnala RS, Dunford NT, Dasshiell KE. 2006. Tocopherol, phytosterol and phospholipid compositions of new high oleic peanut cultivars. J. Food Compos. Anal. 19, 601–605. https://doi.org/10.1016/j.jfca.2006.01.005 |
| ○ |
Martinez MJ, Casini C, Silva MC, Aguilar R, Spahn JG, Ingá GM, Badini RG, Balzarini M. 2010. La Calidad del grano de maní producido en Córdoba destinado a la exportación, en: J.A. Mariotti (Ed.), Primera Edición, Ediciones INTA, Informe del Programa Nacional de Cultivos Industriales del INTA. Cultivos Industriales Avances 2006/2009, Buenos Aires, Argentina, pp. 28–32. |
| ○ |
McMeans JL, Sanders TH, Wood BW, Blankenship PD. 1990. Soil temperature effects on free carbohydrate concentrations in Peanut (Arachis hypogaea L.) seed. Peanut Sci. 17, 31–35. https://doi.org/10.3146/i0095-3679-17-1-11 |
| ○ |
Messina M. 1999. Legumes and soybeans: overview of their nutritional profiles and health effects. Am. J. Clin. Nutr. 70, 439S-450S. https://doi.org/10.1093/ajcn/70.3.439s |
| ○ |
Ministerio de Agroindustria. 2019. https://www.magyp.gob.ar/sitio/areas/ss_mercados_agropecuarios/areas/regionales/_archivos/000030_Informes/000050_Maní/000009_Situación%20Mercado%20del%20Maní%20Junio%20-%202017.pdf |
| ○ |
Misra JB. 2004. A mathematical approach to comprehensive evaluation of quality in groundnut. J. Food Compos. Anal. 17, 69–79. https://doi.org/10.1016/S0889-1575(03)00102-9 |
| ○ |
Nawar WW. 2000. Lípidos, en: O.R. Fenema (Ed.) Química de los alimentos, ACRIBIA, S.A. 2da Edición, Zaragoza, España, pp. 269–382. |
| ○ |
Panigatti JL. 2010. Argentina 200 años, 200 suelos. Ed. INTA Buenos Aires. Ilustraciones y cuadros, pp 345. |
| ○ |
Pattee HE, Isleib TG, Giesbrech FG, McFeeters RF. 2000. Investigations into genotypic variation of peanut carbohydrates. J. Agric. Food Chem. 48, 750–756. https://doi.org/10.1021/jf9910739 |
| ○ |
Sánchez R, Baldessari J, Royo O. 2010. Peanut Genetic Resources Catalogue, Primera Edición, Ediciones INTA. Buenos Aires, Argentina. |
| ○ |
Sanders TH, Branch WD, Simpson CE, Coffelt TA. 1994. Effect of cultivar and production location on tocopherol concentration, O/L ratio, and oil stability of six peanut cultivars, Proceedings of American Peanut Research and Education Society 26, 46. |
| ○ |
Sanders TH, Lansden JA, Greens RL, Drexler JS, Williams EJ. 1982. Oil characteristics of peanut fruit separated by nondestructive maturity classification method. Peanut Sci. 9, 20–23. https://doi.org/10.3146/i0095-3679-9-1-6 |
| ○ |
Sattler SE, Cahoom EB, Coughlan SJ, Delapenna D. 2003. Characterization of tocopherol cyclases from higher plants and cyanobacteria, Evolutionary implications for tocopherol synthesis and function. Plant Physiol. 132, 2184–2195. https://doi.org/10.1104/pp.103.024257 |
| ○ |
Savage GP, Keenan JI. 1994. The composition and nutritive value of groundnut kernerls, in Smartt J. (Ed.) The Groundnut Crop: A Scientific Basis for Improvement. Chapman and Hall, London, UK, pp. 173–213. |
| ○ |
Seguin P, Turcotte P, Tremblay G, Pageau D, Liu W. 2009. Tocopherols concentration and stability in early maturing soybean genotypes. Agron. J. 101, 1153–1159. https://doi.org/10.2134/agronj2009.0140 |
| ○ |
Shin EC, Huang YZ, Pegg RB, Phillips RD, Eitenmiller RR. 2009. Commercial runner peanut cultivars in the United States: Tocopherol composition. J. Agric. Food Chem. 57, 10289–10295. https://doi.org/10.1021/jf9029546 |
| ○ |
Shintani DK, Cheng Z, Della Penna D. 2002. The role of 2-methyl-6-phytybebziquinone methyltrenferase in determining tocopherol composition in Synechocystis sp., FEBS Lett. 511, 1–5. |
| ○ |
Silva MP, Martinez MJ, Casini C, Grosso NR. 2010. Tocopherol content, peroxide value and sensory attributes in roasted peanuts during storage. Int. J. Food Sci. Technol. 45, 1499–1504. https://doi.org/10.1111/j.1365-2621.2010.02293.x |
| ○ |
Statistix V7. 2000. Analytical Software, Tallahassee, Florida. |
| ○ |
Talcott ST, Passeretti S, Duncan CE, Gorbet DW. 2005. Polyphenolic content and sensory properties of normal and high oleic acid peanuts. Food Chem. 90, 379–388. https://doi.org/10.1016/j.foodchem.2004.04.011 |
| ○ |
Tucker JM, Townsend DM. 2005. α-Tocopherol: roles in prevention and therapy of human disease. Biomed. Pharmacother. 59, 280–387. https://doi.org/10.1016/j.biopha.2005.06.005 |
| ○ |
Warner KJH, Dimick PS, Ziegler GR, Mumma RO, Hollender R. 1996. Flavor-fade and off-flavors in ground roasted peanuts as related to selected pyrazines and aldehydes. J. Food Sci. 61, 469–472. https://doi.org/10.1111/j.1365-2621.1996.tb14219.x |
| ○ |
Yol E, Uzun, B. 2018. Influences of genotypes and location interactions on oil, fatty acids and agronomical properties of groundnuts. Grasas Aceites 69 (4) e276. https://doi.org/10.3989/gya.0109181 |