Structure and thermal properties of beeswax-based oleogels with different types of vegetable oil
M. Panga,b,*, Z. Shia,b, Z. Leia,b, Y. Gea,b, S. Jianga,b and L. Caoa,b,*
aSchool of Food and Bioengineering, Hefei University of Technology, Hefei, 230009, P. R. China.
bKey Laboratory for Agricultural Products Processing of Anhui Province, Hefei, 230009, P. R. China.
*Corresponding author: pangmin@hfut.edu.cn; lilycao504@hfut.edu.cn
| |
SUMMARY
Beeswax-based oleogels with different types of vegetable oil, including camellia oil (CO), soybean oil (SO), sunflower oil (SFO), or flaxseed oil (FO), were prepared and their structure and thermal properties were evaluated. The critical concentration of oleogel obtained from each of CO, SO, and SFO at 25 °C was 3% (w/w), and that from FO was 4%. Thermal measurements revealed similar thermodynamic curves for oleogels in different lipid phases. X-Ray diffraction showed orthorhombic perpendicular subcell packing and characteristic peaks of the β’ form. Furthermore, a morphology analysis of the crystals showed that they were needle shaped. Fourier transform-infrared spectra revealed that beeswax-based oleogels were formed via non-covalent bonds and may be stabilized with physical entanglements. The oleogels showed oil type-dependent oxidative abilities, but they were all stable and showed no obvious changes in peroxide value during 90 days of storage at 5 °C.
|
| |
RESUMEN
Estructura y propiedades térmicas de oleogeles a base de cera de abejas con diferentes tipos de aceites vegetales. Se prepararon oleogeles a base de cera de abejas con diferentes tipos de aceite vegetal, incluido el aceite de camelia (CO), de soja (SO), girasol (SFO) y linaza (FO), y se evaluaron la estructura y las propiedades térmicas. La concentración crítica de oleogel obtenida de cada uno de los aceites de CO, SO y SFO a 25 °C fue del 3% (p / p), y la del FO fue del 4%. Las medidas térmicas dieron curvas termodinámicas similares para los oleogeles en diferentes fases lipídicas. La difracción de rayos X mostró un empaquetamiento subcelular perpendicular ortorrómbico y picos característicos de la forma β’. Además, el análisis de la morfología de los cristales mostró que tenían forma de aguja. Los espectros infrarrojos de transformada de Fourier revelaron que los oleogeles basados en cera de abejas se formaron a través de enlaces no covalentes y pueden estabilizarse con enlaces físicos. Los oleogeles mostraron capacidades oxidativas dependientes del tipo de aceite, pero todos eran estables y no tuvieron cambios obvios en el valor del peróxido durante 90 días de almacenamiento a 5 °C. |
1. INTRODUCTIONTOP
Solid fat in food products, generally made up of saturated triacylglycerol crystal networks in the lipid fraction, provides favorable characteristics (such as plasticity and emulsification) (Singh et al., 2017). However, accumulating evidence shows that the excessive consumption of saturated and trans-fats increases the incidence of cardiovascular disease and has a negative impact on health (Lichtenstein et al., 2003; Willett, 2006). Alternatives need to be developed in the food industry to meet people’s requirements for palatable and flavorful food. Oleogel, which hardens oil by adding an oleogelator without changing the composition of its fatty acids, is considered a great possibility as a partial substitute for hydrogenated vegetable oil, a commonly used trans-fat (Hwang et al., 2013). An oleogelator (typically an edible wax) is used to retain liquid oil without changing the chemical composition through non-covalent interactions (hydrogen bonding, π-π stacking, electrostatic, and van der Waals interactions); whereby edible oils are entrapped within a thermo-reversible and three-dimensional gel network to form the gel (Hughes et al., 2009; Wang et al., 2016). Previous studies have developed manifold oleogelators with various oils, such as saturated fatty acids, saturated fatty alcohols and their mixtures: phytosterols and oryzanol; hydroxystearic acid; lecithin and sorbitan tri-stearate; waxes and wax esters; monoglyceride; ethylcellulose; sorbitan monostearate; and structured emulsions (Singh et al., 2017; Pernetti et al., 2007). Recently, it has been reported that lecithin had a synergistic effect (hydrogen bond) in gel formation so the oleogel could be formed with a lower concentration of fruit wax. This study also demonstrated that the oil binding ability and thixotropic recovery were enhanced with the addition of lecithin (Okuro et al., 2018).
As an oleogelator, wax shows a strong lipid gelling ability and this may be attributed to its complex makeup of hydrocarbons, monoesters, diesters, triesters, and free acids (Wang et al., 2016; Tulloch, 1971). Various edible waxes including rice bran wax, sunflower wax, beeswax, carnauba wax, and candelilla wax have been studied as oleogelator agents and compared for their oleogel properties in different oils depending on the oleogel type, crystallization behavior, thermal properties, and stability (Hwang et al., 2013; Dassanayake et al., 2009). In recent years, several oleogels have been studied to gel edible oils based on beeswax. The gelation properties of beeswax have been evaluated and have demonstrated good oil binding ability, texture parameters, thermal behavior, and stability (Martins et al., 2016; Fayaz et al., 2017; Toro-Vazquez et al., 2007). These findings demonstrate that beeswax has the capability to crystallize, forming a three-dimensional network and entrapping liquid oil. Besides these findings, studies aimed at evaluating the effect of the oil type used in oleogel formation with beeswax are relatively limited.
The aim of this study was to explore how different oil types could affect the gelling ability of beeswax in the formation of oleogel. Camellia oil (CO), soybean oil (SO), sunflower oil (SFO), and flaxseed oil (FO) were used and judged by a series of evaluation criteria, including critical concentration, thermal properties, microstructure, and oxidative stability. These data provide valuable insights into the preparation of edible oleogel.
2. MATERIALS AND METHODSTOP
2.1. Materials and oleogel preparationTOP
Food grade beeswax (BW) and vegetable oils were purchased from Changge City, Yi Heng Jian apiculture, Ltd. (Henan, China) and local markets (Hefei, China), respectively. Oleogel samples were formed with BW and a constant amount of CO, SO, SFO, and FO (de-waxing) in a water bath at 85 °C, and completely gelated in beakers at room temperature overnight after mixing thoroughly. Each prepared sample was placed in a 60 ml glass bottle at room temperature (25 °C) to investigate the critical concentration and the state of the mixture was observed by inversion after 24 h. The concentration observed when the mixture did not flow was the critical concentration for oleogelation. The minimum BW concentration was the critical concentration and the other three were made at increments of 1%. The beeswax-based oleogels prepared in different oil types and concentrations were used for further measurements.
2.2. Component analysis of oilsTOP
An Agilent 7890A gas chromatograph (Agilent, USA) (GC) equipped with a flame ionization detector and DB-WAX (30 m × 0.25 mm × 0.25 µm) was used in this study to detect the composition of fatty acids in the vegetable oils, as described in Mubiru et al., (2014). The injection volume was 1 μL. The split ratio was 10:1. Nitrogen (99.9999%) was used as carrier gas and the total flow rate was 1.0 mL min−1. The inlet temperature was set to 230 °C. The oven temperature was programmed to increase in increments of 20 °C min−1 from 90 °C to 200 °C for 0.5 min, and then held at 200 °C for 39 min. The total running time was 45 min.
2.3. Thermal propertiesTOP
The melting and crystallization curves of the oleogels were constructed by Q2000 Differential Scanning Calorimetry (DSC) (TA Instrument, USA). Approximately 10–15 mg of oleogel was hermetically sealed in an aluminum pan, heated from room temperature to 100 °C at the rate of 20 °C min−1, then cooled to 0 °C at 10 °C min−1 and held at 0 °C for 5 minutes for complete crystallization, and finally heated to 100 °C at 5 °C min−1. An empty aluminum pan was used as a control in this experiment. The crystallization onset temperature (Tg, °C), crystalline enthalpy (ΔHg,J/g) in the cooling phase, peak temperature (Tp, °C), and melting enthalpy (ΔHM,J/g) in the heating phase were achieved by analyzing these data using the thermal analyzer (TA) universal analysis software (TA Instrument, USA).
2.4. X-Ray diffraction (XRD) measurementTOP
The crystalline structures of these samples were acquired with an X-ray diffractometer (PANalytical B.V., Netherlands) using a copper source (λ=1.54056 Å) set at 40 kV and 40 mA. Each sample was spread onto a glass slide using angular scans from 5.0° to 50°(2θ) at room temperature.
2.5. Polarized Light Microscopy (PLM)TOP
The crystal morphology of the BW in vegetable oil was observed by a polarized light microscope (BK-POLR; Optec Instrument Co., Ltd, Chongqing, China) equipped with a CCD color video camera (Canon, Japan). A very small amount of the melted sample was gently smeared over the preheated glass slide and covered with a cover slip. The slide was then placed in the refrigerator
(5 °C) for 24 h to obtain pictures of the crystal morphology of the sample.
2.6. Fourier transform-infrared (FT-IR) spectroscopyTOP
The infrared absorption spectra of samples were recorded with a Nicolet 67 FT-IR spectrometer (Thermo Scientific, USA) equipped with a Smart iTX ATR sampling accessory. The samples were measured at the 4000–550 cm−1 wave range at room temperature.
2.7. Texture analysisTOP
The texture properties of samples were measured by a Texture Analyzer TA.XT plus (Stable Microsystems, Surrey, UK) equipped with a 12.7 mm cylindrical probe. The samples were placed in a beaker (5 cm in diameter and 7.3 cm in height) and pressed to 10 mm by the probe at a speed of 1 mm·s−1, and then the probe was pulled out at 10 mm·s−1. The firmness and stickiness associated with sensory evaluation and spreadability indices were calculated using the Texture Exponent v.6.1.16.0 software (Stable Microsystems). All samples were tested at room temperature (25 °C) after 24 h of preparation.
2.8. Oxidative stabilityTOP
The oxidative stability of the stored oleogel samples was determined by the peroxide value (Cd 8-53) measurement (AOCS,1987) over 90 days at room temperature (25 °C) and refrigerator temperature (5 °C), respectively. All samples were stored in sealed glass vials (10 mL). The oleogels prepared at four concentrations for each vegetable oil were investigated in octuplicate for 0, 30, 60, and 90 days at 25 °C and 5 °C to explore the effects of storage time and temperature on the oleogel samples.
2.9. Statistical analysisTOP
Each sample was analyzed in triplicate. The results were expressed as means ± SD and all statistical analyses were carried out using the SPSS 18.0 statistical software package. Data were analyzed statistically by one-way analysis of variance (ANOVA). A value of p < 0.05 was considered statistically significant.
3. RESULTS AND DISSCUSIONTOP
3.1. Determination of critical concentration.TOP
Oleogels were prepared with BW concentrations from 1 to 5% (w/w). This range was used in view of previous studies about the critical concentration of wax-based oleogels (Dassanayake et al., 2009; Hwang et al., 2012). As shown in Figure 1, the critical concentration of BW for CO-, SO-, and SFO-containing oleogels was 3%; while the critical concentration of the
FO-containing oleogel was 4%. Thus, sample concentrations of 3, 4, 5, and 6% for CO, SO, and SFO oleogels; and 4, 5, 6, and 7% for FO oleogel samples were used in the next experiments. To gain a better understanding of the differences in critical concentrations required for oleogel formation from the different oils, the composition of fatty acid in these four oils was measured. Table 1 shows the diversities in composition and concentration of the fatty acids in the four different oil samples. The fatty acids in CO mainly included oleic acid (C18:1, 78.17%), linoleic acid (C18:2, 9.76%), palmitic acid (C16:0, 8.34%), and stearic acid (C18:0, 2.15%). On the other hand, FO mainly contained oleic acid (C18:1, 21.25%), linoleic acid (C18:2, 14.10%), linolenic acid (C18:3, 54.32%), palmitic acid (C16:0, 5.45%), and stearic acid (C18:0, 4.04%); and SO contained oleic acid (C18:1, 24.78%), linoleic acid (C18:2, 51.21%), linolenic acid (C18:3, 4.99%), palmitic acid (C16:0, 11.04%), and stearic acid (C18:0, 3.71%). The composition of fatty acids in SFO was similar to that of SO-oleic acid (C18:1, 25.72%), linoleic acid (C18:2, 50.90%), linolenic acid (C18:3, 4.89%), palmitic acid (C16:0, 10.63%), and stearic acid (C18:0, 3.92%). Among these samples, FO had the highest concentration of unsaturated fatty acids (89.67%) and the lowest concentration of saturated fatty acids (9.49%), followed by CO. Fayaz et al., (2017) reported that the different viscosities of oil affected the properties of the oleogels due to a difference in the proportion of unsaturated fatty acids. Martins et al., (2016) explored the effect of different carbon chain lengths of the oil phase on beeswax-based oleogels and found that LCT gel was stronger than MCT gel during network formation. The high critical concentration for an FO-based oleogel may be caused by the de-waxing of FO. Much different from the above four oils, the analysis of BW showed the existence of odd numbered n-alkanes in the range of C23-C31 with a clear predominance of the C27 alkane, and a small amount of even-numbered n-alkanes in the range between C24 and C34 which were formed mainly from the alcoholic components of waxy esters by ester scission. The BW sample also had odd-numbered alkenes between C31, C33, and C35 (Asperger et al., 1999). Abdallah et al., (2000) showed that n-alkanes were the simplest oleogelator in structure and the stability of oleogels increased with the chain length of n-alkanes. To figure out the effects of the n-alkane on the stability of oleogels, the gel capabilities of C24, C28, C32, and C36 were compared in this study. The results showed that C36 was the most efficient oleogelator, and the concentration of these alkanes showed a negative correlation with chain length.
|
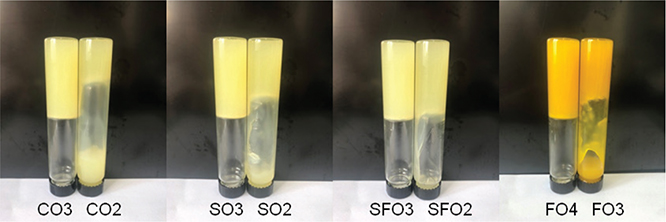 Figure 1. Determination of the critical concentration of beeswax oleogels. CO3, camellia oil oleogel with beeswax contents of 3% (w/w); CO2, camellia oil oleogel with beeswax contents of 2% (w/w); SO3, soybean oil oleogel with beeswax contents of 3% (w/w); SO2, soybean oil oleogel with beeswax contents of 2% (w/w); SFO3, sunflower oil oleogel with beeswax contents of 3% (w/w); SFO2, sunflower oil oleogel with beeswax contents of 2% (w/w); FO4, flaxseed oil oleogel with beeswax contents of 4% (w/w); FO3, flaxseed oil oleogel with beeswax contents of 3% (w/w). Figure 1. Determination of the critical concentration of beeswax oleogels. CO3, camellia oil oleogel with beeswax contents of 3% (w/w); CO2, camellia oil oleogel with beeswax contents of 2% (w/w); SO3, soybean oil oleogel with beeswax contents of 3% (w/w); SO2, soybean oil oleogel with beeswax contents of 2% (w/w); SFO3, sunflower oil oleogel with beeswax contents of 3% (w/w); SFO2, sunflower oil oleogel with beeswax contents of 2% (w/w); FO4, flaxseed oil oleogel with beeswax contents of 4% (w/w); FO3, flaxseed oil oleogel with beeswax contents of 3% (w/w).
|
|
Table 1. Fatty acid profile of edible oils
| Name |
camellia oil |
soybean oil |
sunflower oil |
flaxseed oil |
| Palmitic acid (C16:0) |
8.34±0.01c |
11.04±0.02a |
10.63±0.01b |
5.45±0.02d |
| Stearic acid (C18:0) |
2.15±0.00d |
3.71±0.01c |
3.92±0.01b |
4.04±0.01a |
| Oleic acid (C18:1) |
78.17±0.09a |
24.78±0.01b |
25.72±0.01c |
21.25±0.29d |
| Linoleic acid (C18:2) |
9.76±0.01d |
51.21±0.02a |
50.9±0.02b |
14.1±0.03c |
| Linolenic acid (C18:3) |
ND |
4.99±0.01b |
4.89±0.01c |
54.32±0.04a |
| Each sample was analyzed in triplicate and data were analyzed statistically by one-way analysis of variance (ANOVA). Average value of all data points ± standard deviation. Different letters within each row represent significant difference (p < 0.05); ND, not detected under this analysis condition. |
3.2. Thermal analysisTOP
Figure 2 shows the cooling and melting behavior of CO and FO oleogels. During the cooling stage (Figures 2a and 2c), all the samples showed the same trend and revealed two main broad exothermic peaks. The formation of exothermic peaks was
dominated by the main components of beeswax with complex composition. Doan et al., (2017) reported the thermal behavior of different natural waxes; the first exothermic peak of beeswax oleogel was attributed to its main component (wax ester), and the second peak was related to the secondary component (hydrocarbons). As show in Figures 2b and 2d, a major endothermic peak was displayed in the melting thermograms. Both SO and SFO have similar curves to CO oleogels (data not shown). The crystallization peak and the melting peak position moved toward a high temperature with an increase in beeswax concentration (Figure 2), since the beeswax base corresponded to the dilution of the bulk-wax in the vegetable oil (Doan et al., 2017). The thermal parameters of oleogels are presented in Table 2. As the concentration of beeswax increased, the Tg, ΔHg, Tp, and ΔHM of the four oil samples increased (Table 2). For example, the Tg of CO goes from 42.19 °C to 47.20 °C, ΔHg from 2.51 J/g to 6.76 J/g, Tp from 46.17 °C to 49.71 °C, and ΔHM from 1.03 J/g to 4.51 J/g. Compared to those of the CO oleogels, the thermal parameters of FO oleogels were larger because of their different critical concentrations (4% for the FO oleogel). There was no significant difference (p > 0.05) between parameters (except Tp2) for CO, SO and SFO oleogels, nor were Tg and Tp in all samples at the critical concentration. The very similar thermograms of the oleogels of different oils with the same BW concentrations indicated that the thermal curve largely depended on the oleogelator, regardless of the oil phase.
|
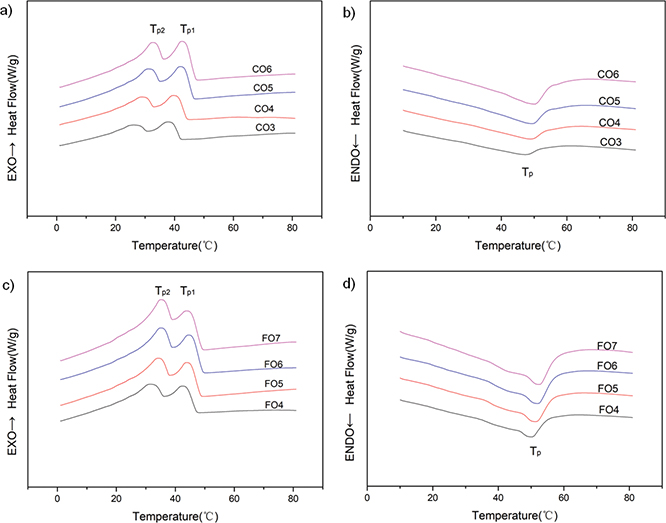 Figure 2. Thermograph of the samples, (a) CO oleogels crystallization (b) CO oleogels melting (c) FO oleogels crystallization (d) FO oleogels melting. CO, camellia oil; FO, flaxseed oil; CO3-CO6, camellia oil oleogel with beeswax contents of 3-6% (w/w); FO4-FO7, flaxseed oil oleogel with beeswax contents of 4-7% (w/w); Tp1, first peak temperature in the cooling phase; Tp2, second peak temperature in the cooling phase; Tp, peak temperature in the heating phase. Figure 2. Thermograph of the samples, (a) CO oleogels crystallization (b) CO oleogels melting (c) FO oleogels crystallization (d) FO oleogels melting. CO, camellia oil; FO, flaxseed oil; CO3-CO6, camellia oil oleogel with beeswax contents of 3-6% (w/w); FO4-FO7, flaxseed oil oleogel with beeswax contents of 4-7% (w/w); Tp1, first peak temperature in the cooling phase; Tp2, second peak temperature in the cooling phase; Tp, peak temperature in the heating phase.
|
|
Table 2: Thermal behavior of the beeswax oleogels
| Samples |
Crystallization |
Melting |
| Tg ( °C) |
ΔHg (J/g) |
Tp2 ( °C) |
Tp1( °C) |
Tp ( °C) |
ΔHM (J/g) |
| CO3 |
42.19±0.12a |
2.51±0.03b |
25.56±0.10d |
37.56±0.21b |
46.17±0.64a |
1.03±0.12b |
| CO4 |
44.26±0.15 |
3.76±0.30 |
28.47±0.56 |
39.52±0.17 |
47.38±0.08 |
2.03±0.25 |
| CO5 |
46.40±0.28 |
4.87±0.00 |
30.52±0.50 |
41.24±0.87 |
48.67±0.12 |
3.10±0.21 |
| CO6 |
47.20±0.37 |
6.76±0.07 |
31.76±0.50 |
42.14±0.48 |
49.71±0.39 |
4.51±0.35 |
| SO3 |
42.85±0.06a |
2.60±0.03b |
26.75±0.01c |
37.71±0.27b |
46.85±0.42a |
1.30±0.05b |
| SO4 |
45.04±0.47 |
4.29±0.02 |
29.97±0.09 |
40.05±0.45 |
48.53±0.50 |
2.66±0.05 |
| SO5 |
45.89±0.13 |
5.31±0.00 |
31.39±0.10 |
41.30±0.01 |
49.01±0.31 |
3.34±0.10 |
| SO6 |
47.43±0.00 |
7.39±0.04 |
33.20±0.25 |
42.61±0.21 |
49.83±0.25 |
4.00±0.11 |
| SFO3 |
43.27±0.69a |
2.37±0.01b |
26.13±0.00b |
37.19±0.26b |
46.71±0.36a |
1.36±0.22b |
| SFO4 |
44.46±0.34 |
4.24±0.00 |
29.60±0.37 |
39.63±0.31 |
47.89±0.34 |
2.95±0.05 |
| SFO5 |
46.37±0.15 |
5.05±0.03 |
31.81±0.35 |
41.62±0.31 |
49.18±0.56 |
3.49±0.09 |
| SFO6 |
47.78±0.36 |
7.13±0.07 |
33.06±0.19 |
43.11±0.50 |
49.88±0.62 |
4.93±0.02 |
| FO4 |
44.20±0.10b |
3.56±0.19a |
29.04±0.08a |
40.61±0.39a |
47.64±0.37a |
3.11±0.13a |
| FO5 |
47.96±0.09 |
6.08±0.04 |
31.97±0.37 |
43.63±0.14 |
49.99±0.04 |
4.04±0.06 |
| FO6 |
48.77±0.15 |
7.05±0.07 |
34.09±0.14 |
44.63±0.26 |
50.96±0.52 |
4.91±0.06 |
| FO7 |
49.49±0.27 |
8.65±0.17 |
35.20±0.09 |
45.57±0.04 |
51.36±0.39 |
5.87±0.04 |
| Average value of all data points ± standard deviation. Each sample was analyzed in triplicate and data were analyzed statistically by one-way analysis of variance (ANOVA). Different letters represent significant difference at the critical concentration within each column (P < 0.05). CO3-CO6, camellia oil oleogel with beeswax contents of 3-6% (w/w); SO3-SO6, soybean oil oleogel with beeswax contents of 3-6% (w/w); SFO3-SFO6, sunflower oil oleogel with beeswax contents of 3-6% (w/w); FO4-FO7, flaxseed oil oleogel with beeswax contents of 4-7% (w/w); Tg, crystallization onset temperature; ΔHg, crystalline enthalpy; Tp1, first peak temperature in the cooling phase; Tp2, second peak temperature in the cooling phase; Tp, peak temperature in the heating phase; ΔHM, melting enthalpy. |
3.3. XRD analysisTOP
Figure 3 shows the X-ray diffraction patterns of SFO oleogels (a) and FO oleogels (b) under static conditions at room temperature (25 °C). All samples show similar curves. Short-spacing patterns of about 0.42 nm and 0.38 nm were observed, indicating an orthorhombic perpendicular (O⊥) subcell packing (Hwang et al., 2012). This is consistent with the observation from rice bran wax oleogels (Dassanayake et al., 2009; Dassanayake et al., 2012), which were inferred to be the characteristic peaks of the β’ form of triacylglycerols. Among the three different polymorphs (α, β, and β’), β’ had the strongest plasticity, and exhibited the best spreadability and feel in the mouth. The smooth and uniform surface of the beeswax-based oleogels confirmed that the oleogels could partially replace margarine and shortening. As shown in Figure 3b, the peak intensity increased with increased oleogelator concentration, which was also observed with the other three oils (data not shown). This confirmed that the oil type had little impact on the polymorphism of beeswax-based oleogels.
|
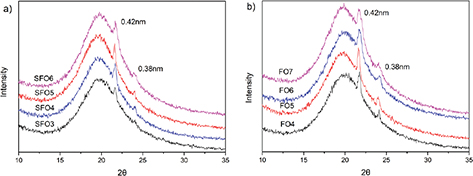 Figure 3. The X-ray diffraction (XRD) patterns of the samples, (a) sunflower oil (SFO) oleogels (b) flaxseed oil (FO) oleogels, SFO3-SFO6, sunflower oil oleogel with beeswax contents of 3-6% (w/w); FO4-FO7, flaxseed oil oleogel with beeswax contents of 4-7% (w/w). Figure 3. The X-ray diffraction (XRD) patterns of the samples, (a) sunflower oil (SFO) oleogels (b) flaxseed oil (FO) oleogels, SFO3-SFO6, sunflower oil oleogel with beeswax contents of 3-6% (w/w); FO4-FO7, flaxseed oil oleogel with beeswax contents of 4-7% (w/w).
|
|
3.4. Microscopy analysisTOP
Figure 4 shows the optical micrographs of the crystals of SFO and FO oleogels under static conditions at room temperature. The results
showed that the crystalline structure was affected by the concentration of BW. The number of crystals was very small, and most of them were short and rod shaped when the oleogels were formed (Figure 4a and 4e). Increasing concentrations of BW made evenly distributed crystals with long and thin fibers which were denser and larger in size. Dassanayake et al., (2009) reported that long needle-like crystals had good dispersibility and could entrap large amounts of oil, which is an ideal feature for oleogel formation. The crystal morphology of the CO and SO oleogel samples was similar to that of SFO, indicating that the oil type had no obvious influence on the microstructure of beeswax-based oleogels. Wright et al., (2006) pointed out that the microstructure of a low concentration hydroxylated ricinelaidic acid gel was dependent on temperature, where the fibers formed at 25 °C were shorter and smaller than those formed at 15 °C or 20 °C. Patel et al., (2013) revealed that a faster cooling rate would allow for earlier crystallization and smaller crystal formation of the samples and the shellac gelation at low concentrations was more susceptible to being shear.
|
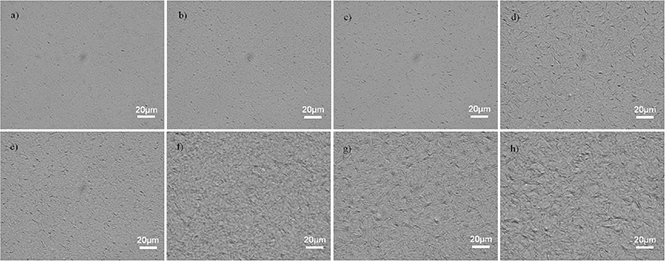 Figure 4. The polarized light microscopy (PLM) pictures of the samples, (a) SFO3 (b) SFO4 (c) SFO5 (d) SFO6 (e) FO4 (f) FO5 (g) FO6 (h) FO7. SFO3-SFO6, sunflower oil oleogel with beeswax contents of 3-6% (w/w); FO4-FO7, flaxseed oil oleogel with beeswax contents of 4-7% (w/w). Figure 4. The polarized light microscopy (PLM) pictures of the samples, (a) SFO3 (b) SFO4 (c) SFO5 (d) SFO6 (e) FO4 (f) FO5 (g) FO6 (h) FO7. SFO3-SFO6, sunflower oil oleogel with beeswax contents of 3-6% (w/w); FO4-FO7, flaxseed oil oleogel with beeswax contents of 4-7% (w/w).
|
|
3.5. FT-IR spectroscopy analysisTOP
Figure 5 presents a similar infrared spectrum of 6% beeswax-based oleogels and FO. This analysis showed that absorption peaks of about 2921 cm−1 and 2852 cm−1 in oleogels were related to the symmetric and anti-symmetric -CH2- stretching of alkanes (Lupi et al., 2016) and the peak around 1743 cm−1 may be related to the C=O stretching vibration of the triglycerides (Singh et al., 2013). The peak at 1000–1300 cm−1 was due to the C–O stretching vibration in the ester group. The increase in the carbonyl intensity of the gel compared to BW indicated the existence of the ester group in triglycerides (Fayaz et al., 2017). The wave number of the symmetric and anti-symmetric -CH2- stretching vibration of the gel was reduced compared to the oil phase. For example, the peaks for FO were at 2923 cm−1 and 2854 cm−1, and the FO oleogels were at 2921 cm−1 and 2852 cm−1. The decrease in alkyl chain fluidity indicated the presence of van der Waals interactions although there was no significant difference between FO and FO oleogels (Suzuki et al., 2003). Doan et al., (2015) reported that the weak interactions within crystal clusters (van der Waals forces) could lead to waxing and vegetable oil gel formation. The existence of hydrogen bonds in monoglycerides, α-sitosterol, and β-oryzanol could also promote the formation of oleogels (den Adel et al., 2010; Yılmaz et al., 2014).
|
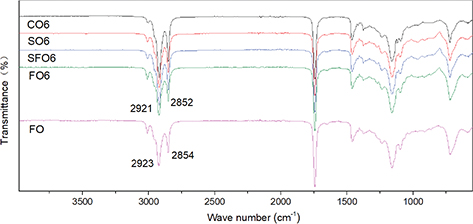 Figure 5. The FT-IR spectra of the 6% (w/w) beeswax oleogels and flaxseed oil (FO). CO6, camellia oil oleogel with beeswax contents of 6% (w/w); SO6, soybean oil oleogel with beeswax contents of 6% (w/w); SFO6, sunflower oil oleogel with beeswax contents of 6% (w/w); FO6, flaxseed oil oleogel with beeswax contents of 6% (w/w). Figure 5. The FT-IR spectra of the 6% (w/w) beeswax oleogels and flaxseed oil (FO). CO6, camellia oil oleogel with beeswax contents of 6% (w/w); SO6, soybean oil oleogel with beeswax contents of 6% (w/w); SFO6, sunflower oil oleogel with beeswax contents of 6% (w/w); FO6, flaxseed oil oleogel with beeswax contents of 6% (w/w).
|
|
3.6. Textural propertiesTOP
Figure 6 shows the structural parameters of the samples at 25 °C. The firmness of each oil phase of the oleogels increased with the oleogelator in a concentration-dependent manner. The concentrations of CO, SO, SFO, and FO varied from 12.65 g to 263.88 g; 14.61 g to 373.72 g; 17.79 g to 294.95 g; and 82.30 g to 544.54 g; respectively. Figure 4 also demonstrates that the crystals grew and intertwined on the microstructure as the concentration of BW increased, so that
the ability of oil interception was enhanced and firmness increased. The firmness of CO3 was lower than that of SO3 and SFO3. CO2 was mostly a flowing liquid; while SO2 and SFO2 were in a viscous state when no gel was formed (Figure 1). The network structure of CO3 may not have been well developed compared to SO3 and SFO3 even though gels were formed. The firmness of the FO gel was much greater than other oelogels at the critical concentration, but at the same concentration (e.g. 6%, FO6 < SO6, 318.24g < 373.72 g) it was lower than SO oleogels. Firmness and stickiness measurements are a method of characterizing ductility. Figure 6b exhibits how the tendency of stickiness and firmness were very similar among these samples. The stickiness of CO, SO, SFO, and FO varied from 21.20 g to 233.82 g; 21.20 g to 236.98 g; 25.69 g to 198.36 g; and 79.13 g to 271.75 g, respectively. SO6 showed the maximum value at the same BW concentration (6%) (236.98 g). Many factors affect the structural parameters of oleogels, such as the oil type and the storage temperature. Additionally, it is affected by storage time, cooling rate, and shear.
|
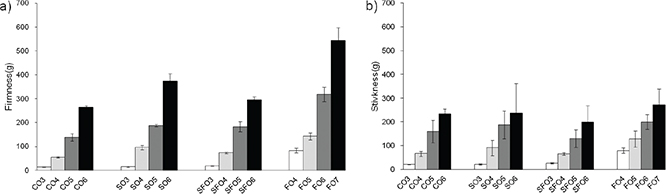 Figure 6. The firmness and stickiness values of the samples at room temperature (25 °C). Each experiment was repeated three times, and the results were expressed as the means with error bar. CO3-CO6, camellia oil oleogel with beeswax contents of 3-6% (w/w); SO3-SO6, soybean oil oleogel with beeswax contents of 3-6% (w/w); SFO3-SFO6, sunflower oil oleogel with beeswax contents of 3-6% (w/w); FO4-FO7, flaxseed oil oleogel with beeswax contents of 4-7% (w/w). Figure 6. The firmness and stickiness values of the samples at room temperature (25 °C). Each experiment was repeated three times, and the results were expressed as the means with error bar. CO3-CO6, camellia oil oleogel with beeswax contents of 3-6% (w/w); SO3-SO6, soybean oil oleogel with beeswax contents of 3-6% (w/w); SFO3-SFO6, sunflower oil oleogel with beeswax contents of 3-6% (w/w); FO4-FO7, flaxseed oil oleogel with beeswax contents of 4-7% (w/w).
|
|
3.7. Peroxide valueTOP
Figure 7 shows the peroxide value (PV) of the samples at 25 °C (a) and 5 °C (b) over 90 days. The PV of all samples was increased during storage. CO, SO, and SFO oleogels had the low initial values, but their PV increased rapidly over time at 25 °C. Although the initial value of the FO oleogel was relatively low, the PV increased to the same level of other gels with prolonged storage time at 25 °C. The PV of FO gels at 25 °C was about twenty times of that at 5 °C, while it was about five times for SFO gels, three times for SO gels, and about two times for CO gels, indicated that all samples were affected by temperature. During the storage period, SO3 had the maximum PV (30.613 meqO2·kg−1) when stored at 25 °C for 90 days and FO4 had the minimum PV (0.914 meqO2·kg−1) when stored at 5 °C for 0 days. The PV of all gels increased slowly but steady at 5 °C, while SFO4 and FO5 showed no significant difference (p > 0.05) during storage and all the samples had good stability. Yilmaz et al., (2015) pointed out that the PV of the oleogel is affected by the oil phase and if the oil is stable, the prepared oleogel is also stable. The FO is a first-grade cold drawn oil with a low PV, so the PV of oleogels produced from FO is significantly lower than other oleogels. Öğütcü et al., (2015) reported that sunflower wax gels had higher oxidation stability than monoglyceride gels, which may be affected by the composition and saturation/unsaturation changes in fatty acid.
|
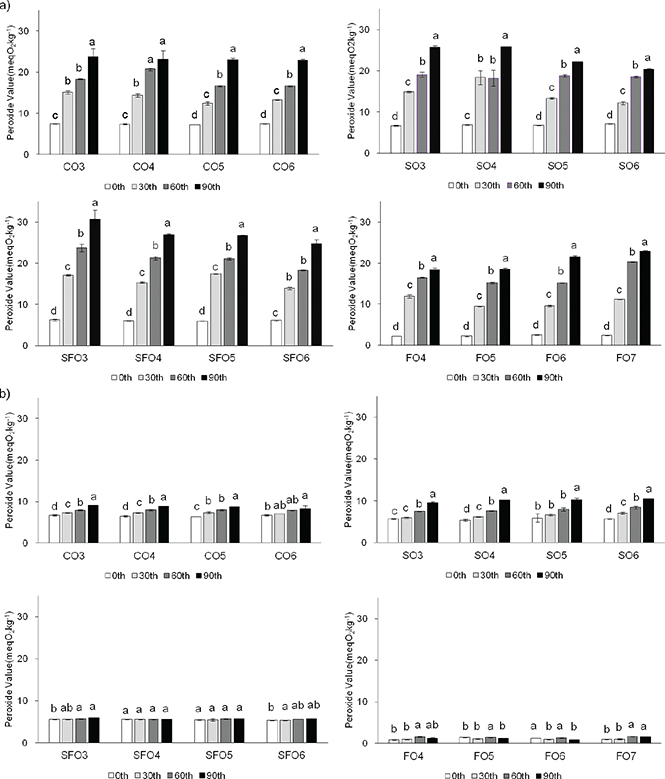 Figure 7. The peroxide values (PV) of the samples stored at (a) 25 °C, (b) 5 °C. Each sample was analyzed in triplicate and data were analyzed statistically by one-way analysis of variance (ANOVA); Different letters present significantly different of samples with the storage time (P<0.05). CO3-CO6, camellia oil oleogel with beeswax contents of 3-6% (w/w); SO3-SO6, soybean oil oleogel with beeswax contents of 3-6% (w/w); SFO3-SFO6, sunflower oil oleogel with beeswax contents of 3-6% (w/w); FO4-FO7, flaxseed oil oleogel with beeswax contents of 4-7% (w/w). Figure 7. The peroxide values (PV) of the samples stored at (a) 25 °C, (b) 5 °C. Each sample was analyzed in triplicate and data were analyzed statistically by one-way analysis of variance (ANOVA); Different letters present significantly different of samples with the storage time (P<0.05). CO3-CO6, camellia oil oleogel with beeswax contents of 3-6% (w/w); SO3-SO6, soybean oil oleogel with beeswax contents of 3-6% (w/w); SFO3-SFO6, sunflower oil oleogel with beeswax contents of 3-6% (w/w); FO4-FO7, flaxseed oil oleogel with beeswax contents of 4-7% (w/w).
|
|
4. CONCLUSIONSTOP
The critical concentration, thermal properties, structural characteristics, and oxidative stability of beeswax-based oleogels were investigated in this study. The critical concentration of BW for CO, SO and SFO based gels was 3%, and that for an FO gel was 4% at room temperature (25 °C). The critical concentration was mainly affected by attributes of the oil, such as the composition, content, and saturation of fatty acids. All oleogels exhibited the same thermal thermograph regardless of the oil phase and had the same thermal parameters, which basically depended on the amount of oleogelator added. It was visually observed that the beeswax-based oleogels had a smooth and uniform surface, and the results of XRD and PLM also confirmed that it had an orthorhombic perpendicular (O⊥) subcell structure and long needle-like crystals, so that the formation of microstructures were independent of the oil phase. FT-IR spectra revealed that beeswax-based oleogels were formed via non-covalent bond and were likely stabilized with physical entanglements. The CO3 demonstrated a weaker gel network than SO3 and SFO3, and SO oleogel shows the highest firmness and stickiness among the four gels at 6% BW addition. The oxidation stability experiment indicated that the peroxide value of the beeswax-based oleogel was primarily determined by the oil type and was stable without notable changes during storage at 5 °C. The rheological properties of beeswax-based oleogel need to be studied and much more information (such as thermo-reversible, thixotropic) is needed before oleogel can be widely applied in the food industry.
DATA AVAILABILITY STATEMENTS TOP
All data included in this study are available upon request by contact with the corresponding author.
ACKNOWLEDGMENTSTOP
Financial support from National Natural Science Foundation of China (No. 31801504) and the Fundamental Research Funds for the Central Universities of China (Grant No. PA2019GDPK0065) are gratefully acknowledged.
REFERENCESTOP
| ○ |
AOCS. 1987. Peroxide value acetic acid – chloroform method (Cd 8-53). American Oil Chemists’ Society. AOCS Press, Champaign, US |
| ○ |
Abdallah DJ, Weiss RG. 2000. n-Alkanes gel n-alkanes (and many other organic liquids). Langmuir 16, 352–355. https://doi.org/10.1021/la990795r |
| ○ |
Adel R den, Heussen PCM, Bot A. 2010. Effect of water on self-assembled tubules in α-sitosterol +β-oryzanol-based organogels. J. Physics: Conference Series 247, 012025. https://doi.org/10.1088/1742-6596/247/1/012025 |
| ○ |
Asperger A, Engewald W, Fabian G. 1999. Analytical characterization of natural waxes employing pyrolysis–gas chromatography–mass spectrometry. J. Anal. Appl. Pyrolysis 50, 103–115. https://doi.org/10.1016/S0165-2370(99)00031-5 |
| ○ |
Dassanayake LSK, Kodali DR, Ueno S, Sato K. 2012. Crystallization kinetics of organogels prepared by rice bran wax and vegetable oils. J. Oleo Sci. 61, 1–9. https://doi.org/10.5650/jos.61.1 |
| ○ |
Dassanayake LSK, Kodali DR, Ueno S, Sato K. 2009. Physical Properties of Rice Bran Wax in Bulk and Organogels. J. Am. Oil Chem. Soc. 86, 1163–1173. https://doi.org/10.1007/s11746-009-1464-6 |
| ○ |
Doan CD, To CM, De Vrieze M, Lynen F, Danthine S, Brown A, Dewettinck K, Patel AR. 2017. Chemical profiling of the major components in natural waxes to elucidate their role in liquid oil structuring. Food Chem. 214, 717–725. https://doi.org/10.1016/j.foodchem.2016.07.123 |
| ○ |
Doan CD, Van de Walle D, Dewettinck K, Patel AR. 2015. Evaluating the Oil-Gelling Properties of Natural Waxes in Rice Bran Oil: Rheological, Thermal, and Microstructural Study. J. Am. Oil Chem. Soc. 92, 801–811. https://doi.org/10.1007/s11746-015-2645-0 |
| ○ |
Fayaz G, Goli SAH, Kadivar M. 2017. A Novel Propolis Wax-Based Organogel: Effect of Oil Type on Its Formation, Crystal Structure and Thermal Properties. J. Am. Oil Chem. Soc. 94, 47–55. https://doi.org/10.1007/s11746-016-2915-5 |
| ○ |
Hughes NE, Marangoni AG, Wright AJ, Rogers MA, Rush JW. 2009. Potential food applications of edible oil organogels. Trends Food Sci. Technol. 20, 470–480. https://doi.org/10.1016/j.tifs.2009.06.002 |
| ○ |
Hwang HS, Kim S, Singh M, Winkler-Moser JK, Liu SX. 2012. Organogel formation of soybean oil with waxes. J. Am. Oil Chem. Soc. 89, 639–647. https://doi.org/10.1007/s11746-011-1953-2 |
| ○ |
Hwang HS, Singh M, Bakota EL, Winkler-Moser JK, Kim S, Liu SX. 2013. Margarine from Organogels of Plant Wax and Soybean Oil. J. Am. Oil Chem. Soc. 90, 1705–1712. https://doi.org/10.1007/s11746-013-2315-z |
| ○ |
Lichtenstein AH, Erkkilä AT, Lamarche B, Schwab US, Jalbert SM, Ausman LM. 2003. Influence of hydrogenated fat and butter on CVD risk factors: remnant-like particles, glucose and insulin, blood pressure and C-reactive protein. Atherosclerosis 171, 97–107. https://doi.org/10.1016/j.atherosclerosis.2003.07.005 |
| ○ |
Lupi FR, Greco V, Baldino N, de Cindio B, Fischer P, Gabriele D. 2016. The effects of intermolecular interactions on the physical properties of organogels in edible oils. J. Colloid Interface Sci. 483, 154–164. https://doi.org/10.1016/j.jcis.2016.08.009 |
| ○ |
Martins AJ, Cerqueira MA, Fasolin LH, Cunha RL, Vicente AA. 2016. Beeswax organogels: Influence of gelator concentration and oil type in the gelation process. Food Res. Int. 84, 170–179. https://doi.org/10.1016/j.foodres.2016.03.035 |
| ○ |
Mubiru E, Shrestha K, Papastergiadis A, De Meulenaer B. 2014. Development and validation of a gas chromatography-flame ionization detection method for the determination of epoxy fatty acids in food matrices. J. Agric. Food Chem. 62, 2982–2988. https://doi.org/10.1021/jf405664c |
| ○ |
Okuro PK, Tavernier I, Bin Sintang MD, Skirtach AG, Vicente AA, Dewettinck K, Cunha RL. 2018. Synergistic interactions between lecithin and fruit wax in oleogel formation. Food Funct. 9, 1755–1767. https://doi.org/10.1039/C7FO01775H |
| ○ |
Öğütcü M, Temizkan R, Arifoglu N, Yılmaz E. 2015. Structure and Stability of Fish Oil Organogels Prepared with Sunflower Wax and Monoglyceride. J. Oleo Sci. 64, 713–720. https://doi.org/10.5650/jos.ess15053 |
| ○ |
Patel AR, Schatteman D, De Vos WH, Lesaffer A, Dewettinck K. 2013. Preparation and rheological characterization of shellac oleogels and oleogel-based emulsions. J. Colloid Interface Sci. 411, 114–121. https://doi.org/10.1016/j.jcis.2013.08.039 |
| ○ |
Pernetti M, Vanmalssen K, Kalnin D, Flöter E. 2007. Structuring edible oil with lecithin and sorbitan tri-stearate. Food Hydrocolloids 21, 855–861. https://doi.org/10.1016/j.foodhyd.2006.10.023 |
| ○ |
Singh A, Auzanneau FI, Rogers MA. 2017. Advances in edible oleogel technologies - A decade in review. Food Res. Int. 97, 307–317. https://doi.org/10.1016/j.foodres.2017.04.022 |
| ○ |
Singh VK, Pal K, Pradhan DK, Pramanik K. 2013. Castor oil and sorbitan monopalmitate based organogel as a probable matrix for controlled drug delivery. J. Appl. Polym. Sci. 130, 1503–1515. https://doi.org/10.1002/app.39315 |
| ○ |
Suzuki M, Nakajima Y, Yumoto M, Kimura M, Shirai H, Hanabusa K. 2003. Effects of hydrogen bonding and van der Waals interactions on organogelation using designed low-molecular-weight gelators and gel formation at room temperature. Langmuir 19, 8622–8624. https://doi.org/10.1021/la034772v |
| ○ |
Toro-Vazquez JF, Morales-Rueda JA, Dibildox-Alvarado E, Charo-Alonso M, Alonzo-Macias M, Gonzales-Chavez MM. 2007. Thermal and textural properties of organogels developed by candelilla wax in safflower oil. J. Am. Oil Chem. Soc. 84, 989–1000. https://doi.org/10.1007/s11746-007-1139-0 |
| ○ |
Tulloch AP. 1971. Beeswax: structure of the esters and their component hydroxy acids and diols. Chem. Phys. Lipids 6, 235–265. https://doi.org/10.1016/0009-3084(71)90063-6 |
| ○ |
Wang FC, Gravelle AJ, Blake AI, Marangoni AG. 2016. Novel trans fat replacement strategies. Curr. Opin. Food Sci. 7, 27–34. https://doi.org/10.1016/j.cofs.2015.08.006 |
| ○ |
Willett WC. 2006. Trans fatty acids and cardiovascular disease-epidemiological data. Atheroscler. Suppl. 7, 5–8. https://doi.org/10.1016/j.atherosclerosissup.2006.04.002 |
| ○ |
Wright AJ, Marangoni AG. 2006. Time, Temperature, and Concentration Dependence of Ricinelaidic Acid–Canola Oil Organogelation. J. Am. Oil Chem. Soc. 84, 3–9. https://doi.org/10.1007/s11746-006-1012-6 |
| ○ |
Yılmaz E, Öğütcü M. 2014. Properties and Stability of Hazelnut Oil Organogels with Beeswax and Monoglyceride. J. Am. Oil Chem. Soc. 91, 1007–1017. https://doi.org/10.1007/s11746-014-2434-1 |