Development of walnut oil and almond oil blends for improvements in nutritional and oxidative stability
F. Pana, X. Wanga, B. Wena, C. Wangb, Y. Xua, W. Danga and M. Zhanga,*
aLaboratory of Nutrition and Functional Food, College of Food Science and Engineering, Jilin University, Changchun 130062, PR China
bJilin Baili Biotechnology Co.LTD; Changchun 130062, PR China
*Corresponding author: Zhangmd@jlu.edu.cn
| |
SUMMARY
For the increase in oxidative stability and phytonutrient contents of walnut oil (WO), 5, 10, 20 and 30% blends with almond oil (AO) were prepared. The fatty acid compositions and the micronutrients of the oil samples such as tocopherol, phytosterol and squalene were measured by GC-MS and HPLC. It was found that the proportions of PUFAs/SFAs in blended oils with high AO contents were lowered, and the blends contained higher levels of tocopherols, phytosterols and squalene than those of pure WO. The 60 °C oven accelerated oxidation test was used to determine the oxidative stability of the blended oil. The fatty acid composition, micronutrients and oxidation products were determined. The results showed that the oxidation stability of the blended oil increased with an increasing proportion of AO. In addition, a significant negative correlation between micronutrient and oxidation products was observed as the number of days of oxidation increased.
|
| |
RESUMEN
Desarrollo de mezclas de aceites de nuez y almendra para mejorar la estabilidad nutricional y oxidativa. Para el aumento de la estabilidad oxidativa y los contenidos de fitonutrientes del aceite de nuez (WO) se prepararon mezclas al 5, 10, 20 y 30% con aceite de almendras (AO). La composición de ácidos grasos y los micronutrientes de las muestras de aceite como tocoferoles, fitosteroles y escualeno se midieron por GC-MS y HPLC. Se descubrió que la relación de PUFA / SFA en un aceite mezclado con un alto contenido de AO se redujo, y la mezcla contenía niveles más altos de tocoferoles, fitosteroles y escualeno que los de WO puro. La prueba de oxidación acelerada en horno de 60 °C se usó para determinar la estabilidad oxidativa del aceite mezclado. Se determinaron la composición de ácidos grasos, micronutrientes y productos de oxidación. Los resultados mostraron que la estabilidad a la oxidación del aceite mezclado aumentó con una proporción creciente de AO. Además, se observó una correlación negativa significativa entre los micronutrientes y los productos de oxidación a medida que aumentaba el número de días de oxidación.
|
1. INTRODUCTIONTOP
Edible oil is one of the three major nutritional components of the human diet. Edible oil plays an important role in the dietary pyramid and is extremely necessary for maintaining the normal physiological functions of the human body (Hart et al., 2018). In recent years, people have paid more attention to the quality and nutrition of edible oil due to increased health awareness and improved living standards. The most important factors of oils in the food industry are their quality, stability and nutritional characteristics. It is interesting to note that pure oils do not have both suitable functional and nutritional properties and proper oxidative stability (Hashempour-Baltork et al., 2016). For example, perilla oil, linseed oil and sea buckthorn seed oil are rich in α-linolenic acid but easily oxidized, which limits their application. One of the simplest ways to create new products with ideal nutritional and oxidation properties is to mix different types of oils (Hashempour-Baltork et al., 2016).
WO comes from walnuts and is a nutrient-dense food due to its lipid characteristics (Zhou et al., 2017). It contains fatty acids and has excellent minor component contents (Gao et al., 2019). The main fatty acid in WO is linoleic acid (52.5–60.2%) and it also contains a large amount of linolenic acid (8.1–15.2%) (Emre, 2018). Epidemiological and clinical trials have shown that higher PUFA intake can lower blood pressure, total cholesterol and LDL cholesterol levels (Emre, 2018). However, the polyunsaturated fatty acids present in WO are easily oxidized. In the presence of heat, light and reactive oxygen species, active free radicals can be formed. These free radicals can be converted into hydroperoxides and secondary oxidation products such as aldehydes, ketones and high-molecular weight polymers (Mohanan et al., 2018). These oxidation products are toxic and are closely related to the biological damage of tissues and cardiovascular disease (Nagao et al., 2008).
AO is a high-value product that contains bioactive compounds that promote healthy functions (Rabadán et al., 2018). Its monounsaturated fatty acid content is rich, accounting for more than 50% of the fatty acid content, and has excellent oxidative stability (Matthäus et al., 2018). In addition, AO is rich in micronutrients such as tocopherols, sterols and squalene at levels of 450 μg/g, 2, 200 μg/g and 95 μg/g, respectively. These ingredients are considered traditional antioxidants and contribute to the diversity of the physiological, biological and biochemical functions of AO, including anti-inflammatory, immunity-enhancing and anti-hepatotoxicity properties. When they are present in food, they can inhibit the absorption of cholesterol and thus lower the density of low density lipoprotein (Givianrad et al., 2013).
Blended oil is an edible oil product that is prepared from two or more refined vegetable oils in a specific proportion according to the nutritional needs of the population. On the one hand, the proportion of fatty acids in blended oil products is likely produced to meet the needs of the human body in terms of the composition of fatty acids. Long-term consumption of blended oil will not result in an excessive or insufficient intake of certain fatty acids. Therefore, blended oil not only improves human health and achieves the goal of balanced nutrition but also reduces the incidence of certain chronic diseases (Jiang et al., 2011). Blended oils can also contain an increased content of bioactive lipids and natural antioxidants to provide better quality oils, including better physical and chemical properties, higher nutritional values and improved affordability (Ramadan and Wahdan, 2012). On the other hand, the oxidative stability of blended oils during and after processing is one of the most important features of edible oils (Tavakoli et al., 2018). A high oxidation stability of edible oil is also an added value in the market.
No previous research has been conducted on the blending of WO and AO. The purpose of this paper is to study the nutritional characteristics and oxidative stability of their blended oils. Through the changes of various parameters and the relationship between the parameters, the oxidation law of blended oil is comprehensively understood to predict the oxidation process of blended oil. Whether it is to reveal the relationship between the “intrinsic influence factor” and “oxidation degree” of blended oil or to predict the oxidation process of blended oil, understanding that oxidation has important theoretical and practical significance.
2. MATERIALS AND METHODSTOP
2.1. Samples and reagentsTOP
WO and AO were purchased from local markets.
Methanol, n-hexane and isooctane (HPLC grade) were purchased from Merck (Darmstadt, Germany). Water was purified using a Milli-Q water purification system (Millipore, Bedford, USA). A 37-component fatty acid methyl ester (FAME) mix, standards of α-, γ-, and δ-tocopherol and standards of squalene were purchased from Sigma-Aldrich (Bellefonte, PA). A plant sterol mixture (β-sitosterol 53%, stigmasterol 7%, campesterol 26%, brassicasterol 13%) was purchased from Matreya LLC Co. (Sweden). All chemical reagents, including solvents, were of analytical grade and were obtained from local suppliers.
2.2. Blending of vegetable oilsTOP
The blends were prepared by mixing WO with AO in the following respective proportions: 95:5, 90:10, 80:20, and 70:30 (m/m). The mixtures were uniformly stirred for 20 min according to the methodology described by Choudhary et al., (2015).
2.3. Accelerated oxidationTOP
All of the oil samples were placed in 50 mL colorless glass bottles. Under limited air and dark conditions, oxidation was carried out in a 60 °C oven for 24 days. During this period, the sample position in the oven was changed every 12 h. A batch of samples was collected every 4 days, and their related index was measured (Cao et al., 2015).
2.4. Fatty acid composition analysisTOP
The fatty acid composition of the oil samples was determined by GC-MS (GC-MS-2010, Shimadzu, Kyoto, Japan) and reported as relative area percentage. Prior to GC-MS analysis, the fatty acids were methylated according to the method of Li et al., (2013).
One microliter of the sample was injected into a fused silica capillary column (0.25 μm, 30 m × 0.25 mm, Shimadzu, Japan) for separation. High purity helium was used as the carrier gas at a flow rate of 2 mL/min with a split injection ratio of 40:1. The column oven temperature was set to 160 °C, and the injection temperature was 250 °C. The following temperature ramp procedure was used: 160 °C for 5 min, followed by an increase of 2 °C/min to 220 °C, held for 10 min, with an increase of 2 °C/min to 230 °C, which was maintained for 5 min. The ion source and interface temperatures were 200 and 250 °C, respectively. GC-MS was performed using 70 eV EI in scan acquisition mode and quantified by TIC. Fatty acids were identified by the NIST Mass Spectrometry Library (National Institute of Standards and Technology, Gaithersburg, MD, USA). All mass spectra were obtained in the range of m/z 30–500 (Nogueira et al., 2018).
2.5. Tocopherol determinationTOP
The tocopherol content was determined based on the method of Gliszczyńska-Świgło and Sikorska (2004). A sample of oil (100 mg) was dissolved in 2 mL of isopropanol. All HPLC analyses of tocopherols were performed at room temperature on a Shimadzu LC-2010 high-performance liquid chromatograph (Shimadzu, Kyoto, Japan) equipped with a C18 column (250 mm × 4.6 mm, 5 μm, Agilent, CA, USA). The detection was carried out on a fluorescence detector (detection wavelength 330 nm, excitation wavelength 290 nm). A mobile phase consisting of 50% acetonitrile (solvent A) and 50% methanol (solvent B) was used at a flow rate of 1 mL/min. The injection volume was 20 μL.
2.6. Phytosterol determinationTOP
Sterols were analyzed following the methods reported by Changmo et al., (2011), with minor modifications. 200 mg oil samples were mixed with 3 mL of a 2 M potassium hydroxide ethanol solution and 0.15 mL of an internal standard (0.5 mg/mL 5α-cholestanol) at 90 °C for 1 h. After cooling the mixture to room temperature, 1 mL of water and 2 mL of n-hexane were added, vortexed for 5 min, and centrifuged for 10 min (3980 rpm), and the supernatant was taken and dried under nitrogen. Next, 100 μL of a silanization reagent was added, the sterols were derivatized in an oven at 60 °C for 45 min, and then dried under nitrogen. Finally, 1.5 mL of n-hexane was added, and 1 μL of product was analyzed by GC-MS.
Sterol samples were detected by a QP 2010 GC-MS (Shimadzu Corp, Kyoto, Japan) with an Rxi-5MS capillary column (0.25 μm, 30 m × 0.25 mm, Shimadzu, Japan). The carrier gas was helium at a flow rate of 1.82 mL/min, and the split ratio was 20:1. The analysis was carried out under the following temperature program: the initial temperature was set at 150 °C and raised to 300 °C at a rate of 10 °C/min for 12 min. The ion source temperature was 230 °C, the transfer line temperature was 280 °C, and the solvent delay was 14.5 min. The mass range was 50–500 m/z. The phytosterols in the oil samples were characterized according to the mass spectrum of the corresponding standards.
2.7. Squalene determinationTOP
The pretreatment of squalene in edible oils was similar to that of phytosterols. Briefly, 200 mg of oil sample was mixed with 2 mL of a 2 M potassium hydroxide methanol solution at 80 °C for 30 min. The mixture was cooled to room temperature and mixed with 2 mL of n-hexane. The supernatant (1 μL) was analyzed by GC-MS.
2.8. Physicochemical propertiesTOP
Measurement of the PV, CD, p-AnV and TBARS values. To determine the PV and p-AnV, the method was performed by using the formula given in a previous report (Vaisali et al., 2016). The TBARS value was measured by implementing the National Standard GB/T 5009.181–2003 of China. To measure the CD value, the method proposed by Farahmandfar et al., (2018) was used.
2.9. Statistical analysisTOP
Each variable was studied in duplicate or triplicate, and the results were expressed as the average of the two or three independent measurements of a sample. Statistical analyses were carried out using Statistical Product and Service Solutions (SPSS) 23.0 (SPSS Inc., Chicago, IL, USA) and Origin 8.0 (Originlab, Northampton, MA, USA). An analysis of variance (ANOVA) was made using one-way followed by Tukey’s significant difference test (p < 0.05). A correlation analysis was carried out by Pearson’s test.
3. RESULTS AND DISCUSSIONTOP
3.1. Changes in fatty acid contents during oxidationTOP
The fatty acids of the WO, AO and their blended oils are presented in Table 1a. There was no significant difference in the fatty acid composition of the six oils. WO was characterized by a high percentage of linoleic acid (C18:2, 59.45 ± 0.04%), followed by oleic acid (C18:1, 19.71 ± 0.03%) and linolenic acid (C18:3, 10.37 ± 0.01%). These results are consistent with the fatty acid composition of the WO reported by Emra et al., (2018). The AO contained more monounsaturated fatty acids than WO, increasing its oxidation stability. A study by Rabadán et al., (2018) showed that oleic acid accounted for more than 65% of the fatty acid composition of AO. Vegetable oils with high proportions of unsaturated fatty acids are generally not as stable as vegetable oils with high proportions of saturated fatty acids (Micić et al., 2015). The reported rates of oxidation of C18:1 and C18:2 are in the order of 1:12 (Ramadan and Wahdan, 2012). The results showed that all four blended oils were in compliance with the WHO regulations of n-6/n-3=1:5−10. As the proportion of AO increased in the blended oil, the proportion of MUFAs also gradually increased, and the PUFAs/SFAs gradually decreased. Bhatnagar et al., (2009) found that lowering the ratio of PUFAs/SFAs in the diet increased the level of postprandial HDL-C. In addition, the PUFAs/SFAs ratio is generally considered to be an indicator of oxidative stability. A decrease in the PUFAs/SFAs ratio indicates that the stability of blended oil has been improved (Tilakavati and Kalyana, 2013).
Table 1a. Fatty acid composition of WO, AO and blended oils (5, 10, 20, 30% of AO), %
| |
WO |
5% |
10% |
20% |
30% |
AO |
| C14:0 |
0.04 ± 0.00a |
0.04 ± 0.01a |
0.04 ± 0.00a |
0.04 ± 0.01a |
0.03 ± 0.00b |
0.02 ± 0.00c |
| C16:0 |
7.15 ± 0.01a |
7.04 ± 0.02b |
6.90 ± 0.01c |
6.65 ± 0.04d |
6.40 ± 0.02e |
4.62 ± 0.01f |
| C16:1 |
0.13 ± 0.01f |
0.16 ± 0.01e |
0.18 ± 0.00d |
0.21 ± 0.01c |
0.25 ± 0.01b |
0.51 ± 0.01a |
| C17:0 |
0.05 ± 0.01a |
0.05 ± 0.00a |
0.05 ± 0.00a |
0.05 ± 0.00a |
0.05 ± 0.01b |
0.04 ± 0.01b |
| C17:1 |
0.03 ± 0.01e |
0.03 ± 0.01d |
0.03 ± 0.00c |
0.05 ± 0.00b |
0.04 ± 0.01b |
0.10 ± 0.00a |
| C18:0 |
2.57 ± 0.01a |
2.52 ± 0.01b |
2.47 ± 0.01c |
2.30 ± 0.02d |
2.20 ± 0.01e |
1.08 ± 0.01f |
| C18:1 |
19.71 ± 0.03e |
21.88 ± 0.01e |
23.96 ± 0.02d |
28.14 ± 0.04c |
32.27 ± 0.05b |
60.36 ± 0.02a |
| C18:2 |
59.45 ± 0.04a |
57.90 ± 0.01b |
56.46 ± 0.07c |
53.57 ± 0.01d |
50.69 ± 0.04e |
30.96 ± 0.02f |
| C18:3 |
10.37 ± 0.01a |
9.91 ± 0.00b |
9.46 ± 0.02c |
8.58 ± 0.01d |
7.74 ± 0.01e |
2.01 ± 0.01f |
| C20:0 |
0.09 ± 0.00a |
0.09 ± 0.00a |
0.07 ± 0.01b |
0.09 ± 0.00a |
0.09 ± 0.00a |
0.09 ± 0.01a |
| C20:1 |
0.26 ± 0.04a |
0.23 ± 0.01a |
0.24 ± 0.02a |
0.23 ± 0.01ab |
0.20 ± 0.02b |
0.18 ± 0.01b |
| C20:2 |
0.04 ± 0.01ab |
0.03 ± 0.01ab |
0.03 ± 0.01b |
0.25 ± 0.01b |
0.07 ± 0.04a |
n.d. |
| C22:0 |
0.08 ± 0.02b |
0.11 ± 0.00a |
0.01 ± 0.02ab |
0.06 ± 0.01b |
0.08 ± 0.00b |
0.04 ± 0.02c |
| SFA |
9.99 ± 0.02a |
9.85 ± 0.02b |
9.63 ± 0.01c |
9.19 ± 0.03d |
8.79 ± 0.02e |
5.87 ± 0.01f |
| MUFA |
20.14 ± 0.07f |
22.31 ± 0.02e |
24.42 ± 0.04d |
28.63 ± 0.04c |
32.77 ± 0.03b |
61.16 ± 0.02a |
| PUFA |
69.87 ± 0.05a |
67.84 ± 0.01b |
65.95 ± 0.05c |
62.17 ± 0.02d |
58.43 ± 0.04e |
32.97 ± 0.02f |
| PUFA/SFA |
7.00 ± 0.01a |
6.89 ± 0.02b |
6.85 ± 0.01c |
6.76 ± 0.01d |
6.64 ± 0.02e |
5.62 ± 0.01f |
| N-6/N-3 |
5.73 ± 0.00f |
5.84 ± 0.00e |
5.97 ± 0.02d |
6.24 ± 0.00c |
6.55 ± 0.01b |
15.40 ± 0.08a |
| n.d.= not detected; Each value in the table represents the mean ± SD (n = 3). SFA: Saturated fatty acids, MUFA: Monounsaturated fatty acids, PUFA: Polyunsaturated fatty acids, WO: Walnut oil, AO: Almond oil. Significant differences are indicated by different lower case letters on the same line. Differences were significant at the level of 0.05 as compared by ANOVA (Tukey-Kramer HSD test). |
The results of the accelerated oxidation of the oils at 60 °C are shown in Table 1b. As the storage time increased, the six oils showed a similar trend: the content of PUFAs decreased, while the content of MUFAs and SFAs increased. The results indicated that the PUFAs were destroyed during the accelerated oxidation process, which may be related to the destruction of C=C bonds by oxidation and polymerization (Tilakavati and Kalyana, 2013). Overall, there were few differences in the fatty acid contents of the six oils at the beginning and on the 24th day of the accelerated storage experiment, and the content of unsaturated fatty acid was still high.
Table 1b. Changes in fatty acid composition characteristics during oven test for original WO, AO and blended oils (5, 10, 20, 30 of AO), %
| |
Days |
0 |
4 |
8 |
12 |
16 |
20 |
24 |
| WO |
SFA |
9.99 ± 0.02Ad |
10.08 ± 0.02Ac |
10.02 ± 0.09Acd |
10.07 ± 0.02Ac |
10.06 ± 0.03Ac |
10.17 ± 0.02Ab |
10.24 ± 0.04Aa |
| MUFA |
20.14 ± 0.07Fd |
20.18 ± 0.03Fd |
20.35 ± 0.03Fc |
20.35 ± 0.01Fc |
20.36 ± 0.03Fc |
20.47 ± 0.02Fb |
20.64 ± 0.04Fa |
| PUFA |
69.87 ± 0.05Aa |
69.73 ± 0.05Ab |
69.63 ± 0.10Ac |
69.57 ± 0.02Ac |
69.57 ± 0.01Ac |
69.37 ± 0.04Ad |
69.12 ± 0.08Ae |
| PUFA/SFA |
7.00 ± 0.01Aa |
6.92 ± 0.02Ab |
6.95 ± 0.07Aab |
6.91 ± 0.02Ab |
6.92 ± 0.02Ab |
6.82 ± 0.02Ac |
6.75 ± 0.03Ad |
| n-6/n-3 |
5.73 ± 0.00Fe |
5.78 ± 0.01Fd |
5.79 ± 0.01Fd |
5.80 ± 0.00Fcd |
5.81 ± 0.00Fc |
5.83 ± 0.00Db |
5.90 ± 0.01Ea |
| 5% |
SFA |
9.85 ± 0.02Bb |
9.83 ± 0.02Bb |
9.74 ± 0.02Bd |
9.79 ± 0.01Bc |
9.76 ± 0.03Bcd |
9.84 ± 0.02Bb |
10.02 ± 0.01Ba |
| MUFA |
22.31 ± 0.02Ed |
22.30 ± 0.01Ed |
22.45 ± 0.04Ec |
22.51 ± 0.03Ec |
22.49 ± 0.04Ec |
22.67 ± 0.06Eb |
22.75 ± 0.02Ea |
| PUFA |
67.84 ± 0.01Ba |
67.88 ± 0.02Ba |
67.81 ± 0.05Bab |
67.70 ± 0.03Bb |
67.75 ± 0.07Bb |
67.49 ± 0.08Bc |
67.23 ± 0.03Bd |
| PUFA/SFA |
6.89 ± 0.02Bbc |
6.91 ± 0.01ABb |
6.96 ± 0.02Aa |
6.91 ± 0.00Ab |
6.94 ± 0.03Aab |
6.86 ± 0.02Ac |
6.71 ± 0.01Bd |
| n-6/n-3 |
5.84 ± 0.00Ee |
5.90 ± 0.01Ed |
5.89 ± 0.01Ed |
5.92 ± 0.00Ec |
5.91 ± 0.00Ecd |
5.95 ± 0.04Db |
6.00 ± 0.00DEa |
| 10% |
SFA |
9.63 ± 0.01Cb |
9.60 ± 0.01Cb |
9.64 ± 0.13Bab |
9.59 ± 0.08Cb |
9.53 ± 0.04Cb |
9.73 ± 0.03Cab |
9.75 ± 0.02Ca |
| MUFA |
24.42 ± 0.04De |
24.49 ± 0.01Dde |
24.50 ± 0.00Dd |
24.58 ± 0.03Dc |
24.61 ± 0.04Dc |
24.73 ± 0.05Db |
25.20 ± 0.09Da |
| PUFA |
65.95 ± 0.05Ca |
65.90 ± 0.01Cab |
65.86 ± 0.13Cab |
65.83 ± 0.05Cb |
65.85 ± 0.01Cab |
65.54 ± 0.08Cc |
65.05 ± 0.08Cd |
| PUFA/SFA |
6.85 ± 0.01Ca |
6.86 ± 0.00Ba |
6.83 ± 0.11Ba |
6.87 ± 0.06Aa |
6.91 ± 0.03Aa |
6.74 ± 0.03Bb |
6.67 ± 0.01BCb |
| n-6/n-3 |
5.97 ± 0.02De |
6.02 ± 0.01Dc |
5.99 ± 0.02Dd |
6.01 ± 0.01Dcd |
6.04 ± 0.00Db |
6.05 ± 0.01Db |
6.14 ± 0.00Da |
| 20% |
SFA |
9.19 ± 0.03Dbc |
9.15 ± 0.02Dc |
9.11 ± 0.10Cc |
9.21 ± 0.02Db |
9.13 ± 0.01Dc |
9.31 ± 0.01Da |
9.35 ± 0.04Da |
| MUFA |
28.63 ± 0.04Cd |
28.72 ± 0.02Cc |
28.76 ± 0.05Cc |
28.82 ± 0.01Cbc |
28.88 ± 0.01Cb |
29.08 ± 0.04Ca |
28.53 ± 0.08Ce |
| PUFA |
62.17 ± 0.02Da |
62.13 ± 0.01Da |
62.13 ± 0.04Da |
61.97 ± 0.02Db |
61.99 ± 0.20Db |
61.60 ± 0.05Dc |
62.13 ± 0.05Da |
| PUFA/SFA |
6.76 ± 0.01Db |
6.79 ± 0.02Cab |
6.82 ± 0.05Ba |
6.73 ± 0.01Bb |
6.79 ± 0.01Bab |
6.61 ± 0.01Cc |
6.64 ± 0.02Cc |
| n-6/n-3 |
6.24 ± 0.00Cd |
6.27 ± 0.00Ccd |
6.25 ± 0.01Cd |
6.28 ± 0.00Cc |
6.30 ± 0.00Cb |
6.34 ± 0.00Ca |
6.33 ± 0.03Ca |
| 30% |
SFA |
8.79 ± 0.02Eab |
8.74 ± 0.07Eb |
8.66 ± 0.07Dc |
8.74 ± 0.02Eb |
8.75 ± 0.02Eb |
8.84 ± 0.02Ea |
8.85 ± 0.03Ea |
| MUFA |
32.77 ± 0.03Bd |
32.94 ± 0.05Bc |
32.94 ± 0.06Bbc |
32.94 ± 0.07Bb |
32.94 ± 0.08Bb |
32.94 ± 0.09Ba |
32.94 ± 0.10Ba |
| PUFA |
58.43 ± 0.04Ea |
58.31 ± 0.11Eab |
58.31 ± 0.10Eab |
58.19 ± 0.05Eb |
58.20 ± 0.01Eb |
57.91 ± 0.03Ec |
57.89 ± 0.12Ec |
| PUFA/SFA |
6.64 ± 0.02Eb |
6.67 ± 0.06Dab |
6.73 ± 0.06Ba |
6.66 ± 0.02Cb |
6.65 ± 0.01Cb |
6.55 ± 0.02Dc |
6.54 ± 0.03Dc |
| n-6/n-3 |
6.55 ± 0.01Be |
6.58 ± 0.01Bd |
6.59 ± 0.01Bd |
6.60 ± 0.00Bc |
6.60 ± 0.01Bc |
6.66 ± 0.01Bb |
6.72 ± 0.01Ba |
| AO |
SFA |
5.87 ± 0.01Fb |
5.86 ± 0.01Fb |
5.87 ± 0.05Eb |
5.74 ± 0.06Fc |
5.82 ± 0.03Fb |
5.88 ± 0.04Fb |
5.95 ± 0.01Fa |
| MUFA |
61.16 ± 0.02Af |
61.49 ± 0.02Ae |
61.62 ± 0.04Ad |
61.81 ± 0.08Abc |
61.78 ± 0.03Ac |
61.87 ± 0.08Ab |
62.05 ± 0.02Aa |
| PUFA |
32.97 ± 0.02Fa |
32.65 ± 0.02Fb |
32.51 ± 0.04Fc |
32.44 ± 0.02Fd |
32.40 ± 0.01Fd |
32.25 ± 0.05Fe |
32.01 ± 0.02Ff |
| PUFA/SFA |
5.62 ± 0.01Fab |
5.57 ± 0.01Eb |
5.54 ± 0.05Cbc |
5.65 ± 0.06Da |
5.57 ± 0.03Db |
5.49 ± 0.03Ec |
5.38 ± 0.01Ed |
| n-6/n-3 |
15.40 ± 0.08Ac |
15.80 ± 0.10Ab |
15.67 ± 0.02Ab |
15.81 ± 0.08Ab |
15.87 ± 0.09Ab |
16.12 ± 0.20Aa |
15.88 ± 0.23Ab |
| Each value in the table represents the mean ± SD (n = 3). SFA: Saturated fatty acids, MUFA: Monounsaturated fatty acids, PUFA: Polyunsaturated fatty acids, WO: Walnut oil, AO: Almond oil. The different small and capital superscripts in the same row indicate significant differences between the means within the same oil sample and storage time. Differences were significant at the level of 0.05 as compared by ANOVA (Tukey-Kramer HSD test). |
3.2. Changes in tocopherol content during oxidationTOP
Table 2 reveals the content of tocopherols of WO, AO and WO/AO blends at different storage times. A lower tocopherol content was found for WO than that for AO, which was in agreement with the results of another work (Rabadán et al., 2018). The α- and γ-tocopherols were the main isomers in WO. The α-, γ-, and δ-tocopherol contents in WO were 45.42 ± 0.85, 74.08 ± 0.23 and 6.73 ± 0.03 mg/kg, respectively. Emre et al., (2018) showed that the total tocopherol content of WO was 469.41 ± 1.55 mg/kg, and the highest content of γ-tocopherol was 409.15 ± 1.98 mg/kg. Gao et al., (2018) studied the tocopherol content of WO in different walnut varieties, and the total tocopherol content ranged from 394 to 495 mg/kg. Our results were lower than the above results, probably because the oil refinement process reduced the tocopherol content. We found that the tocopherol composition of AO was similar to that of WO, and its total tocopherol content was 236.86 ± 3.16 mg/kg, which was approximately twice that of WO. The values are within the ranges reported by Zhou et al., (2019). In the four blended oils, the total tocopherol content increased with the increase in the proportion of AO, and there were consistent differences among the oil blends. Tocopherol is a naturally occurring component in vegetable oils and is a major lipid-soluble antioxidant (Tavakoli et al., 2018).
Table 2. Changes in tocopherol composition characteristics during oven test for original WO, AO and blended oils (5, 10, 20, 30% of AO), mg/kg
| |
Days |
0 |
4 |
8 |
12 |
16 |
20 |
24 |
| WO |
α-Tocopherol |
45.42 ± 0.85Ea |
11.75 ± 1.21Bb |
1.62 ± 0.33Ec |
|
|
|
| γ-Tocopherol |
74.08 ± 0.23Fa |
68.47 ± 0.30Ea |
54.00 ± 5.36Cb |
41.28 ± 8.61Bc |
31.51 ± 9.90Bd |
10.83 ± 1.16Ce |
3.20 ± 1.17Be |
| δ-Tocopherol |
6.73 ± 0.03Aa |
6.67 ± 0.64Aa |
6.57 ± 0.02Aa |
5.80 ± 0.06Ab |
5.28 ± 0.15Abc |
4.77 ± 0.31Ac |
3.91 ± 0.82Ad |
| Total-Tocopherol |
126.23 ± 0.60Fa |
88.02 ± 1.54Db |
62.19 ± 5.03Cc |
47.09 ± 8.55Bd |
36.79 ± 9.75Be |
15.61 ± 0.85Cf |
7.11 ± 3.99Bf |
| 5% |
α-Tocopherol |
48.21 ± 1.14Ea |
12.88 ± 1.20Bb |
2.14 ± 0.20Dc |
|
|
|
|
|
| γ-Tocopherol |
77.85 ± 0.40Ea |
74.95 ± 2.89Da |
57.27 ± 2.40Cb |
43.10 ± 1.94Bc |
32.04 ± 6.71Bd |
14.11 ± 7.98BCe |
3.50 ± 1.17Bf |
| δ-Tocopherol |
6.91 ± 0.20Aa |
6.75 ± 0.13Aa |
6.02 ± 0.01Bb |
5.67 ± 0.43Abc |
5.25 ± 0.33Ac |
4.52 ± 0.26Ad |
3.85 ± 0.15Ae |
| Total-Tocopherol |
132.96 ± 1.25Ea |
102.07 ± 4.86Cb |
65.44 ± 2.58Cc |
48.77 ± 5.37Bd |
37.30 ± 6.38Be |
18.63 ± 8.24BCf |
7.35 ± 1.31Bg |
| 10% |
α-Tocopherol |
52.16 ± 0.94Da |
13.71 ± 3.80Bb |
2.48 ± 0.15CDc |
|
|
|
| γ-Tocopherol |
81.93 ± 0.37Da |
78.21 ± 0.86Ca |
61.48 ± 8.64BCb |
49.08 ± 4.36ABc |
33.51 ± 3.85Bd |
19.28 ± 2.41Be |
3.79 ± 0.56Bf |
| δ-Tocopherol |
6.64 ± 0.11Aa |
6.37 ± 0.77ABab |
5.87 ± 0.07Bb |
5.36 ± 0.55ABbc |
5.27 ± 0.24Abc |
4.67 ± 0.33Ac |
3.40 ± 0.17Ad |
| Total-Tocopherol |
141.08 ± 0.95Da |
96.33 ± 1.31Cb |
69.83 ± 8.85BCc |
54.44 ± 4.21ABd |
38.78 ± 4.09Be |
23.95 ± 2.73Bf |
7.19 ± 0.39Bg |
| 20% |
α-Tocopherol |
56.53 ± 2.27Ca |
13.81 ± 1.15Bb |
2.73 ± 0.10Cc |
|
|
|
| γ-Tocopherol |
89.56 ± 0.73Ca |
79.77 ± 0.23Cb |
67.05 ± 3.69BCc |
53.10 ± 1.91ABd |
37.52 ± 1.79Be |
19.39 ± 3.78Bf |
5.03 ± 1.72Bg |
| δ-Tocopherol |
5.88 ± 0.05Ba |
5.56 ± 0.40Bab |
5.25 ± 0.56Cb |
5.03 ± 0.45ABbc |
5.06 ± 0.12Ab |
4.46 ± 0.21Ac |
4.00 ± 0.24Ac |
| Total-Tocopherol |
151.97 ± 2.51Ca |
99.15 ± 0.84Cb |
75.03 ± 9.09BCc |
58.13 ± 2.36ABd |
42.57 ± 1.71ABe |
23.85 ± 3.98Bf |
9.03 ± 1.96Bg |
| 30% |
α-Tocopherol |
63.06 ± 1.36Ba |
14.44 ± 0.81Bb |
3.53 ± 0.39Bc |
|
|
|
| γ-Tocopherol |
95.71 ± 0.32Ba |
89.69 ± 1.54Ba |
71.27 ± 6.19Bb |
58.80 ± 5.71ABc |
43.94 ± 3.73ABd |
22.95 ± 2.34ABe |
11.65 ± 1.57Af |
| δ-Tocopherol |
6.03 ± 0.24Ba |
5.43 ± 0.04Bb |
5.01 ± 0.37Cbc |
4.79 ± 0.31Bc |
4.64 ± 0.05Bc |
3.91 ± 0.35Bd |
3.32 ± 0.13Ae |
| Total-Tocopherol |
164.80 ± 1.44Ba |
116.10 ± 6.76Bb |
79.80 ± 6.88Bc |
63.59 ± 5.82ABd |
48.58 ± 3.71Ae |
26.87± 2.69ABf |
14.96 ± 1.70Ag |
| AO |
α-Tocopherol |
87.52 ± 2.30Aa |
20.98 ± 5.32Ab |
4.61 ± 0.17Ac |
|
|
|
| γ-Tocopherol |
145.70 ± 0.71Aa |
125.69 ± 0.32Ab |
89.72 ± 0.26Ac |
68.06 ± 7.13Ad |
48.34 ± 2.05Ae |
29.72 ± 2.66Af |
12.40 ± 0.25Ag |
| δ-Tocopherol |
3.64 ± 0.29Ca |
3.53 ± 0.41Ca |
3.07 ± 0.25Dab |
2.44 ± 0.82Cb |
2.29 ± 0.16Cb |
1.79 ± 0.44Cb |
1.04 ± 0.11Bc |
| Total-Tocopherol |
236.86 ± 3.16Aa |
143.66 ± 1.52Ab |
97.40 ± 0.33Ac |
70.50 ± 6.31Ad |
50.63 ± 1.97Ae |
31.50 ± 2.22Af |
13.44 ± 0.36Ag |
| Each value in the table represents the mean ± SD (n = 3). WO: Walnut oil, AO: Almond oil. The different small and capital superscripts in the same row indicate significant differences between the means within the same oil sample and storage time. Differences were significant at the level of 0.05 as compared by ANOVA (Tukey-Kramer HSD test). |
As the number of days of oxidation increased, the tocopherol contents tended to decrease. Moreover, the degrees of tocopherol loss were different for each isomer, especially for α-tocopherol, which decreased very rapidly and was below the detection limit by day 12. This phenomenon is consistent with previous studies, in which α-tocopherol is generally considered to provide hydrogen atoms to reduce peroxyl radicals at a greater rate than the γ- and δ-homologues. Consequently, having α-tocopherol preferentially oxidized, compared to other tocopherol isoforms, would also result in a greater formation of α-tocopheroxyl radicals. (María Ayelén and Baltanás, 2010, Elisia et al., 2013). γ-tocopherol has a weak hydrogen supply capacity and high oxidative stability, indicating that its antioxidant effect is better than that of α-tocopherol. The antioxidant activity in food systems is reduced in the following order: γ > δ > β > α isomers (Rudzińska et al., 2016). Our results indicated that AO has the highest γ-tocopherol content. On the 24th day, the tocopherol content of WO was the lowest; the tocopherol content of AO was the highest; and the tocopherol content of the blended oil with high AO content was high. Therefore, the presence of AO may increase the antioxidant properties of the blended oil.
3.3. Changes in plant sterol content during oxidationTOP
We found four phytosterols in WO and AO, namely, brassicasterol, campesterol, stigmasterol and β-sitosterol. As shown in Table 3, the content of each plant sterol in AO was higher than that of WO, and the total sterol content was 3121.04 ± 148.35 mg/kg. The total sterol content of WO was 1795.27 ± 56.27 mg/kg. There were significant differences in the plant sterol contents between different varieties of WO. The results of Gao et al., (2019) indicated that the total sterol content in WO was between 644.60 mg/kg and 1211.40 mg/kg, and sitosterol was the major sterol, which is consistent with our results. Amaral et al., (2003) studied different varieties of WO with a sterol content between 1201 mg/kg and 2026 mg/kg.
Table 3. Changes in phytosterol composition characteristics during oven test for original WO, AO and blended oils (5, 10, 20, 30% of AO), mg/kg
| |
|
0 |
4 |
8 |
12 |
16 |
20 |
24 |
| WO |
Brassicasterol |
324.57 ± 14.05aE |
266.76 ± 26.96bD |
197.04 ± 8.75cE |
193.38 ± 6.97cF |
193.43 ± 14.04cB |
155.79 ± 13.81dB |
134.64 ± 13.22dC |
| Campesterol |
225.77 ± 14.88aC |
210.48 ± 10.17abC |
208.29 ± 4.29abC |
201.35 ± 10.32bC |
196.67 ± 7.25bC |
197.63 ± 7.25bB |
189.58 ± 15.77bAB |
| Stigmasterol |
23.54 ± 1.69aD |
21.40 ± 1.50aB |
18.29 ± 0.86bB |
15.11 ± 2.17cC |
11.86 ± 1.39dD |
10.28 ± 1.32dC |
10.02 ± 2.38dB |
| β-Sitosterol |
1221.39 ± 54.21aC |
1199.83 ± 103.90aC |
1190.39 ± 80.50aC |
1147.78 ± 47.60aC |
1148.53 ± 31.60aC |
1146.91 ± 27.94aC |
1069.39 ± 29.61bC |
| Total |
1795.27 ± 56.27aE |
1698.47 ± 127.88abE |
1614.01 ± 69.52bD |
1557.62 ± 28.98bC |
1550.48 ± 13.05bC |
1510.62 ± 33.62bcC |
1403.63 ± 7.00cD |
| 5% |
Brassicasterol |
497.51 ± 59.40aD |
433.28 ± 8.87bC |
268.85 ± 11.34cD |
252.08 ± 8.96cE |
198.58 ± 17.46dB |
163.25 ± 17.71deB |
133.34 ± 6.80eC |
| Campesterol |
234.47 ± 9.99aC |
228.53 ± 8.91aC |
207.92 ± 10.02bC |
199.60 ± 1.13bcC |
199.48 ± 7.62bcC |
195.41 ± 4.46bcB |
185.33 ± 12.05cB |
| Stigmasterol |
22.95 ± 1.59aD |
22.53 ± 1.59aB |
19.13 ± 0.87bB |
15.65 ± 1.93cBC |
11.70 ± 1.36dD |
12.06 ± 2.22dC |
10.41 ± 1.06dB |
| β-Sitosterol |
1217.91 ± 92.92aC |
1183.08 ± 29.65aC |
1192.83 ± 66.45aC |
1150.94 ± 72.56aC |
1165.19 ± 21.35aC |
1127.59 ± 46.29aC |
1096.77 ± 21.39bC |
| Total |
1972.85 ± 44.42aD |
1867.42 ± 14.09bD |
1688.73 ± 68.48cD |
1618.28 ± 66.80cdD |
1574.93 ± 15.55dC |
1498.32 ± 63.58deC |
1425.85 ± 11.76eCD |
| 10% |
Brassicasterol |
659.46 ± 44.94aC |
516.16 ± 38.67bB |
326.83 ± 9.73cC |
300.17 ± 8.16cC |
250.16 ± 11.58dA |
225.86 ± 5.20dA |
159.06 ± 9.89eB |
| Campesterol |
244.47 ± 1.78aC |
226.74 ± 10.31bC |
211.95 ± 8.21bcC |
213.78 ± 9.19bcBC |
215.04 ± 9.07bcBC |
200.02 ± 3.65cB |
184.25 ± 13.28dB |
| Stigmasterol |
31.41 ± 1.52aB |
22.37 ± 0.54bB |
19.28 ± 1.36cB |
18.79 ± 0.77cB |
17.54 ± 0.82cdC |
15.87 ± 0.80dB |
11.99 ± 1.76eB |
| β-Sitosterol |
1290.40 ± 21.83aC |
1284.43 ± 6.48aB |
1273.33 ± 12.97aBC |
1268.22 ± 34.01aB |
1252.70 ± 41.65aB |
1180.89 ± 17.80bBC |
1129.66 ± 23.78cBC |
| Total |
2225.74 ± 66.46aC |
2049.71 ± 35.04bC |
1831.38 ± 32.20cC |
1800.96 ± 50.52cdC |
1735.44 ± 21.95dB |
1622.64 ± 11.55eB |
1484.96 ± 18.85fBC |
| 20% |
Brassicasterol |
714.04 ± 51.47aBC |
549.15 ± 13.30bB |
289.23 ± 15.00cCD |
281.02 ± 6.28cD |
266.42 ± 10.53cA |
210.62 ± 12.98dA |
180.31 ± 9.80dA |
| Campesterol |
283.82 ± 8.44aB |
236.00 ± 6.24bBC |
225.49 ± 14.75bcBC |
218.72 ± 10.24bcB |
222.80 ± 14.44bcB |
213.71 ± 4.36cB |
197.04 ± 11.25cAB |
| Stigmasterol |
28.51 ± 1.33aC |
23.34 ± 2.10bB |
20.15 ± 1.16bcB |
18.85 ± 3.22cB |
17.88 ± 1.98cdAC |
16.72 ± 1.58cdAB |
14.79 ± 1.33dA |
| β-Sitosterol |
1319.66 ± 34.35aC |
1294.79 ± 11.31abB |
1280.01 ± 34.89abB |
1237.89 ± 67.22bBC |
1231.49 ± 59.56bBC |
1137.79 ± 63.37cC |
1126.29 ± 21.89cBC |
| Total |
2346.04 ± 34.89aC |
2103.28 ± 27.93bBC |
1814.88 ± 36.25cC |
1756.49 ± 66.46cC |
1738.58 ± 86.44cB |
1578.84 ± 75.79dBC |
1518.43 ± 40.87dB |
| 30% |
Brassicasterol |
755.24 ± 8.66aB |
557.90 ± 23.64bB |
375.78 ± 13.25cB |
379.37 ± 7.53cB |
264.24 ± 20.26dA |
170.91 ± 15.46eB |
98.69 ± 8.70fD |
| Campesterol |
299.76 ± 14.17aAB |
253.39 ± 9.47bB |
235.24 ± 5.71bcB |
226.08 ± 5.68cB |
228.46 ± 20.35cB |
199.57 ± 21.37dB |
195.22 ± 5.67dAB |
| Stigmasterol |
32.83 ± 0.70aB |
26.98 ± 1.54bA |
23.24 ± 1.89cA |
22.52 ± 1.10cA |
18.64 ± 1.28dAC |
17.07 ± 1.79deAB |
14.67 ± 1.20eAB |
| β-Sitosterol |
1453.51 ± 18.24aB |
1368.48 ± 34.26bB |
1333.90 ± 38.15bB |
1317.17 ± 32.00bB |
1245.10 ± 59.76cB |
1212.40 ± 30.27cdB |
1150.22 ± 35.96dB |
| Total |
2541.34 ± 40.95aB |
2206.75 ± 40.78bB |
1968.17 ± 54.84cB |
1945.14 ± 23.01cB |
1756.43 ± 52.53dB |
1599.95 ± 64.76eBC |
1458.79 ± 29.88fC |
| AO |
Brassicasterol |
929.91 ± 52.03aA |
711.94 ± 45.87bA |
629.97 ± 46.50cA |
445.36 ± 5.33dA |
272.37 ± 9.68eA |
221.87 ± 5.83efA |
178.31 ± 10.88fA |
| Campesterol |
310.27 ± 13.10aA |
298.07 ± 13.24abA |
296.45 ± 4.77abA |
290.54 ± 11.11bA |
291.08 ± 12.22bA |
251.52 ± 10.36cA |
206.87 ± 4.56dA |
| Stigmasterol |
45.84 ± 2.42aA |
28.43 ± 1.17bA |
24.35 ± 1.64cA |
23.40 ± 0.39cA |
20.22 ± 1.29dA |
19.24 ± 1.77dA |
16.55 ± 0.90eA |
| β-Sitosterol |
1835 ± 112.60aA |
1762.29 ± 23.84abA |
1740.52 ± 12.38bA |
1684.90 ± 28.16bA |
1650.32 ± 39.69bA |
1395.04 ± 39.56cA |
1227.90 ± 36.25dA |
| Total |
3121.04 ± 148.35aA |
2800.74 ± 83.45bA |
2691.29 ± 28.47bA |
2444.20 ± 44.49cA |
2233.99 ± 43.12dA |
1887.66 ± 54.10eA |
1629.63 ± 29.90fA |
| Each value in the table represents the mean ± SD (n = 3). WO: Walnut oil, AO: Almond oil. The different small and capital superscripts in the same row indicate significant differences between the means within the same oil sample and storage time. Differences were significant at the level of 0.05 as compared by ANOVA (Tukey-Kramer HSD test). |
As the proportion of AO increased, the total sterol content in the blended oil also increased and was significantly higher than that of WO. In recent years, interest in the consumption of phytosterols has increased (Torri et al., 2019). Studies have shown that a human diet rich in natural phytosterols helps lower plasma cholesterol levels and coronary artery mortality (Cusack et al., 2013). Torri et al., (2019) formulated rapeseed oil with rice bran oil or black cumin oil in the ratios of 95:5, 90:10 and 80:20. They found that the blending of rapeseed oil and rice bran oil had a positive effect on the total amount of sterols, and the blending of rapeseed oil and cumin oil improved the composition of its sterols.
During the accelerated oxidation process, the sterol content of the different oils showed a decreasing trend, but the overall decrease was slow. On day 24, the sterol contents of WO and AO were 1403 ± 7.00 mg/kg and 1629.63 mg/kg, respectively. There was a distinct difference in the total sterol content between different blended oils, and the blended oil with a high proportion of AO had a high phytosterol content during the accelerated oxidation process. After adding phytosterols to margarine-type spreads and biscuits, Nieminen et al., (2016) found that the plant sterol content remained stable for a long period of time at room temperature and could be stored for at least 74 weeks. In addition, Yang et al., (2018) found that after adding 1% phytosterols to soybean oil, phytosterols acted as antioxidants, which improved the oxidative stability of the oil, while the results of Winkler and Warner (2008) showed that the addition of phytosterols had no effect on the oxidative stability of soybean oil.
3.4. Changes in squalene content during oxidationTOP
Table 4 shows that the content of squalene in AO was the highest; the content of squalene in WO was the lowest; and the content of squalene in the blended oils increased with the increasing proportions of AO. After 24 days of storage, each oil showed a slight decrease in squalene content but did not change much. Alberdi-Cedeño et al., (2019) ventilated corn oil in an oven at 70 °C for 3, 6, 9 and 12 days and found that its squalene content decreased very slowly in the first 9 days, which is consistent with our findings. Rastrelli et al., (2002) suggested that α-tocopherol protects squalene by preventing or delaying its degradation under storage conditions, which may be an explanation for our results. This may also be due to the oxidative stability of squalene itself. It has been suggested that squalene contributes to the oxidative stability of olive oil at ambient or slightly elevated temperatures (Hrncirik and Fritsche, 2005).
Table 4. Changes in squalene composition characteristics during oven test for original WO, AO and blended oils (5, 10, 20, 30% of AO), mg/kg
| Days |
0 |
4 |
8 |
12 |
16 |
20 |
24 |
| WO |
10.84 ± 0.18Ca |
8.72 ± 0.42Db |
9.04 ± 0.09Ea |
9.51 ± 0.49Ca |
9.02 ± 1.83Ba |
10.42 ± 1.22Da |
8.82 ± 0.20Ca |
| 5% |
12.27 ± 0.15Ca |
11.29 ± 0.02Cab |
10.67 ± 1.17Db |
10.70 ± 0.05BCb |
10.59 ± 0.81Bb |
11.63 ± 0.40CDab |
10.79 ± 0.39BCb |
| 10% |
13.80 ± 0.49BCa |
12..44 ± 0.40Cb |
11.00 ± 0.09CDc |
11.77 ± 0.53BCbc |
10.37 ± 0.41Bc |
11.89 ± 0.28CDbc |
10.98 ± 0.63BCc |
| 20% |
14.08 ± 0.29BCa |
13.41 ± 0.18BCab |
12.20 ± 0.16Cb |
13.15 ± 0.51Bab |
10.85 ± 1.51Bb |
12.85 ± 0.52Cab |
10.74 ± 0.66BCb |
| 30% |
15.69 ± 0.21Ba |
14.96 ± 0.04Ba |
14.39 ± 0.15Bab |
13.09 ± 0.28Bab |
13.34 ± 2.67Bab |
14.87 ± 0.26Ba |
12.09 ± 1.53Bb |
| AO |
25.56 ± 1.99Aa |
24.53 ± 1.68Aa |
21.37 ± 0.12Aab |
21.14 ± 2.84Aab |
22.41 ± 3.35Aab |
24.19 ± 0.58Aa |
17.88 ± 1.64Ab |
| Each value in the table represents the mean ± SD (n = 3). WO: Walnut oil, AO: Almond oil. The different small and capital superscripts in the same row indicate significant differences between the means within the same oil sample and storage time. Differences were significant at the level of 0.05 as compared by ANOVA (Tukey-Kramer HSD test). |
Squalene is associated with a decrease in the serum levels of triglycerides and cholesterol and has protective effects against various cancers. Therefore, the addition of AO to WO had increased the squalene content, which also played a role in the prevention of a variety of cancers and oxidation stability (Smith, 2000).
3.5. Primary oxidation productsTOP
Peroxide value (POV). Hydroperoxide is the primary oxidation product of lipids. The peroxide value can be used to evaluate the early oxidation stage of lipids (Mohdaly et al., 2010). The results of the accelerated oxidation of WO, AO and the blended oils at 60 °C are shown in Figure 1a. Initially, the WO and AO had values of 4.24 ± 0.26 and 3.94 ± 0.31 meq O2/kg, respectively. Rabadán et al., (2018) studied the oxidative stability of different nut oils under refrigeration and room temperature storage. The peroxide values of the WO and AO were 1.3 ± 0.5 and 2.6 ± 0.7 meq O2/kg, respectively, which were slightly lower than our results. The POVs of the blended oils were higher than those of the two oils, most likely due to the formation of peroxides during the blending process. After 24 days, the peroxide values of the oils increased. With the extension of storage time, the peroxide value of WO was higher than that of AO. The increase in the peroxide values of the blended oils was slower, indicating that the addition of AO inhibited the oxidation of WO, probably due to the large amount of tocopherol in AO.
|
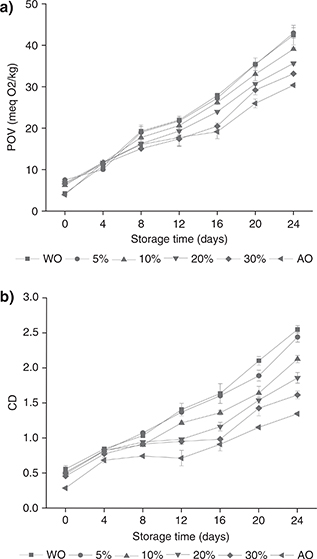 Figure 1. Changes in POV (a) and CD (b) of WO, AO and blended oils (5, 10, 20, 30% of AO) at different times during 24 days of storage at 60 °C. Each value in the table represents the mean ± SD (n = 2). WO: Walnut oil, AO: Almond oil, POV: Peroxide value, CD: Conjugated diene value. Figure 1. Changes in POV (a) and CD (b) of WO, AO and blended oils (5, 10, 20, 30% of AO) at different times during 24 days of storage at 60 °C. Each value in the table represents the mean ± SD (n = 2). WO: Walnut oil, AO: Almond oil, POV: Peroxide value, CD: Conjugated diene value.
|
|
Conjugated dienes (CD). The side chains of unsaturated fatty acids are accompanied by the formation of conjugated diene hydroperoxides during their oxidation. Conjugated diene is a primary oxidation product produced by the oxidation of an unsaturated fatty acid double bond (Weber et al., 2008). Conjugated dienes have a unique absorption peak at approximately 232 nm (Ramadan and Wahdan, 2012). The higher the level of conjugated dienes in the edible oil, the worse the oxidative stability (Mohdaly et al., 2010).
During storage, the maximum increase in CD was found in WO, which increased from 0.55 to 2.55, and the minimum increase was in AO, which increased from 0.28 to 1.35, as shown in Figure 1b. As the number of storage days increased, the content of conjugated diene continued to increase, and all samples showed a linear growth trend; all final CD values were significantly higher than the initial values. The CD values of the blended oils were between the WO and AO, and the blended oil with a high proportion of AO exhibited a slow increase in the CD value. Rabadán et al., (2018) showed that after storage for 16 months at room temperature, the CD value of WO was 2.94 ± 0.10, and the CD value of AO was 3.25 ± 0.09. After mixing corn oil with black cumin (Nigella sativa) or coriander (Coriandrum sativum) seed oils, Ramadan et al., (2012) found that the CD value was significantly lower than that of the corn oil itself during 15 days of accelerated storage.
3.6. Secondary oxidation productsTOP
p-Anisidine Value (p-AnV). The secondary oxidation products of lipid oxidation are aldehydes and ketones. The p-AnV reflects how many secondary oxidation products are present (Ismail et al., 2016). The p-AnV of WO, AO and blended oils are shown in Figure 2a under storage conditions of 60 °C. During the whole storage process, the p-AnV showed an increasing trend. On the 24th day, the p-AnV of the AO and blended oils were lower than that of WO, probably due to the good oxidative stability of the AO. The results of Emre et al., (2018) showed that the anisidine value of WO increased to 46.83 after 20 days of accelerated storage, similar to our findings. Homan and Fereidoon (2008) studied the oxidative stability of different tree nut oils. After 12 days of accelerated oxidation, the p-AnV of WO was significantly higher than that of AO.
|
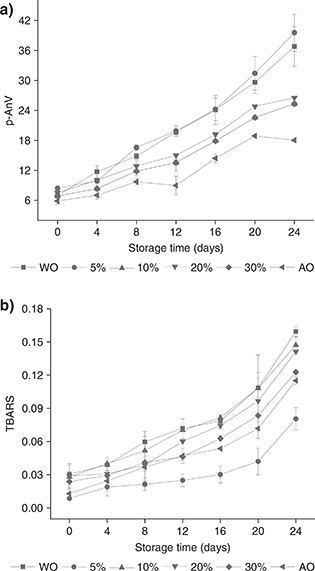 Figure 2. Changes in p-AnV (a) and TBARS (b) of WO, AO and blended oils (5, 10, 20, 30% of AO) at different times during 24 days of storage at 60 °C. Each value in the table represents the mean ± SD (n = 2). WO: Walnut oil, AO: Almond oil, p-AnV: p-Anisidine value, TBARS: Thiobarbituric acid value. Figure 2. Changes in p-AnV (a) and TBARS (b) of WO, AO and blended oils (5, 10, 20, 30% of AO) at different times during 24 days of storage at 60 °C. Each value in the table represents the mean ± SD (n = 2). WO: Walnut oil, AO: Almond oil, p-AnV: p-Anisidine value, TBARS: Thiobarbituric acid value.
|
|
Thiobarbituric acid reactive substances (TBARS). To more comprehensively evaluate the degree of oxidation of the edible oils, the TBARS value during the oxidation process
was measured. The final oxidation product of edible oils, malondialdehyde, reacts with TBA to form a colored compound with a maximum absorption at 530 nm (Zhang et al., 2017). The results of TBARS values are shown in Figure 2b. During the 24-day accelerated oxidation process, the TBARS value of the six oils increased slowly as the number of days of storage increased. Similarly, the values of the blended oils were between those of WO and AO. In general, the TBARS value showed an increasing trend with the increase in storage time for all samples, but no regular pattern of increase could be observed. Kenaston et al., (1955) reported that the TBA method is very sensitive in determining the oxidation products of linoleic acid and linolenic acid and is less sensitive in determining the oxidation products of oleic acid.
3.7. The relationship between the antioxidants and oxidation productsTOP
Tocopherols, phenols and sterol compounds are essential compounds and are present in trace amounts in edible oils (Ramadan and Wahdan, 2012). Oxidative stability is a key factor in the evaluation of the sensory and nutritional properties of oils, and the sensitivity of oils to oxidative degradation is affected by trace components (Anderson et al., 2001). It can be seen from Table 5 that there was a different degree of negative correlation between the active ingredients in the edible oil and the oxidation products. This indicated that in the accelerated oxidation process, bioactive substances such as tocopherol, phytosterol and squalene decreased, and the oxidation products increased. The primary oxidation products of edible oils are characterized by POV and CD, and p-AnV and TBARS values indicate their secondary oxidation products (Baştürk et al., 2018). In addition to δ-tocopherol, the other tocopherols and total tocopherols had a strong negative correlation with the oxidation products, and these tocopherols were more strongly correlated with primary oxidation products. In the oxidation process of oil, tocopherol is a good free radical scavenger, providing a hydrogen atom for free radicals to form a stable quinine or dimer, thereby terminating the chain reaction in the auto-oxidation process and ensuring the stability of the oil (Xu and Hanna, 2010). Phytosterols had similar correlations with the primary oxidation products and the secondary oxidation products. The correlation between squalene and the oxidation products was the weakest, showing a moderate correlation. Our results are agreement with Gao et al., (2019), who showed that the oxidation stability index in WO was significantly correlated with tocopherols, squalene and stigmasterol.
Table 5. Correlations between micronutrients and oxidation products
| |
α-Tocopherol |
γ-Tocopherol |
δ-Tocopherol |
Total-Tocopherol |
Brassicasterol |
Campesterol |
Stigmasterol |
β-Sitosterol |
Total |
squalene |
| POV |
−0.684 |
−0.909 |
−0.472 |
−0.847 |
−0.781 |
−0.586 |
−0.815 |
−0.525 |
−0.713 |
−0.302 |
| CD |
−0.621 |
−0.874 |
−0.299 |
−0.842 |
−0.766 |
−0.74 |
−0.829 |
−0.616 |
−0.753 |
−0.448 |
| p-AnV |
−0.586 |
−0.879 |
−0.306 |
−0.796 |
−0.766 |
−0.599 |
−0.778 |
−0.608 |
−0.745 |
−0.404 |
| TBARS |
−0.51 |
−0.843 |
−0.249 |
−0.774 |
−0.729 |
−0.741 |
−0.755 |
−0.638 |
−0.744 |
−0.48 |
| POV: Peroxide value, CD: Conjugated diene value, p-AnV: p-Anisidine value, TBARS: Thiobarbituric acid value. Fully correlated, |r| =1; highly correlated or strongly correlated, 0.7≤ |r| < 1; moderately correlated, 0.4≤ |r| < 0.7; weak correlation, |r| < 0.4; zero correlation, r = 0. And r represents the correlation coefficient. Negative values represent a negative correlation. |
4. CONCLUSIONSTOP
The WO and AO blends have achieved the desired goals in improving nutrition and functionality compared to those of WO. With the increase in the proportion of AO, the oleic acid content in the blended oil increased, and the fatty acid composition was more balanced. The contents of tocopherol, phytosterol and squalene in the blended oil increased due to the high content of trace nutrients in the AO. After 24 days of accelerated oxidation, the trace components of the six oils gradually decreased, while the POV, CD, p-AnV, and TBARS value increased, indicating that the oil sample quality gradually deteriorated, but the blended oils produced lower concentrations of primary and secondary oxidation products, indicating a significant increase in oxidative stability. In addition, we compared the correlation between micronutrients and oxidation products and found that they had different degrees of negative correlation. This has important theoretical and practical significance for predicting the oxidation process of blended oils.
ACKNOWLEDGMENTSTOP
The authors acknowledge the financial support provided by Changchun Science and Technology Bureau (NO. 18SS030), the Program for JLU Science and Technology Innovative Research Team (NO. 2017TD-29), and Jilin Province Science and Technology Development project (NO.20190301058NY).
REFERENCESTOP
| ○ |
Alberdi-Cedeño J, Ibargoitia ML, Guillén MD. 2019. Monitoring of minor compounds in corn oil oxidation by Direct Immersion-Solid Phase Microextraction-Gas Chromatography/Mass Spectrometry. New oil oxidation markers. Food Chem. 290, 286–294. https://doi.org/10.1016/j.foodchem.2019.04.001 |
| ○ |
Amaral JS, Susana C, Pereira JA, Seabra RM, Oliveira BPP. 2003. Determination of sterol and fatty acid compositions, oxidative stability, and nutritional value of six walnut (Juglans regia L.) cultivars grown in Portugal. J. Agric. Food. Chem. 51, 698–702. https://doi.org/10.1021/jf030451d |
| ○ |
Baştürk A, Ceylan MM, Çavuş M, Boran G, Javidipour I. 2018. Effects of some herbal extracts on oxidative stability of corn
oil under accelerated oxidation conditions in comparison with some commonly used antioxidants. LWT 89, 358–364. https://doi.org/10.1016/j.lwt.2017.11.005 |
| ○ |
Bhatnagar AS, Kumar PKP, Hemavathy J, Krishna AGG. 2009. Fatty Acid Composition, Oxidative Stability, and Radical Scavenging Activity of Vegetable Oil Blends with Coconut Oil. J. Am. Oil Chem. Soc. 86, 991–999. https://doi.org/10.1007/s11746-009-1435-y |
| ○ |
Cao J, Li H, Xia X, Zou XG, Li J, Zhu XM, Deng ZY. 2015. Effect of Fatty Acid and Tocopherol on Oxidative Stability of Vegetable Oils with Limited Air. Int. J. Food Prop. 18, 808–820. https://doi.org/10.1080/10942912.2013.864674 |
| ○ |
Changmo L, Yunping Y, Guozhong Z, Wen C, Huilin L, Chunyang L, Zhen S, Yao C, Shuo W. 2011. Comparison and analysis of fatty acids, sterols, and tocopherols in eight vegetable oils. J. Agric. Food. Chem. 59, 12493–12498. https://doi.org/10.1021/jf203760k |
| ○ |
Choudhary M, Grover K, Kaur G. 2015. Development of rice bran oil blends for quality improvement. Food Chem. 173, 770–777. https://doi.org/10.1016/j.foodchem.2014.10.051 |
| ○ |
Cusack LK, Fernandez ML, Volek JS. 2013. The food matrix and sterol characteristics affect the plasma cholesterol lowering of phytosterol/phytostanol. Adv. Nutr. 4, 633–643. https://doi.org/10.3945/an.113.004507 |
| ○ |
Elisia I, Young JW, Yuan YV, Kitts DD. 2013. Association between tocopherol isoform composition and lipid oxidation in selected multiple edible oils. Food Res. Int. 52, 508–514. https://doi.org/10.1016/j.foodres.2013.02.013 |
| ○ |
Emre B. 2018. Oxidative stability of enriched walnut oil with phenolic extracts from walnut press-cake under accelerated oxidation conditions and the effect of ultrasound treatment. J. Food Meas. Charact. 13, 43–50. https://doi.org/10.1007/s11694-018-9917-y |
| ○ |
Farahmandfar R, Asnaashari M, Pourshayegan M, Maghsoudi S, Moniri H. 2018. Evaluation of antioxidant properties of lemon verbena (Lippia citriodora) essential oil and its capacity in sunflower oil stabilization during storage time. Food Sci. Nutr. 6, 983–990. https://doi.org/10.1002/fsn3.637 |
| ○ |
Gao P, Liu R, Jin Q, Wang X. 2019. Comparative study of chemical compositions and antioxidant capacities of oils obtained from two species of walnut: Juglans regia and Juglans sigillata. Food Chem. 279, 279–287. https://doi.org/10.1016/j.foodchem.2018.12.016 |
| ○ |
Givianrad MH, Saber-Tehrani M, Mohammadi SJ. 2013. Chemical composition of oils from wild almond (Prunus scoparia) and wild pistachio (Pistacia atlantica). Grasas Aceites 64, 77–84. https://doi.org/10.3989/gya.070312 |
| ○ |
Gliszczyńska-Świgło A, Sikorska E. 2004. Simple reversed-phase liquid chromatography method for determination of tocopherols in edible plant oils. J. Chromatog. A 1048, 195–198. https://doi.org/10.1016/j.chroma.2004.07.051 |
| ○ |
Hart S, Marnane C, Mcmaster C, Thomas A. 2018. Development of the “Recovery from Eating Disorders for Life” Food Guide (REAL Food Guide) - a food pyramid for adults with an eating disorder. J. Eat. Disorder 6, 6. https://doi.org/10.1186/s40337-018-0192-4 |
| ○ |
Hashempour-Baltork F, Torbati M, Azadmard-Damirchi S, Savage GP. 2016. Vegetable Oil Blending: A Review of Physicochemical, Nutritional and Health Effects. Trends Food Sci. Tech. 57, 52–58. https://doi.org/10.1016/j.tifs.2016.09.007 |
| ○ |
Hrncirik K, Fritsche S. 2005. Relation between the endogenous antioxidant system and the quality of extra virgin olive oil under accelerated storage conditions. J. Agric. Food. Chem. 53, 2103–2110. https://doi.org/10.1021/jf048363w |
| ○ |
Jiang Q, Rao X, Kim CY, Freiser H, Zhang Q, Jiang Z, Li G. 2011. Gamma-tocotrienol induces apoptosis and autophagy in prostate cancer cells by increasing intracellular dihydrosphingosine and dihydroceramide. Int. J. Cancer 130, 685–693. https://doi.org/10.1002/ijc.26054 |
| ○ |
Kenaston CB, Wilbur KM, Ottolenghi A, Bernheim F. 1955. Comparison of methods for determining fatty acid oxidation produced by ultraviolet irradiation. J. Am. Oil Chem. Soc. 32, 33–35. https://doi.org/10.1007/BF02636476 |
| ○ |
Li Y, Zhang Y, Wang M, Jiang L, Sui X. 2013. Simplex-Centroid Mixture Design Applied to the Aqueous Enzymatic Extraction of Fatty Acid-Balanced Oil from Mixed Seeds. J. Am. Oil Chem. Soc. 90, 349–357. https://doi.org/10.1007/s11746-012-2180-1 |
| ○ |
Matthäus B, Juhaimi FA, Adiamo OQ, Alsawmahi ON, Ghafoor K, Babiker EE. 2018. Effect of the Harvest Time on Oil Yield, Fatty Acid, Tocopherol and Sterol Contents of Developing Almond and Walnut Kernels. J. Oleo Sci. 67, 39–45. https://doi.org/10.5650/jos.ess17162 |
| ○ |
Micić DM, Ostojić SB, Simonović MB, Krstić G, Pezo LL, Simonović BR. 2015. Kinetics of blackberry and raspberry seed oils oxidation by DSC. Thermochim. Acta 601, 39–44. https://doi.org/10.1016/j.tca.2014.12.018 |
| ○ |
Mohanan A, Nickerson MT, Ghosh S. 2018. Oxidative Stability of Flaxseed Oil: Effect of Hydrophilic, Hydrophobic and Intermediate
Polarity Antioxidants. Food Chem. 266, 524–533. https://doi.org/10.1016/j.foodchem.2018.05.117 |
| ○ |
Mohdaly AA, Sarhan MA, Mahmoud A, Ramadan MF, Smetanska I. 2010. Antioxidant efficacy of potato peels and sugar beet pulp
extracts in vegetable oils protection. Food Chem. 123, 1019–1026. https://doi.org/10.1016/j.foodchem.2010.05.054 |
| ○ |
Nagao T, Munkhjargal B, Miho Y, Yuko O. 2008. Chemical properties and cytotoxicity of thermally oxidized oil. J. Oleo Sci. 57, 153–60. https://doi.org/10.1016/j.foodchem.2010.05.054 |
| ○ |
Nieminen V, Laakso P, Kuusisto P, Niemelä J, Laitinen K. 2016. Plant stanol content remains stable during storage of cholesterol-lowering
functional foods. Food Chem. 196, 1325–1330. https://doi.org/10.1016/j.foodchem.2015.10.059 |
| ○ |
Nogueira MS, Scolaro B, Milne GL, Castro IA. 2018. Oxidation products from omega-3 and omega-6 fatty acids during a simulated
shelf life of edible oils. LWT 101, 113–122. https://doi.org/10.1016/j.lwt.2018.11.044 |
| ○ |
Pagani María Ayelén, Baltanás MA. 2010. Production of natural antioxidants from vegetable oil deodorizer distillates: effect of catalytic hydrogenation. Bioresource Technology 101, 1369–1376. https://doi.org/10.1016/j.biortech.2009.09.068 |
| ○ |
Rabadán A, Álvarez-Ortí M, Pardo JE, Alvarruiz A. 2018. Storage stability and composition changes of three cold-pressed nut
oils under refrigeration and room temperature conditions. Food Chem. 259, 31–35. https://doi.org/10.1016/j.foodchem.2018.03.098 |
| ○ |
Ramadan MF, Wahdan KMM. 2012. Blending of corn oil with black cumin (Nigella sativa) and coriander (Coriandrum sativum) seed oils: Impact on functionality, stability and radical scavenging activity. Food Chem. 132, 873–879. https://doi.org/10.1016/j.foodchem.2011.11.054 |
| ○ |
Rastrelli L, Passi S, Ippolito F, Vacca G, De SF. 2002. Rate of degradation of alpha-tocopherol, squalene, phenolics, and polyunsaturated fatty acids in olive oil during different storage conditions. J. Agric. Food. Chem. 50, 55–66. https://doi.org/10.1021/jf011063j |
| ○ |
Rudzińska M, Hassanein MMM, Abdel–Razek AG, Ratusz K, Siger A. 2016. Blends of rapeseed oil with black cumin and rice bran
oils for increasing the oxidative stability. J. Food Sc. Tech. 53, 1–8. https://doi.org/10.1007/s13197-015-2140-5 |
| ○ |
Smith TJ. 2000. Squalene: potential chemopreventive agent. Expert Opin. Inv. Drug 9, 1841–1848. https://doi.org/10.1517/13543784.9.8.1841 |
| ○ |
Tavakoli J, Emadi T, Hashemi SMB, Khaneghah AM, Munekata PES, Lorenzo JM, Brnčić M, Barba FJ. 2018. Chemical properties and oxidative stability of Arjan (Amygdalu sreuteri) kernel oil as emerging edible oil. Food Res. Int. 107, 378–384. https://doi.org/10.1016/j.foodres.2018.02.002 |
| ○ |
Tilakavati K, Kalyana S. 2013. Modulation of human postprandial lipemia by changing ratios of polyunsaturated to saturated (P/S) fatty acid content of blended dietary fats: a cross-over design with repeated measures. Nutrition Journal 12, 122–122. https://doi.org/10.1186/1475-2891-12-122 |
| ○ |
Torri L, Bondioli P, Folegatti L, Rovellini P, Piochi M, Morini G. 2019. Development of Perilla seed oil and extra virgin olive oil blends for nutritional, oxidative stability and consumer acceptance improvements. Food Chem. 286, 584–591. https://doi.org/10.1016/j.foodchem.2019.02.063 |
| ○ |
Vaisali C, Belur PD, Regupathi I. 2016. Comparison of antioxidant properties of phenolic compounds and their effectiveness in imparting oxidative stability to Sardine oil during storage. LWT 69, 153–160. https://doi.org/10.1016/j.lwt.2016.01.041 |
| ○ |
Winkler JK, Warner K, 2008. The effect of phytosterol concentration on oxidative stability and thermal polymerization of heated oils. Eur. J. Lipid Sci. Tech. 110, 455–464. https://doi.org/10.1002/ejlt.200700265 |
| ○ |
Yang F, Oyeyinka SA, Xu W, Ying M, Zhou S. 2018. In vitro bioaccessibility and physicochemical properties of phytosterol linoleic ester synthesized from soybean sterol and linoleic acid. LWT 92, 265–271. https://doi.org/10.1016/j.lwt.2018.02.031 |
| ○ |
Zhou D, Pan Y, Ye J, Jia J, Ma J, Ge F. 2017. Preparation of walnut oil microcapsules employing soybean protein isolate and maltodextrin with enhanced oxidation stability of walnut oil. LWT 83, 292–297. https://doi.org/10.1016/j.lwt.2017.05.029 |